Financial Management Assignment: Valuation and Investment Analysis
VerifiedAdded on 2023/01/11
|16
|5065
|60
Homework Assignment
AI Summary
This assignment delves into financial management, focusing on valuation techniques and investment appraisal. It begins with an introduction to financial management, highlighting the significance of effective fund control. The core of the assignment addresses two key questions: The first question involves the application of valuation techniques, including the price earnings ratio, dividend valuation model (DDM), and discounted cash flow (DCF) methods, to analyze the value of Trojan Plc. The second question critically discusses the advantages and disadvantages of each valuation technique and recommends the most suitable method for Aztec Plc. The assignment also explores the payback period, a capital budgeting method, and its calculation for Lovewell Limited, aiding in investment decision-making. The solution provides detailed calculations, interpretations, and recommendations, offering a comprehensive analysis of financial management concepts.

FINANCIAL
MANAGEMENT
MANAGEMENT
Paraphrase This Document
Need a fresh take? Get an instant paraphrase of this document with our AI Paraphraser

Contents
INTRODUCTION...........................................................................................................................3
MAIN BODY..................................................................................................................................3
Question 2........................................................................................................................................3
Question 3........................................................................................................................................7
CONCLUSION..............................................................................................................................14
REFERENCES..............................................................................................................................16
INTRODUCTION
Financial management includes the preparation, management, supervision and control
and collection and utilization of the funds of the Company's financial transactions. In this
assessment, we have to address two problems which are focused on acquisition which takeover
and expenditure appraisal strategies (Brusca, Gómez‐villegas and Montesinos, 2016). Finance is
a company's lifeline. Finances, however, are always restricted, as are most other tools. In the
opposite, it still needs to remain infinite. It is therefore necessary for an organization to
effectively control its finances. Within this report, as an introduction to financial management is
mentioned. It includes applying the general management concepts to the financial resources of
the Business. There are many roles used for different purposes such as capital expenditure
forecasts, structure of money, the source of funds, allocation of funds, etc. In addition, second
problem is related to investment appraisal techniques.
Question 2
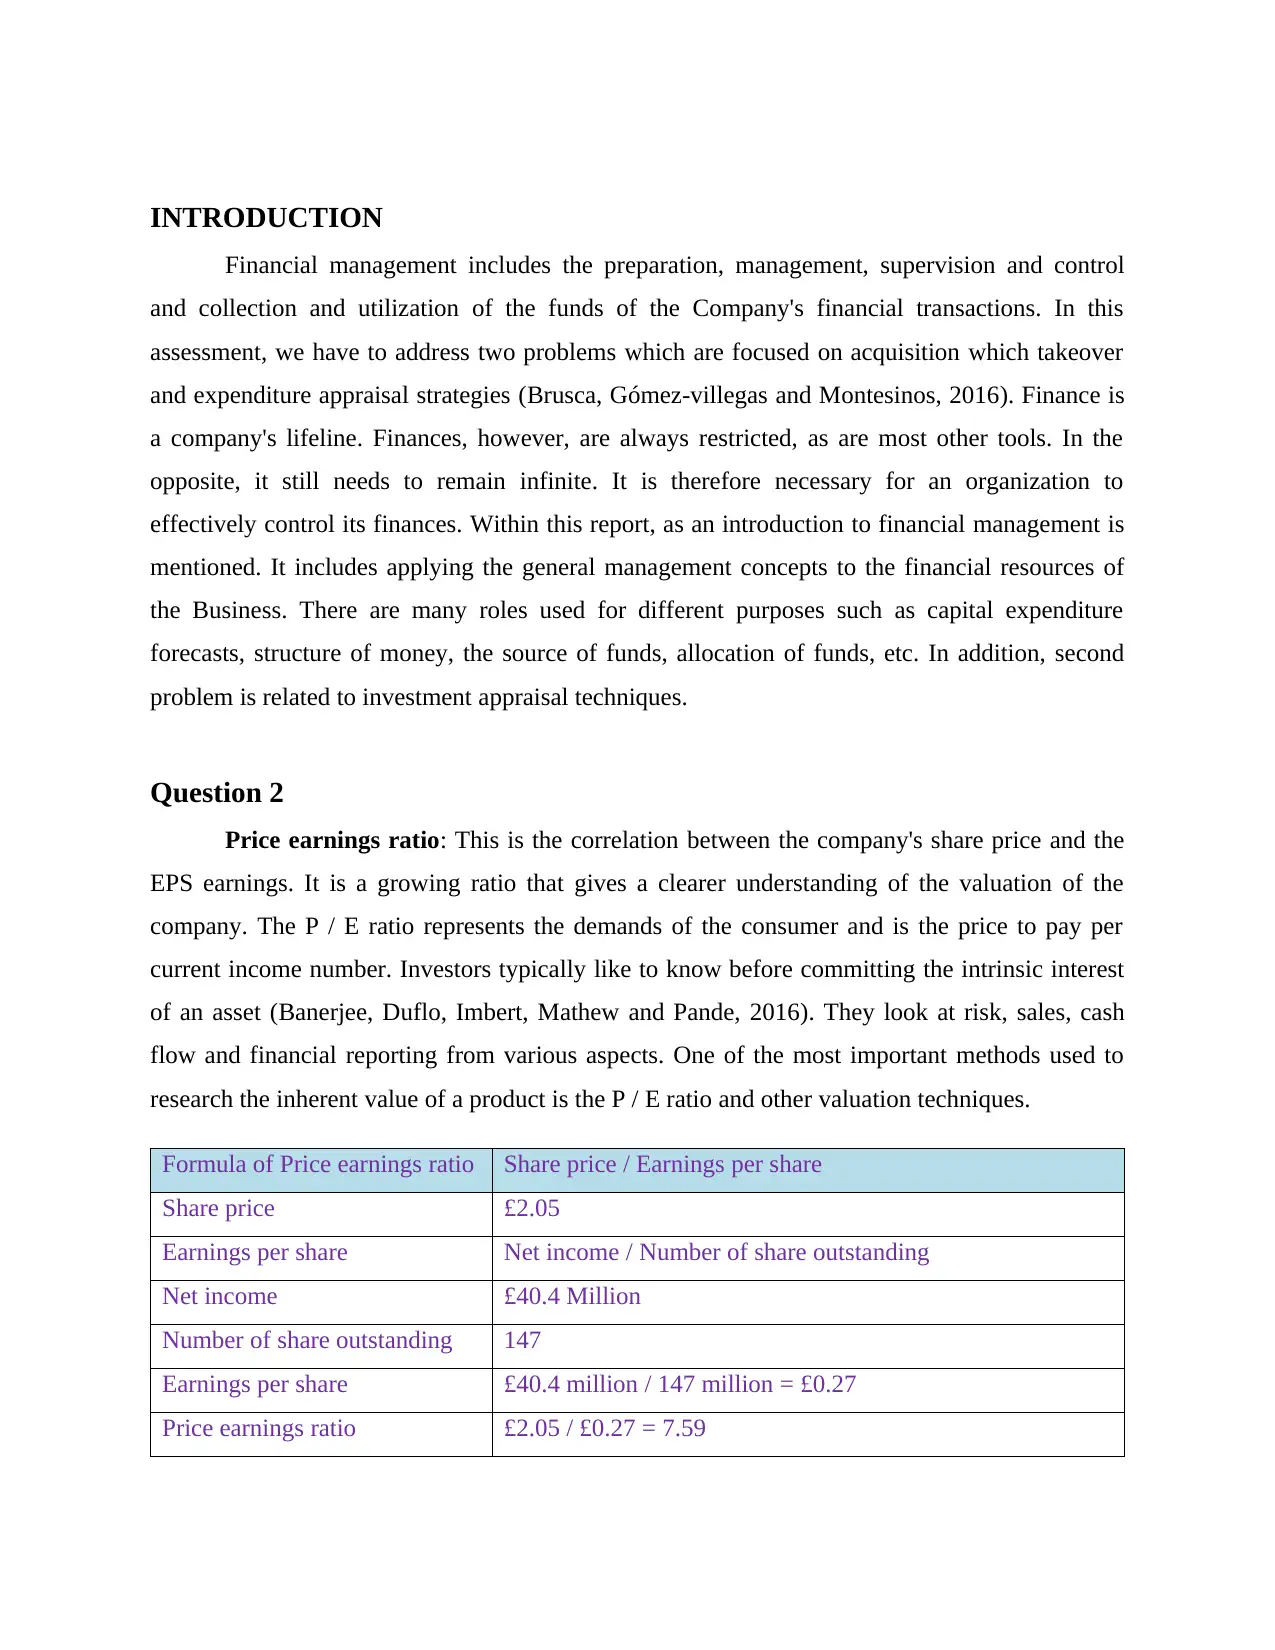
Price earnings ratio: This is the correlation between the company's share price and the
EPS earnings. It is a growing ratio that gives a clearer understanding of the valuation of the
company. The P / E ratio represents the demands of the consumer and is the price to pay per
current income number. Investors typically like to know before committing the intrinsic interest
of an asset (Banerjee, Duflo, Imbert, Mathew and Pande, 2016). They look at risk, sales, cash
flow and financial reporting from various aspects. One of the most important methods used to
research the inherent value of a product is the P / E ratio and other valuation techniques.
Formula of Price earnings ratio Share price / Earnings per share
Share price £2.05
Earnings per share Net income / Number of share outstanding
Net income £40.4 Million
Number of share outstanding 147
Earnings per share £40.4 million / 147 million = £0.27
Price earnings ratio £2.05 / £0.27 = 7.59
Financial management includes the preparation, management, supervision and control
and collection and utilization of the funds of the Company's financial transactions. In this
assessment, we have to address two problems which are focused on acquisition which takeover
and expenditure appraisal strategies (Brusca, Gómez‐villegas and Montesinos, 2016). Finance is
a company's lifeline. Finances, however, are always restricted, as are most other tools. In the
opposite, it still needs to remain infinite. It is therefore necessary for an organization to
effectively control its finances. Within this report, as an introduction to financial management is
mentioned. It includes applying the general management concepts to the financial resources of
the Business. There are many roles used for different purposes such as capital expenditure
forecasts, structure of money, the source of funds, allocation of funds, etc. In addition, second
problem is related to investment appraisal techniques.
Question 2
Price earnings ratio: This is the correlation between the company's share price and the
EPS earnings. It is a growing ratio that gives a clearer understanding of the valuation of the
company. The P / E ratio represents the demands of the consumer and is the price to pay per
current income number. Investors typically like to know before committing the intrinsic interest
of an asset (Banerjee, Duflo, Imbert, Mathew and Pande, 2016). They look at risk, sales, cash
flow and financial reporting from various aspects. One of the most important methods used to
research the inherent value of a product is the P / E ratio and other valuation techniques.
Formula of Price earnings ratio Share price / Earnings per share
Share price £2.05
Earnings per share Net income / Number of share outstanding
Net income £40.4 Million
Number of share outstanding 147
Earnings per share £40.4 million / 147 million = £0.27
Price earnings ratio £2.05 / £0.27 = 7.59
⊘ This is a preview!⊘
Do you want full access?
Subscribe today to unlock all pages.
Trusted by 1+ million students worldwide
Interpretation- There are various methods using which the valuation of an organization can be
determined. The method of price earnings ratio is a valuation method which helps in analyzing
the ability of an organization to earn from their stocks. From the above calculation, it has been
seen that price of share of Trojan Plc is £2.05 and their earnings per share is computed as £0.27.
By comparing these two values, the price earnings ratio of 7.59 is calculated.
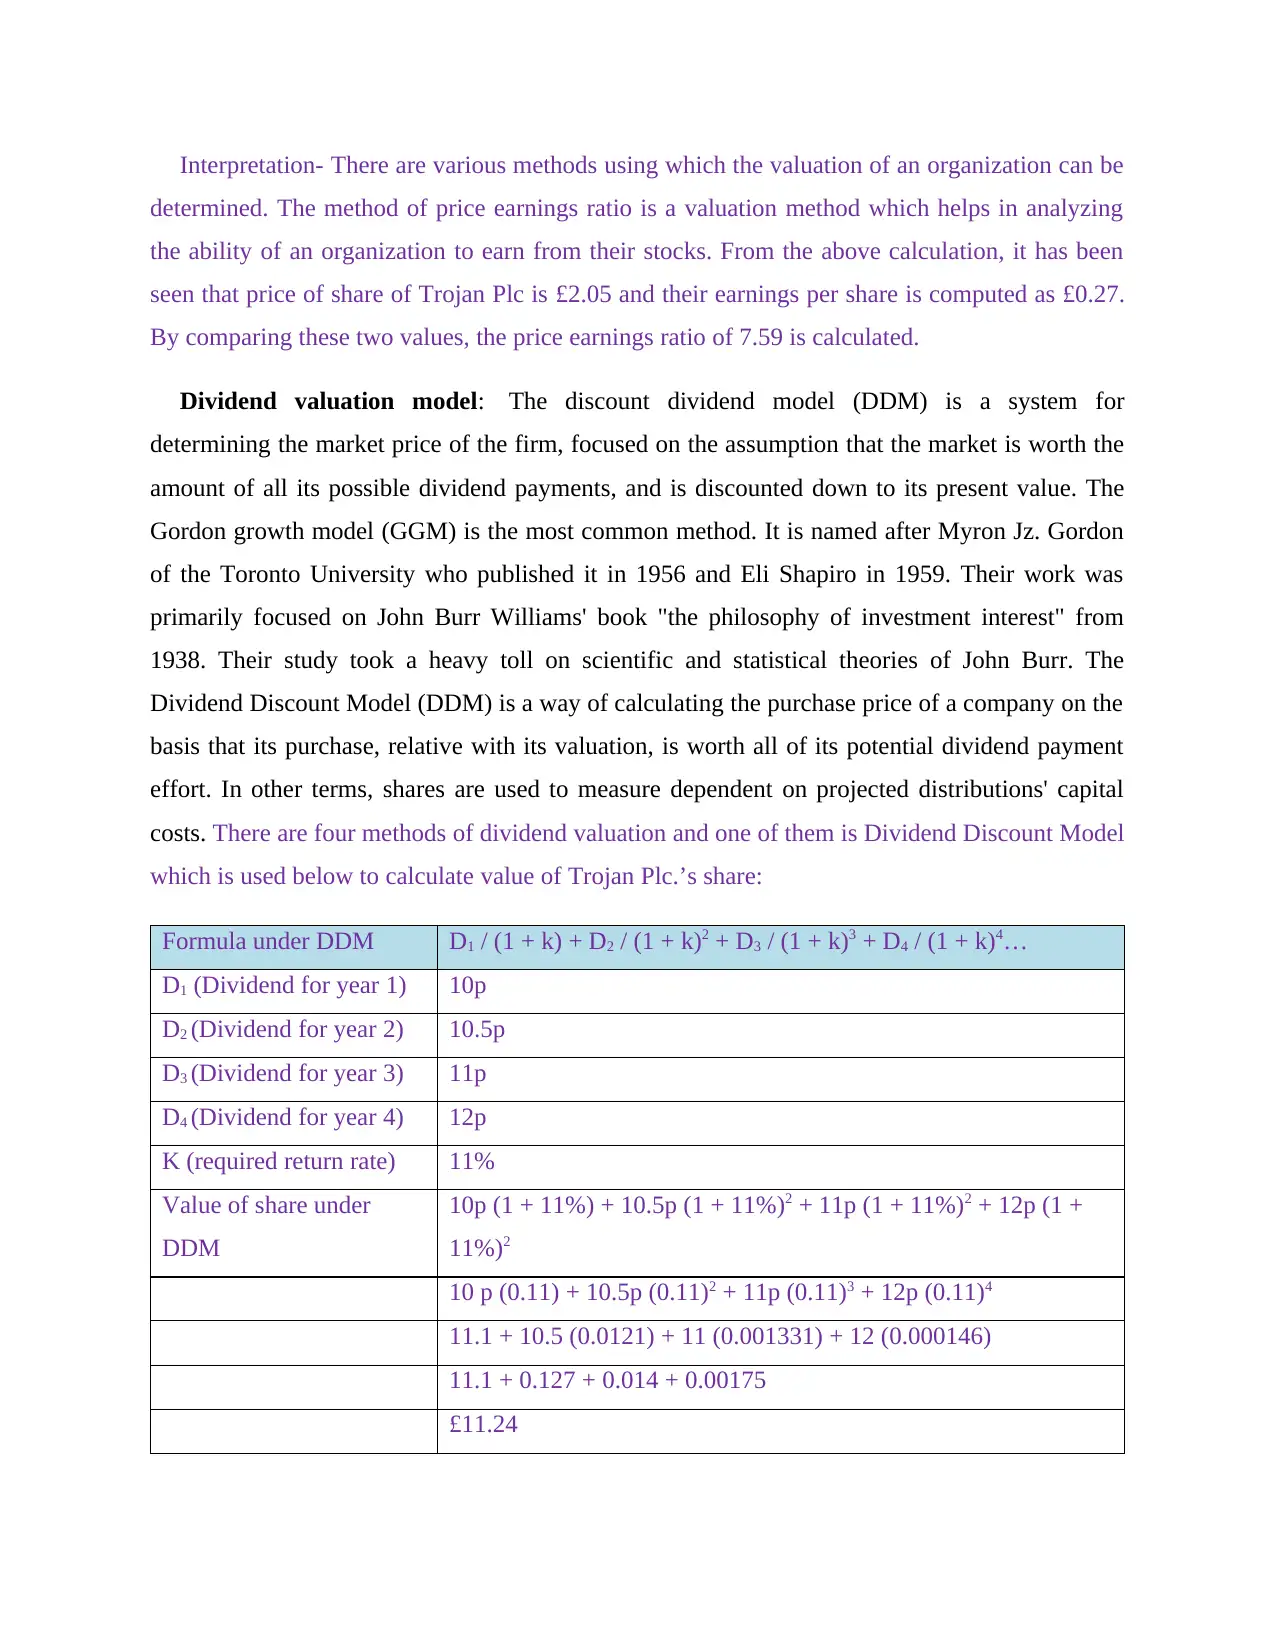
Dividend valuation model: The discount dividend model (DDM) is a system for
determining the market price of the firm, focused on the assumption that the market is worth the
amount of all its possible dividend payments, and is discounted down to its present value. The
Gordon growth model (GGM) is the most common method. It is named after Myron Jz. Gordon
of the Toronto University who published it in 1956 and Eli Shapiro in 1959. Their work was
primarily focused on John Burr Williams' book "the philosophy of investment interest" from
1938. Their study took a heavy toll on scientific and statistical theories of John Burr. The
Dividend Discount Model (DDM) is a way of calculating the purchase price of a company on the
basis that its purchase, relative with its valuation, is worth all of its potential dividend payment
effort. In other terms, shares are used to measure dependent on projected distributions' capital
costs. There are four methods of dividend valuation and one of them is Dividend Discount Model
which is used below to calculate value of Trojan Plc.’s share:
Formula under DDM D1 / (1 + k) + D2 / (1 + k)2 + D3 / (1 + k)3 + D4 / (1 + k)4…
D1 (Dividend for year 1) 10p
D2 (Dividend for year 2) 10.5p
D3 (Dividend for year 3) 11p
D4 (Dividend for year 4) 12p
K (required return rate) 11%
Value of share under
DDM
10p (1 + 11%) + 10.5p (1 + 11%)2 + 11p (1 + 11%)2 + 12p (1 +
11%)2
10 p (0.11) + 10.5p (0.11)2 + 11p (0.11)3 + 12p (0.11)4
11.1 + 10.5 (0.0121) + 11 (0.001331) + 12 (0.000146)
11.1 + 0.127 + 0.014 + 0.00175
£11.24
determined. The method of price earnings ratio is a valuation method which helps in analyzing
the ability of an organization to earn from their stocks. From the above calculation, it has been
seen that price of share of Trojan Plc is £2.05 and their earnings per share is computed as £0.27.
By comparing these two values, the price earnings ratio of 7.59 is calculated.
Dividend valuation model: The discount dividend model (DDM) is a system for
determining the market price of the firm, focused on the assumption that the market is worth the
amount of all its possible dividend payments, and is discounted down to its present value. The
Gordon growth model (GGM) is the most common method. It is named after Myron Jz. Gordon
of the Toronto University who published it in 1956 and Eli Shapiro in 1959. Their work was
primarily focused on John Burr Williams' book "the philosophy of investment interest" from
1938. Their study took a heavy toll on scientific and statistical theories of John Burr. The
Dividend Discount Model (DDM) is a way of calculating the purchase price of a company on the
basis that its purchase, relative with its valuation, is worth all of its potential dividend payment
effort. In other terms, shares are used to measure dependent on projected distributions' capital
costs. There are four methods of dividend valuation and one of them is Dividend Discount Model
which is used below to calculate value of Trojan Plc.’s share:
Formula under DDM D1 / (1 + k) + D2 / (1 + k)2 + D3 / (1 + k)3 + D4 / (1 + k)4…
D1 (Dividend for year 1) 10p
D2 (Dividend for year 2) 10.5p
D3 (Dividend for year 3) 11p
D4 (Dividend for year 4) 12p
K (required return rate) 11%
Value of share under
DDM
10p (1 + 11%) + 10.5p (1 + 11%)2 + 11p (1 + 11%)2 + 12p (1 +
11%)2
10 p (0.11) + 10.5p (0.11)2 + 11p (0.11)3 + 12p (0.11)4
11.1 + 10.5 (0.0121) + 11 (0.001331) + 12 (0.000146)
11.1 + 0.127 + 0.014 + 0.00175
£11.24
Paraphrase This Document
Need a fresh take? Get an instant paraphrase of this document with our AI Paraphraser
Interpretation – The dividend valuation model is the method of calculating the value of stocks
of an organization so that the company’s valuation can be identified. The method which has been
considered under dividend valuation model is dividend discount model; this model is considered
as the most effective model for valuating a company. Using this model, value of Trojan’s share is
calculated as £11.24. This value represents the high stakes of this company. This value is
calculated by using the annual dividend paid by Trojan Plc in past 4 years. The required rate of
this company is used as 11% which is the rate of return on the market.
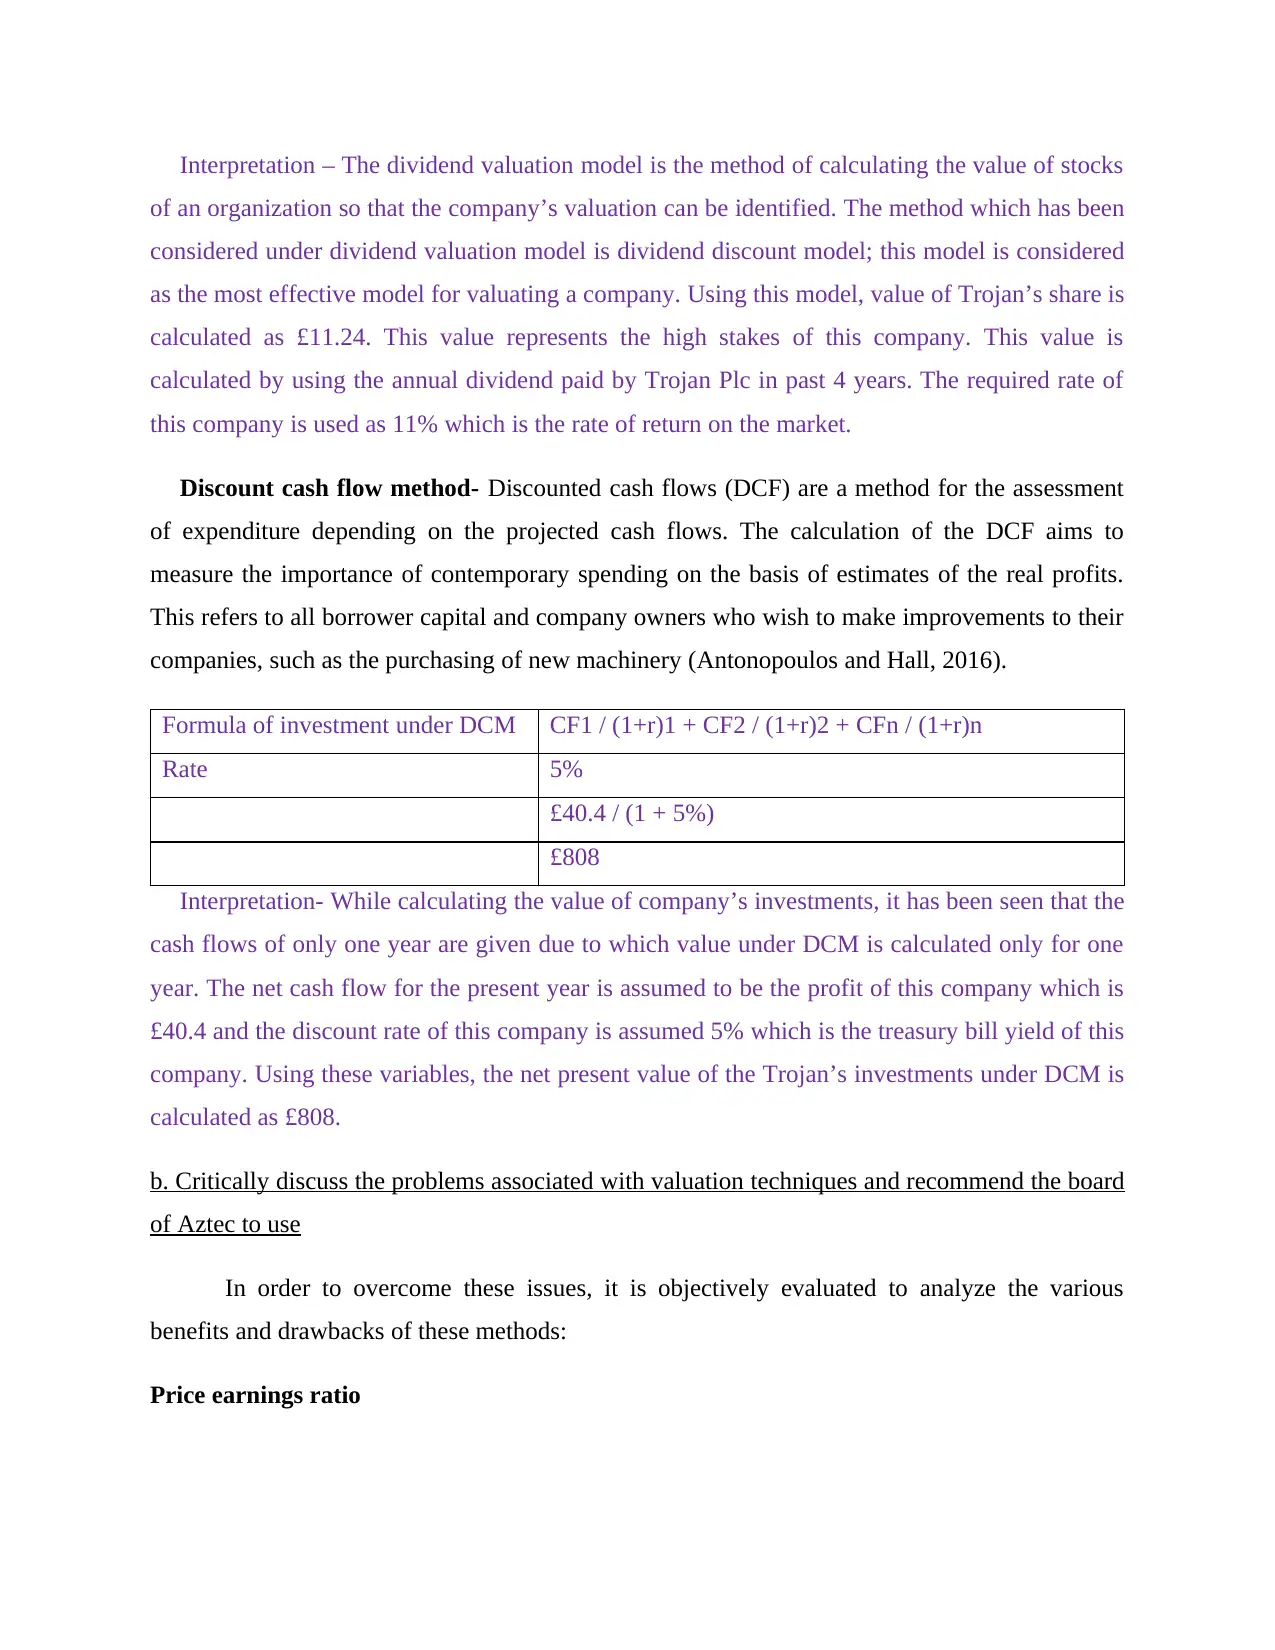
Discount cash flow method- Discounted cash flows (DCF) are a method for the assessment
of expenditure depending on the projected cash flows. The calculation of the DCF aims to
measure the importance of contemporary spending on the basis of estimates of the real profits.
This refers to all borrower capital and company owners who wish to make improvements to their
companies, such as the purchasing of new machinery (Antonopoulos and Hall, 2016).
Formula of investment under DCM CF1 / (1+r)1 + CF2 / (1+r)2 + CFn / (1+r)n
Rate 5%
£40.4 / (1 + 5%)
£808
Interpretation- While calculating the value of company’s investments, it has been seen that the
cash flows of only one year are given due to which value under DCM is calculated only for one
year. The net cash flow for the present year is assumed to be the profit of this company which is
£40.4 and the discount rate of this company is assumed 5% which is the treasury bill yield of this
company. Using these variables, the net present value of the Trojan’s investments under DCM is
calculated as £808.
b. Critically discuss the problems associated with valuation techniques and recommend the board
of Aztec to use
In order to overcome these issues, it is objectively evaluated to analyze the various
benefits and drawbacks of these methods:
Price earnings ratio
of an organization so that the company’s valuation can be identified. The method which has been
considered under dividend valuation model is dividend discount model; this model is considered
as the most effective model for valuating a company. Using this model, value of Trojan’s share is
calculated as £11.24. This value represents the high stakes of this company. This value is
calculated by using the annual dividend paid by Trojan Plc in past 4 years. The required rate of
this company is used as 11% which is the rate of return on the market.
Discount cash flow method- Discounted cash flows (DCF) are a method for the assessment
of expenditure depending on the projected cash flows. The calculation of the DCF aims to
measure the importance of contemporary spending on the basis of estimates of the real profits.
This refers to all borrower capital and company owners who wish to make improvements to their
companies, such as the purchasing of new machinery (Antonopoulos and Hall, 2016).
Formula of investment under DCM CF1 / (1+r)1 + CF2 / (1+r)2 + CFn / (1+r)n
Rate 5%
£40.4 / (1 + 5%)
£808
Interpretation- While calculating the value of company’s investments, it has been seen that the
cash flows of only one year are given due to which value under DCM is calculated only for one
year. The net cash flow for the present year is assumed to be the profit of this company which is
£40.4 and the discount rate of this company is assumed 5% which is the treasury bill yield of this
company. Using these variables, the net present value of the Trojan’s investments under DCM is
calculated as £808.
b. Critically discuss the problems associated with valuation techniques and recommend the board
of Aztec to use
In order to overcome these issues, it is objectively evaluated to analyze the various
benefits and drawbacks of these methods:
Price earnings ratio
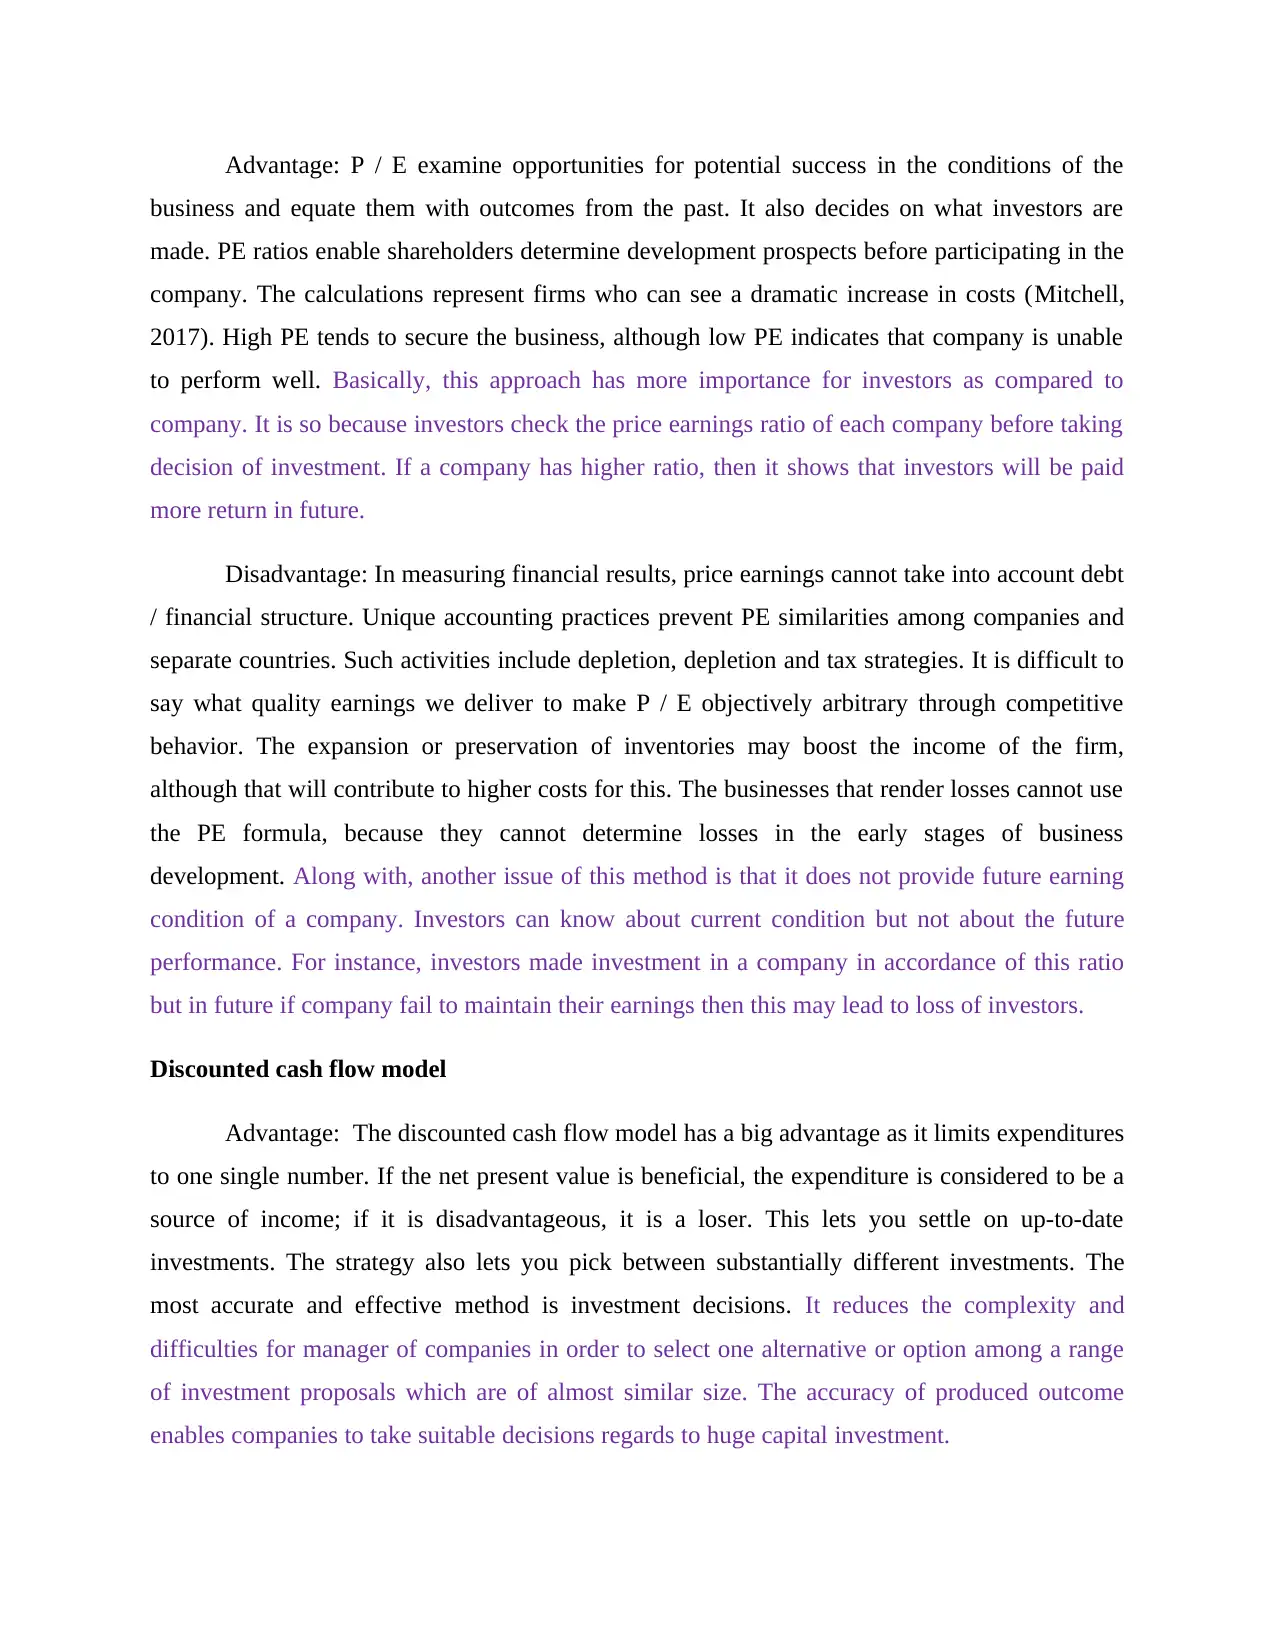
Advantage: P / E examine opportunities for potential success in the conditions of the
business and equate them with outcomes from the past. It also decides on what investors are
made. PE ratios enable shareholders determine development prospects before participating in the
company. The calculations represent firms who can see a dramatic increase in costs (Mitchell,
2017). High PE tends to secure the business, although low PE indicates that company is unable
to perform well. Basically, this approach has more importance for investors as compared to
company. It is so because investors check the price earnings ratio of each company before taking
decision of investment. If a company has higher ratio, then it shows that investors will be paid
more return in future.
Disadvantage: In measuring financial results, price earnings cannot take into account debt
/ financial structure. Unique accounting practices prevent PE similarities among companies and
separate countries. Such activities include depletion, depletion and tax strategies. It is difficult to
say what quality earnings we deliver to make P / E objectively arbitrary through competitive
behavior. The expansion or preservation of inventories may boost the income of the firm,
although that will contribute to higher costs for this. The businesses that render losses cannot use
the PE formula, because they cannot determine losses in the early stages of business
development. Along with, another issue of this method is that it does not provide future earning
condition of a company. Investors can know about current condition but not about the future
performance. For instance, investors made investment in a company in accordance of this ratio
but in future if company fail to maintain their earnings then this may lead to loss of investors.
Discounted cash flow model
Advantage: The discounted cash flow model has a big advantage as it limits expenditures
to one single number. If the net present value is beneficial, the expenditure is considered to be a
source of income; if it is disadvantageous, it is a loser. This lets you settle on up-to-date
investments. The strategy also lets you pick between substantially different investments. The
most accurate and effective method is investment decisions. It reduces the complexity and
difficulties for manager of companies in order to select one alternative or option among a range
of investment proposals which are of almost similar size. The accuracy of produced outcome
enables companies to take suitable decisions regards to huge capital investment.
⊘ This is a preview!⊘
Do you want full access?
Subscribe today to unlock all pages.
Trusted by 1+ million students worldwide
Disadvantage: The main constraint of DCF is the need to create a variety of assumptions.
Throughout the immediate future, cash flows will rely on different variables such as global
activity, market conditions, unpredictable problems and more. The calculation of hypothetical
future cash flows may contribute to decisions involving an expenditure that does not later kill
profits. In addition, this method is completely based on discounted cash flows which are
computed on the basis of cost of capital. The rate of this cost of capital is assumed that makes
results doubtful and companies may face lose in future if they make invest accordingly.
Dividend valuation model:
Advantage: This method does not permit the dividend appraisal model. For the stocks
calculated, the dividend growth rate must be greater than the return rate; otherwise the
calculation does not function. This implies they use this formula to estimate the future returns,
based on what the actual payout looks to be. Using this assessment model, it is better to pick a
way of spending as the expenditure may be maintained (Loke, 2017). In addition, this method is
too easier to use because once the concept of calculation has been understood by experts then
this may become easy for them to implement it on any stock that offers dividend. Due to which
investors can get higher control on their investment alternatives because they can check actual
value in trading price of share.
Disadvantage-Compared with massive capital reserves, it is smaller businesses that have
been performing well over long stretches. Most small businesses are forced to offer a dividend
that means that the worth of this investment formula cannot be determined. The dividend paying
inventories should be included. When shareholders concentrated only on this particular pattern,
they might skip many chances to generate value for their assets. A variety of factors may affect
the price of the stock over time. Customer retention, client awareness and even immaterial
properties will all increase the profitability of the product. Without a constant and proven
dividend development, certain non-dividend variables that influence the valuation of the stock.
Along with this method can be implemented only on those stocks which offers dividend. This
cannot be applied on all types of stocks. Due to which it cannot be applied in the small
companies because they are unable to pay dividend on the stock.
Paraphrase This Document
Need a fresh take? Get an instant paraphrase of this document with our AI Paraphraser
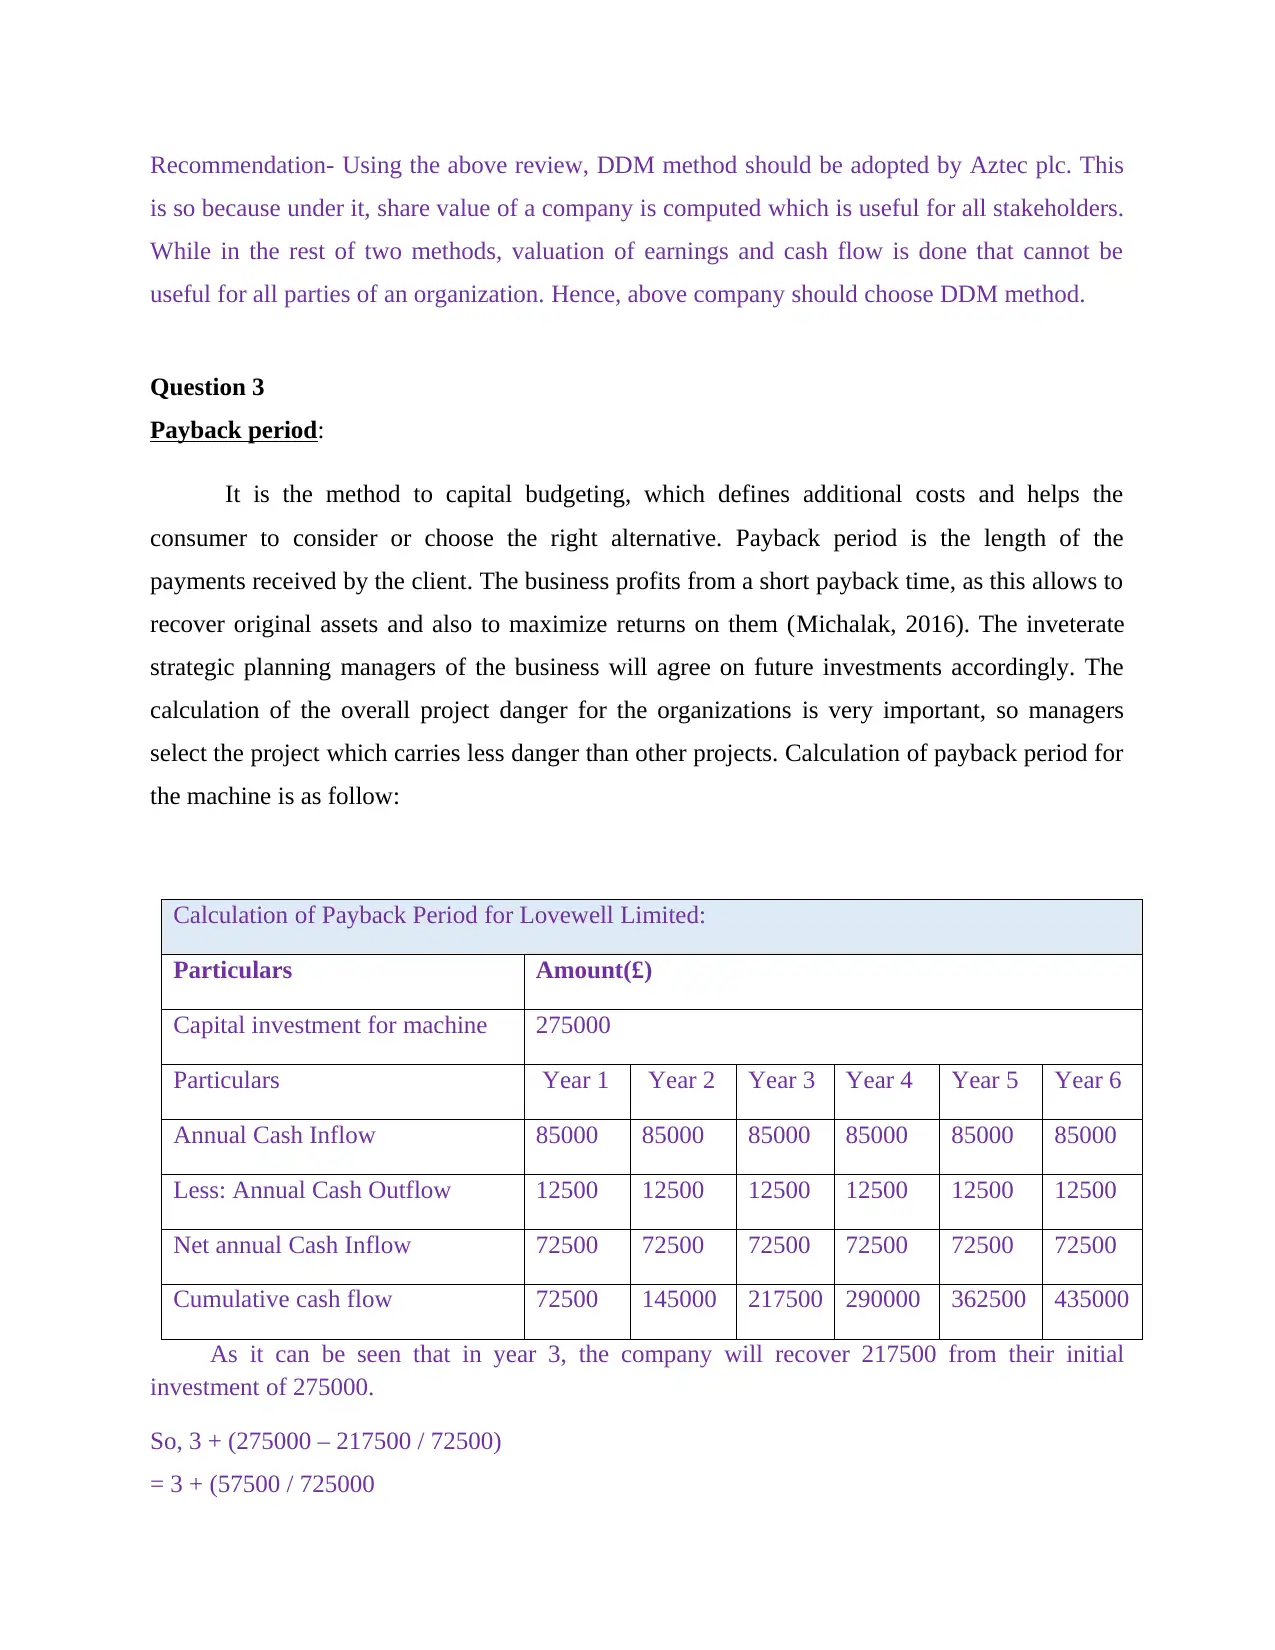
Recommendation- Using the above review, DDM method should be adopted by Aztec plc. This
is so because under it, share value of a company is computed which is useful for all stakeholders.
While in the rest of two methods, valuation of earnings and cash flow is done that cannot be
useful for all parties of an organization. Hence, above company should choose DDM method.
Question 3
Payback period:
It is the method to capital budgeting, which defines additional costs and helps the
consumer to consider or choose the right alternative. Payback period is the length of the
payments received by the client. The business profits from a short payback time, as this allows to
recover original assets and also to maximize returns on them (Michalak, 2016). The inveterate
strategic planning managers of the business will agree on future investments accordingly. The
calculation of the overall project danger for the organizations is very important, so managers
select the project which carries less danger than other projects. Calculation of payback period for
the machine is as follow:
Calculation of Payback Period for Lovewell Limited:
Particulars Amount(£)
Capital investment for machine 275000
Particulars Year 1 Year 2 Year 3 Year 4 Year 5 Year 6
Annual Cash Inflow 85000 85000 85000 85000 85000 85000
Less: Annual Cash Outflow 12500 12500 12500 12500 12500 12500
Net annual Cash Inflow 72500 72500 72500 72500 72500 72500
Cumulative cash flow 72500 145000 217500 290000 362500 435000
As it can be seen that in year 3, the company will recover 217500 from their initial
investment of 275000.
So, 3 + (275000 – 217500 / 72500)
= 3 + (57500 / 725000
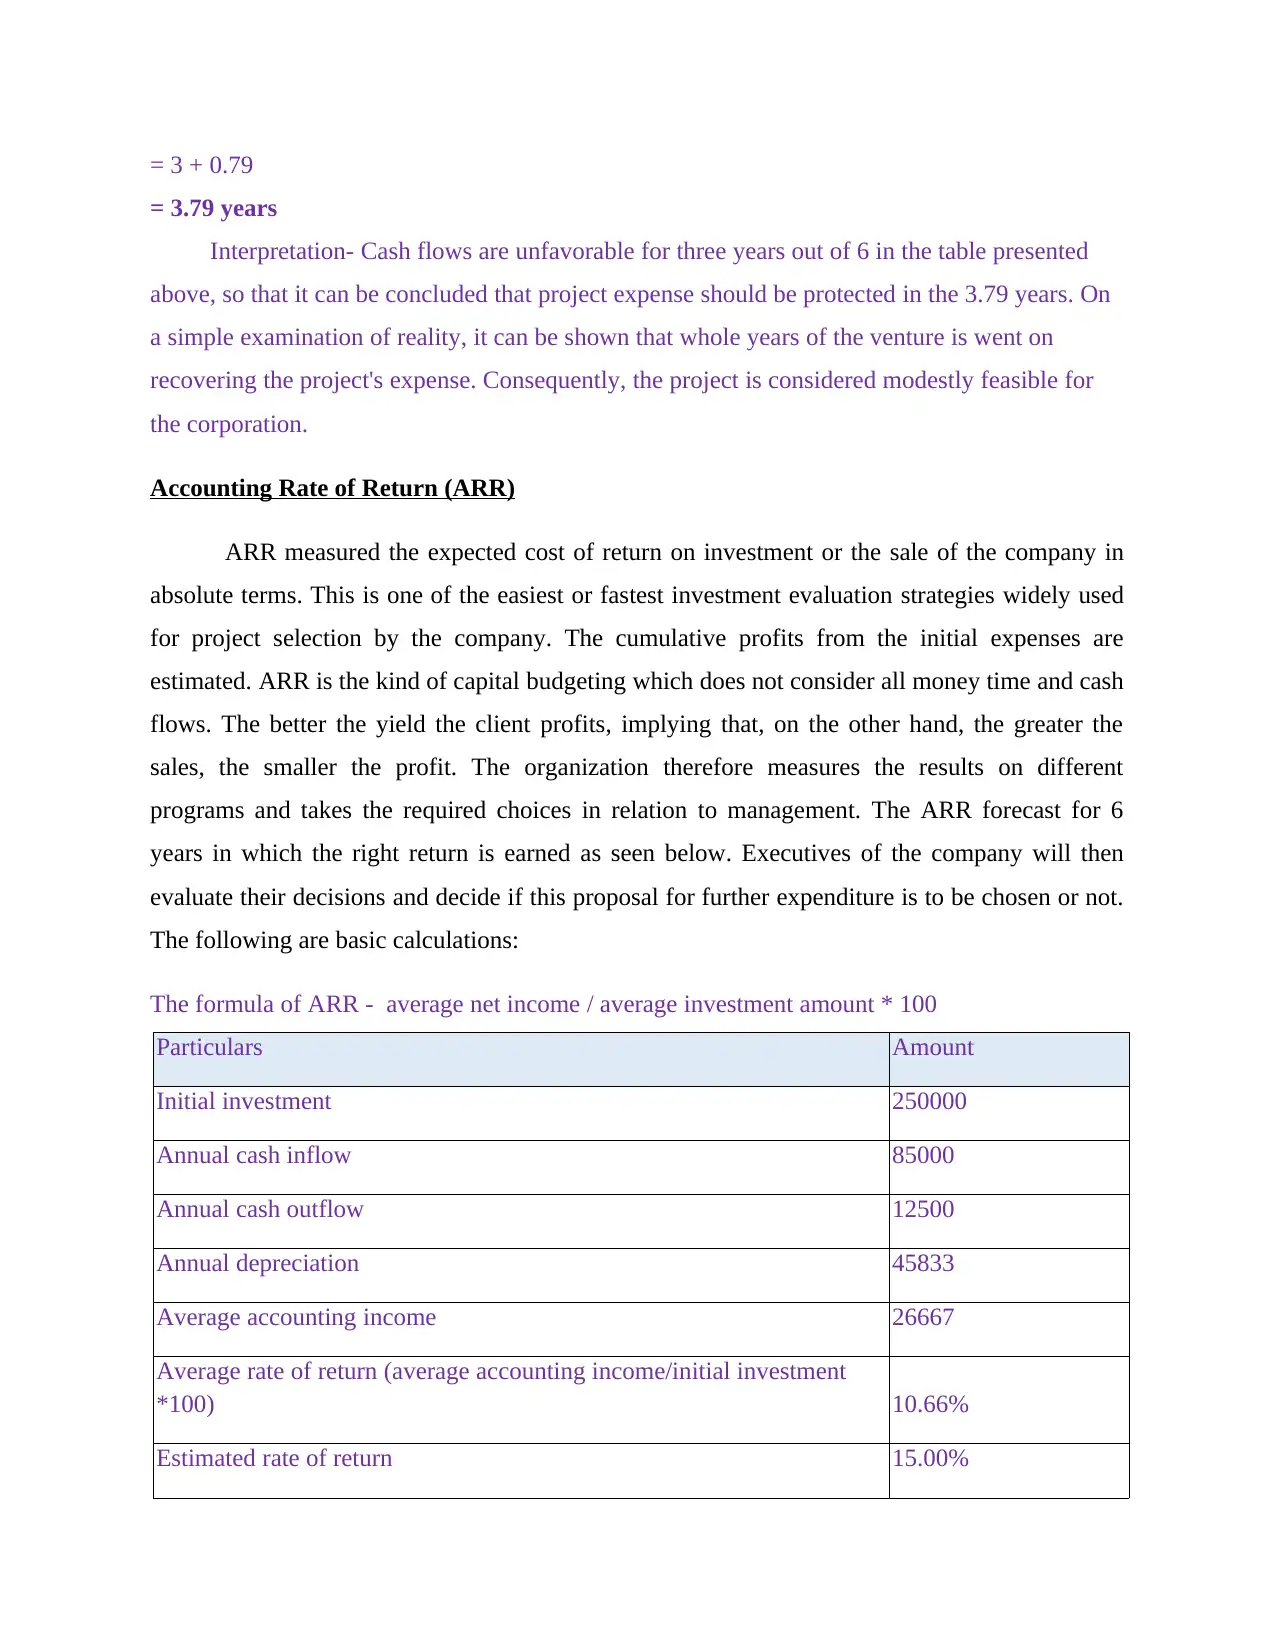
= 3 + 0.79
= 3.79 years
Interpretation- Cash flows are unfavorable for three years out of 6 in the table presented
above, so that it can be concluded that project expense should be protected in the 3.79 years. On
a simple examination of reality, it can be shown that whole years of the venture is went on
recovering the project's expense. Consequently, the project is considered modestly feasible for
the corporation.
Accounting Rate of Return (ARR)
ARR measured the expected cost of return on investment or the sale of the company in
absolute terms. This is one of the easiest or fastest investment evaluation strategies widely used
for project selection by the company. The cumulative profits from the initial expenses are
estimated. ARR is the kind of capital budgeting which does not consider all money time and cash
flows. The better the yield the client profits, implying that, on the other hand, the greater the
sales, the smaller the profit. The organization therefore measures the results on different
programs and takes the required choices in relation to management. The ARR forecast for 6
years in which the right return is earned as seen below. Executives of the company will then
evaluate their decisions and decide if this proposal for further expenditure is to be chosen or not.
The following are basic calculations:
The formula of ARR - average net income / average investment amount * 100
Particulars Amount
Initial investment 250000
Annual cash inflow 85000
Annual cash outflow 12500
Annual depreciation 45833
Average accounting income 26667
Average rate of return (average accounting income/initial investment
*100) 10.66%
Estimated rate of return 15.00%
⊘ This is a preview!⊘
Do you want full access?
Subscribe today to unlock all pages.
Trusted by 1+ million students worldwide
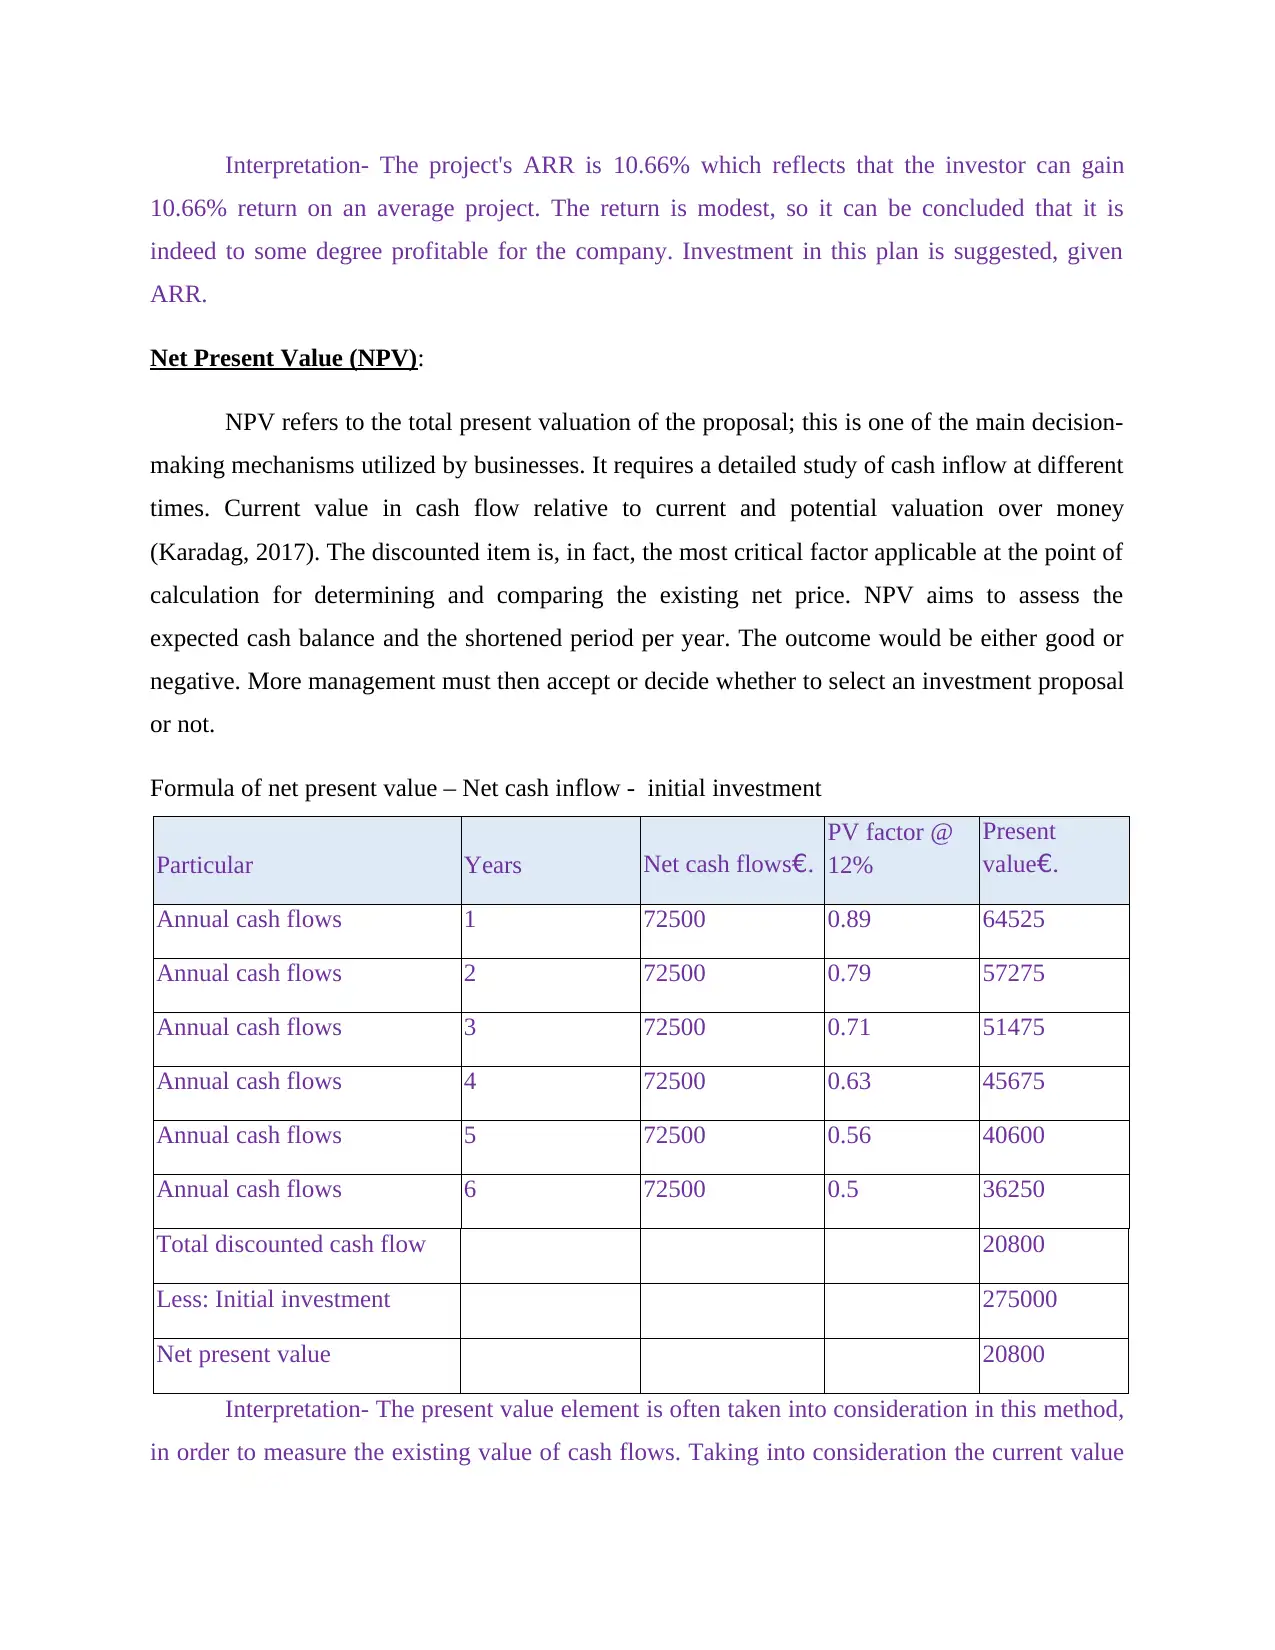
Interpretation- The project's ARR is 10.66% which reflects that the investor can gain
10.66% return on an average project. The return is modest, so it can be concluded that it is
indeed to some degree profitable for the company. Investment in this plan is suggested, given
ARR.
Net Present Value (NPV):
NPV refers to the total present valuation of the proposal; this is one of the main decision-
making mechanisms utilized by businesses. It requires a detailed study of cash inflow at different
times. Current value in cash flow relative to current and potential valuation over money
(Karadag, 2017). The discounted item is, in fact, the most critical factor applicable at the point of
calculation for determining and comparing the existing net price. NPV aims to assess the
expected cash balance and the shortened period per year. The outcome would be either good or
negative. More management must then accept or decide whether to select an investment proposal
or not.
Formula of net present value – Net cash inflow - initial investment
Particular Years Net cash flows€.
PV factor @
12%
Present
value€.
Annual cash flows 1 72500 0.89 64525
Annual cash flows 2 72500 0.79 57275
Annual cash flows 3 72500 0.71 51475
Annual cash flows 4 72500 0.63 45675
Annual cash flows 5 72500 0.56 40600
Annual cash flows 6 72500 0.5 36250
Total discounted cash flow 20800
Less: Initial investment 275000
Net present value 20800
Interpretation- The present value element is often taken into consideration in this method,
in order to measure the existing value of cash flows. Taking into consideration the current value
Paraphrase This Document
Need a fresh take? Get an instant paraphrase of this document with our AI Paraphraser
is 12 per cent (R1). We will note NPV is £20800. Plan is advised to be feasible for the business
and spending in this plan must not be made.
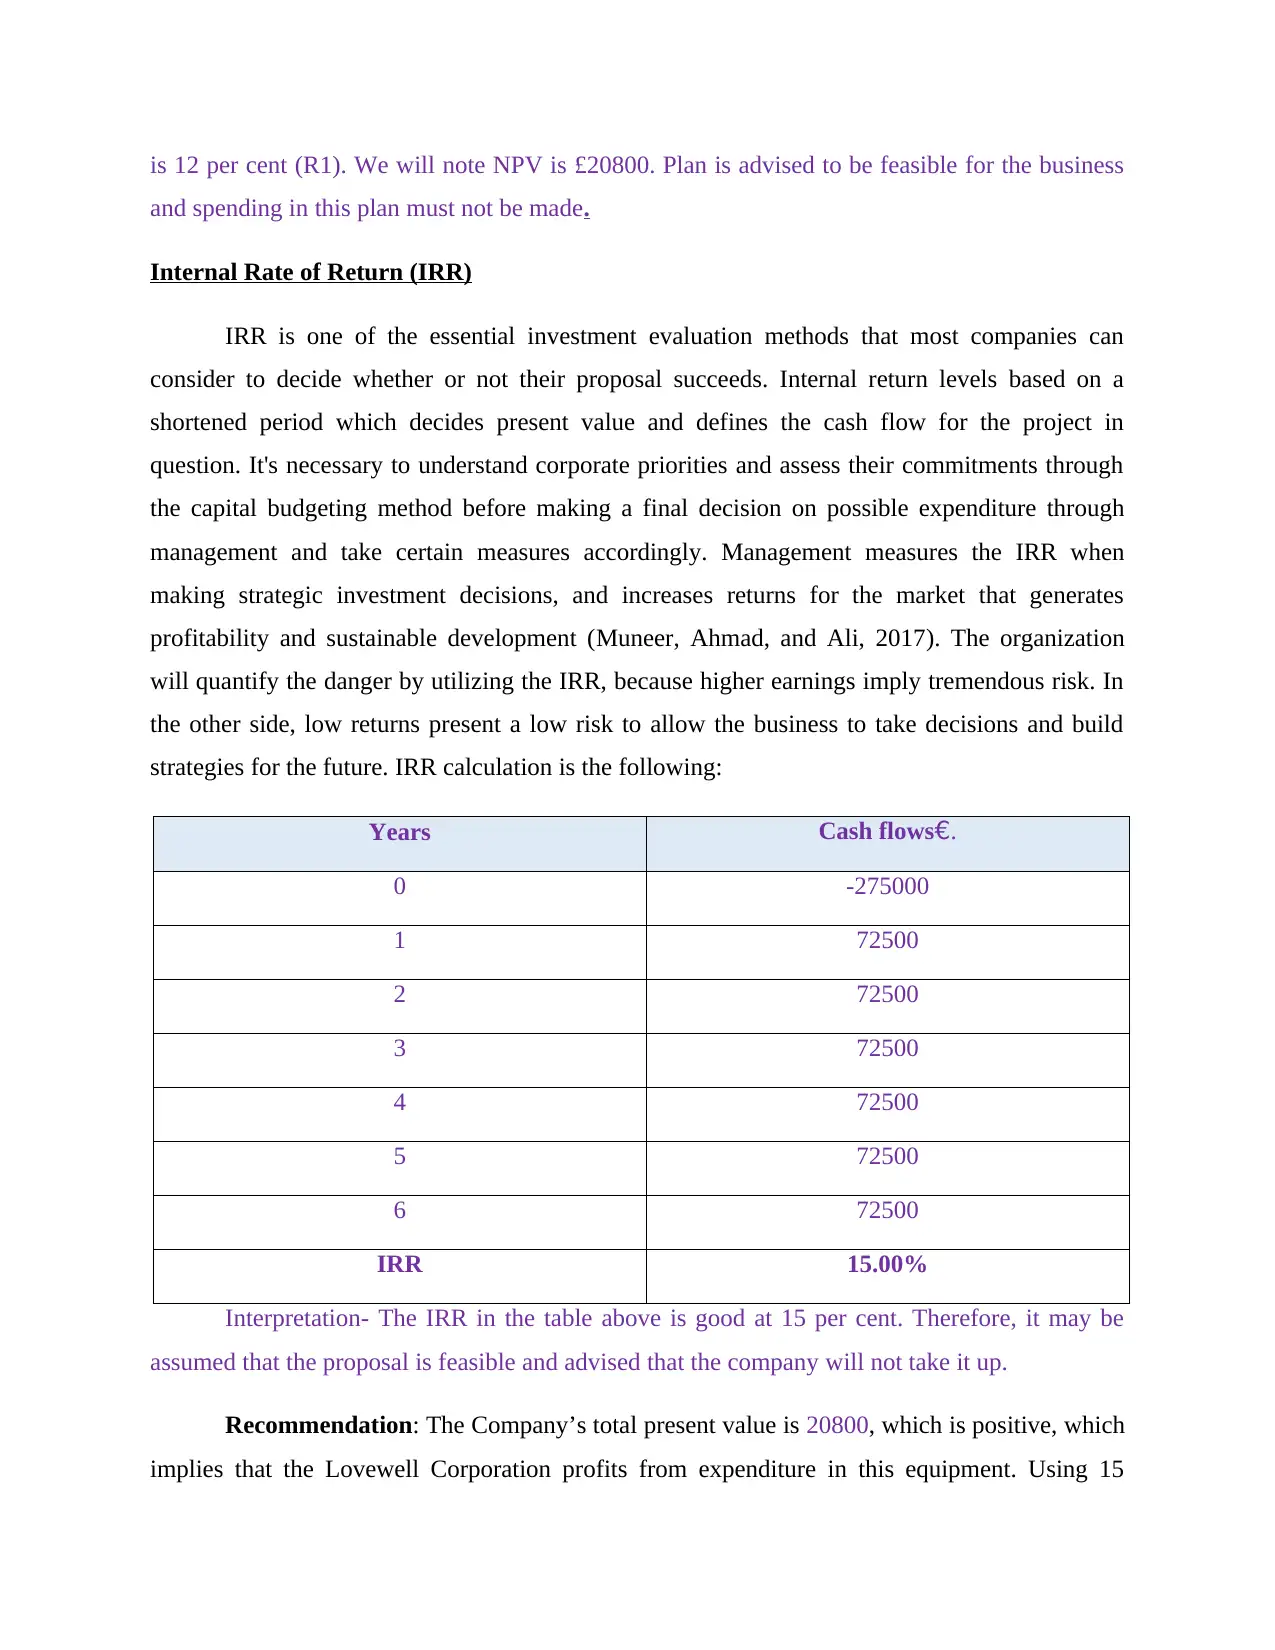
Internal Rate of Return (IRR)
IRR is one of the essential investment evaluation methods that most companies can
consider to decide whether or not their proposal succeeds. Internal return levels based on a
shortened period which decides present value and defines the cash flow for the project in
question. It's necessary to understand corporate priorities and assess their commitments through
the capital budgeting method before making a final decision on possible expenditure through
management and take certain measures accordingly. Management measures the IRR when
making strategic investment decisions, and increases returns for the market that generates
profitability and sustainable development (Muneer, Ahmad, and Ali, 2017). The organization
will quantify the danger by utilizing the IRR, because higher earnings imply tremendous risk. In
the other side, low returns present a low risk to allow the business to take decisions and build
strategies for the future. IRR calculation is the following:
Years Cash flows€.
0 -275000
1 72500
2 72500
3 72500
4 72500
5 72500
6 72500
IRR 15.00%
Interpretation- The IRR in the table above is good at 15 per cent. Therefore, it may be
assumed that the proposal is feasible and advised that the company will not take it up.
Recommendation: The Company’s total present value is 20800, which is positive, which
implies that the Lovewell Corporation profits from expenditure in this equipment. Using 15
and spending in this plan must not be made.
Internal Rate of Return (IRR)
IRR is one of the essential investment evaluation methods that most companies can
consider to decide whether or not their proposal succeeds. Internal return levels based on a
shortened period which decides present value and defines the cash flow for the project in
question. It's necessary to understand corporate priorities and assess their commitments through
the capital budgeting method before making a final decision on possible expenditure through
management and take certain measures accordingly. Management measures the IRR when
making strategic investment decisions, and increases returns for the market that generates
profitability and sustainable development (Muneer, Ahmad, and Ali, 2017). The organization
will quantify the danger by utilizing the IRR, because higher earnings imply tremendous risk. In
the other side, low returns present a low risk to allow the business to take decisions and build
strategies for the future. IRR calculation is the following:
Years Cash flows€.
0 -275000
1 72500
2 72500
3 72500
4 72500
5 72500
6 72500
IRR 15.00%
Interpretation- The IRR in the table above is good at 15 per cent. Therefore, it may be
assumed that the proposal is feasible and advised that the company will not take it up.
Recommendation: The Company’s total present value is 20800, which is positive, which
implies that the Lovewell Corporation profits from expenditure in this equipment. Using 15
percent of the IRR of this project is adequate to invest in new equipment or increase market
efficiency and profitability. With the assistance of above performance, managers are able to
determine with this project and is helpful for the company to invest in the latest development
machinery.
Critically evaluate the benefits or limitations of different investment appraisal techniques:
Payback period:
Benefits: One of the key benefits of the payback time approach is that the estimation
mechanism is overstated in nature and, for this purpose, any person in the organization who may
not have professional expertise may still apply this approach to the data for project assessment.
One of the key advantages of this approach is that it represents the time over which the volume
of expenditure that be compensated (Darwanis, Saputra and Kartini, 2016). In accordance of its
principles this can be said that users can quickly figure out how long or year the client begins
making income in the market. Therefore, it may be assumed that the payback period approach is
of immense importance to the management as it does not involve analytical expertise to interpret
the outcomes and calculate the feasibility of the project. That is one of the payback time
method's biggest strengths.
Drawbacks- Some of the main disadvantages to the payback cycle is that the idea of the
current interest is not utilized in this strategy. The definition of current value is complicated and
thus one that does not have experience cannot take advantage of this method. The payback
duration represents the feasibility of the project when evaluating all the years, but this does not
imply the project 's profitability when order to understand the current time frame. The value of
money or capital begins to adjust gradually regardless of a shift in the state's financial situation.
During the upcoming time frame, if there is strong uncertainty of the sector, then another volume
of cash flows will be expected to further propel. Because of this project which seems lucrative in
the current timeframe that appear unaffordable in the future timeframe. Hence, for this purpose,
most managers tend to use the approach which takes discounted cash flows into consideration.
No use of the theory of current value is one of the most significant demerit points of the payback
method.
Accounting rate of return:
⊘ This is a preview!⊘
Do you want full access?
Subscribe today to unlock all pages.
Trusted by 1+ million students worldwide
1 out of 16
Related Documents


Your All-in-One AI-Powered Toolkit for Academic Success.
+13062052269
info@desklib.com
Available 24*7 on WhatsApp / Email
![[object Object]](/_next/static/media/star-bottom.7253800d.svg)
Unlock your academic potential
Copyright © 2020–2026 A2Z Services. All Rights Reserved. Developed and managed by ZUCOL.