Financial Management: Valuation and Investment Appraisal Assignment
VerifiedAdded on 2023/01/06
|14
|4117
|100
Homework Assignment
AI Summary
This assignment solution addresses key concepts in financial management, focusing on valuation techniques and investment appraisal. It begins by explaining and calculating the Price Earnings Ratio (PER), Dividend Valuation Method (DVM), and Discounted Cash Flow (DCF) methods, providing formulas and examples to illustrate each. The solution then critically discusses the limitations and problems associated with each valuation technique, providing a balanced perspective on their practical applications. Furthermore, the assignment explores investment appraisal techniques, including payback period, accounting rate of return (ARR), net present value (NPV), and internal rate of return (IRR), with detailed calculations and interpretations to assess the viability of a potential investment in new machinery for Lovewell Ltd. The solution concludes with a critical evaluation of these techniques, comparing their strengths and weaknesses to provide a comprehensive understanding of financial decision-making.

Financial Management
Paraphrase This Document
Need a fresh take? Get an instant paraphrase of this document with our AI Paraphraser

QUESTION 2
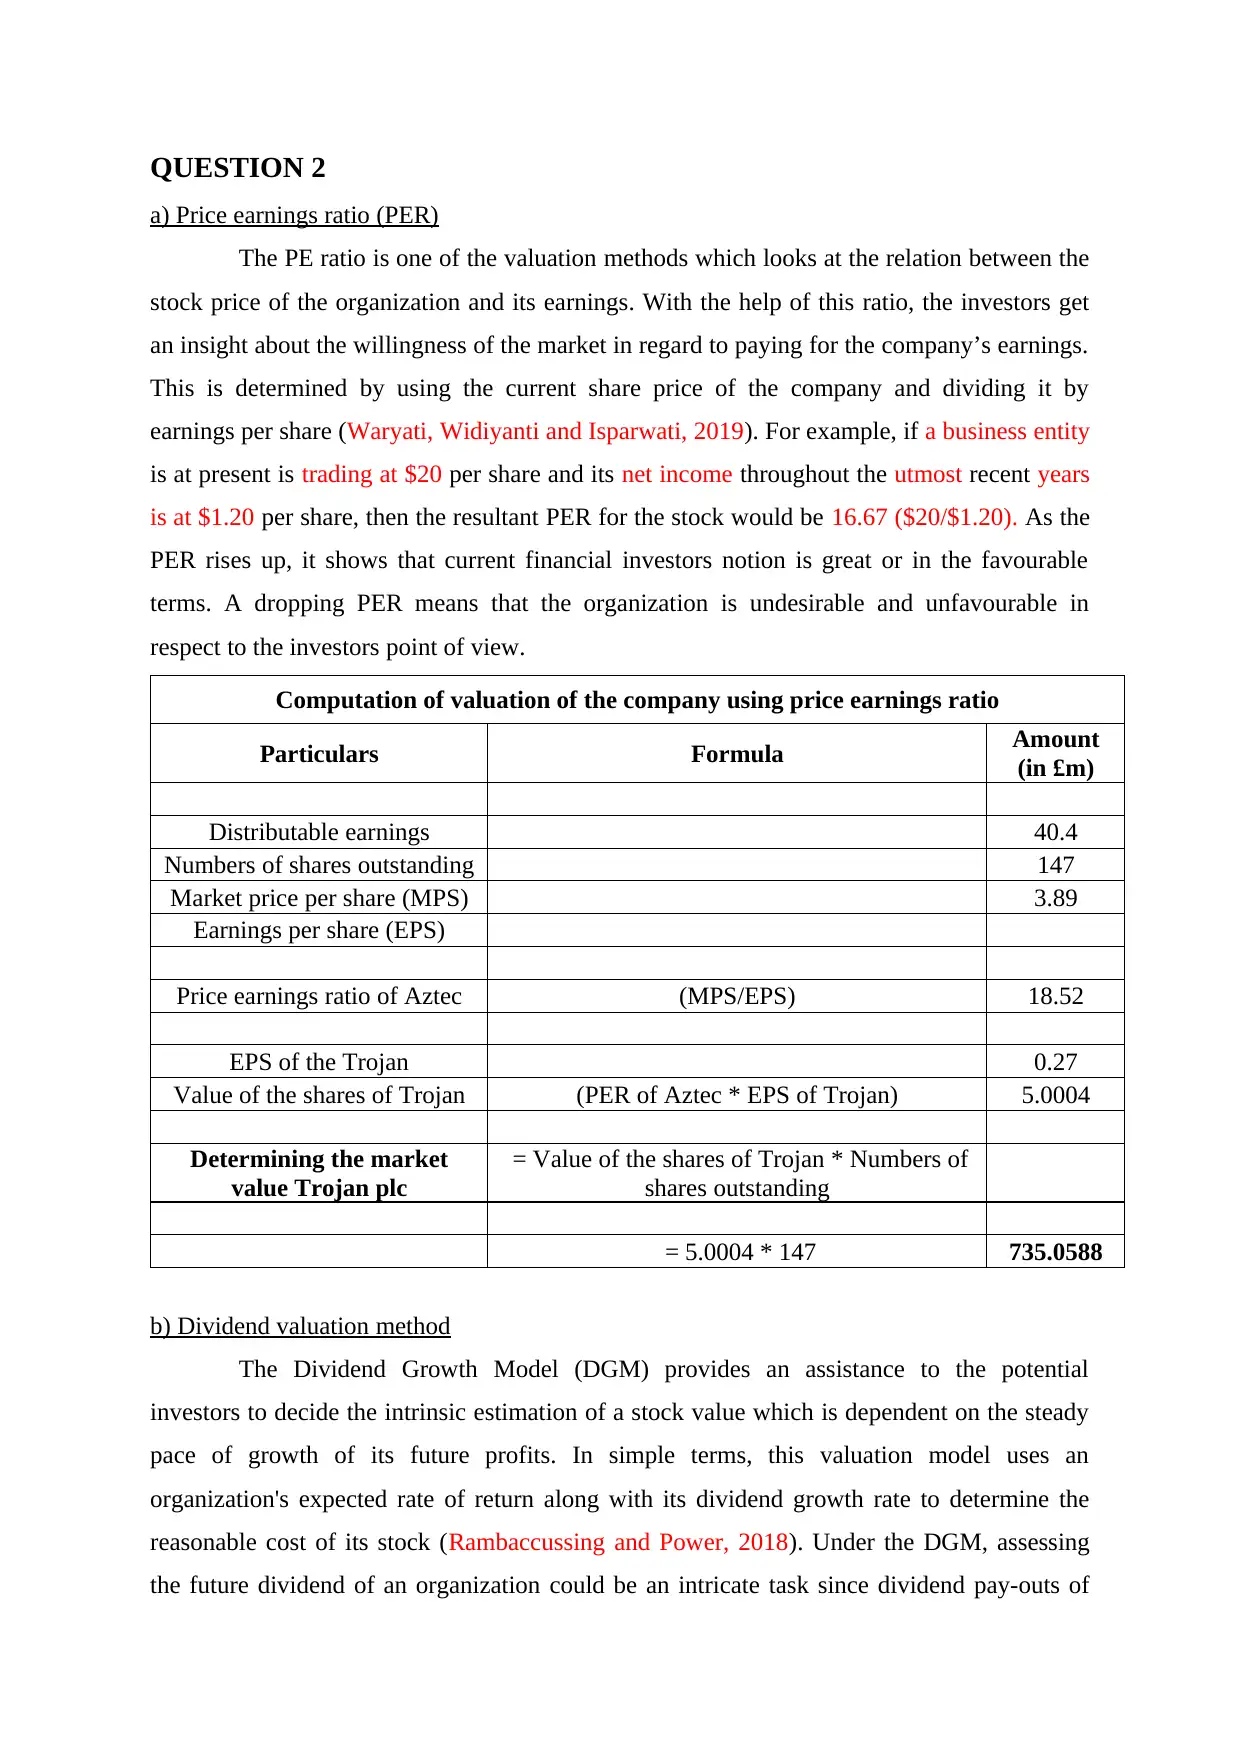
a) Price earnings ratio (PER)
The PE ratio is one of the valuation methods which looks at the relation between the
stock price of the organization and its earnings. With the help of this ratio, the investors get
an insight about the willingness of the market in regard to paying for the company’s earnings.
This is determined by using the current share price of the company and dividing it by
earnings per share (Waryati, Widiyanti and Isparwati, 2019). For example, if a business entity
is at present is trading at $20 per share and its net income throughout the utmost recent years
is at $1.20 per share, then the resultant PER for the stock would be 16.67 ($20/$1.20). As the
PER rises up, it shows that current financial investors notion is great or in the favourable
terms. A dropping PER means that the organization is undesirable and unfavourable in
respect to the investors point of view.
Computation of valuation of the company using price earnings ratio
Particulars Formula Amount
(in £m)
Distributable earnings 40.4
Numbers of shares outstanding 147
Market price per share (MPS) 3.89
Earnings per share (EPS)
Price earnings ratio of Aztec (MPS/EPS) 18.52
EPS of the Trojan 0.27
Value of the shares of Trojan (PER of Aztec * EPS of Trojan) 5.0004
Determining the market
value Trojan plc
= Value of the shares of Trojan * Numbers of
shares outstanding
= 5.0004 * 147 735.0588
b) Dividend valuation method
The Dividend Growth Model (DGM) provides an assistance to the potential
investors to decide the intrinsic estimation of a stock value which is dependent on the steady
pace of growth of its future profits. In simple terms, this valuation model uses an
organization's expected rate of return along with its dividend growth rate to determine the
reasonable cost of its stock (Rambaccussing and Power, 2018). Under the DGM, assessing
the future dividend of an organization could be an intricate task since dividend pay-outs of
⊘ This is a preview!⊘
Do you want full access?
Subscribe today to unlock all pages.
Trusted by 1+ million students worldwide
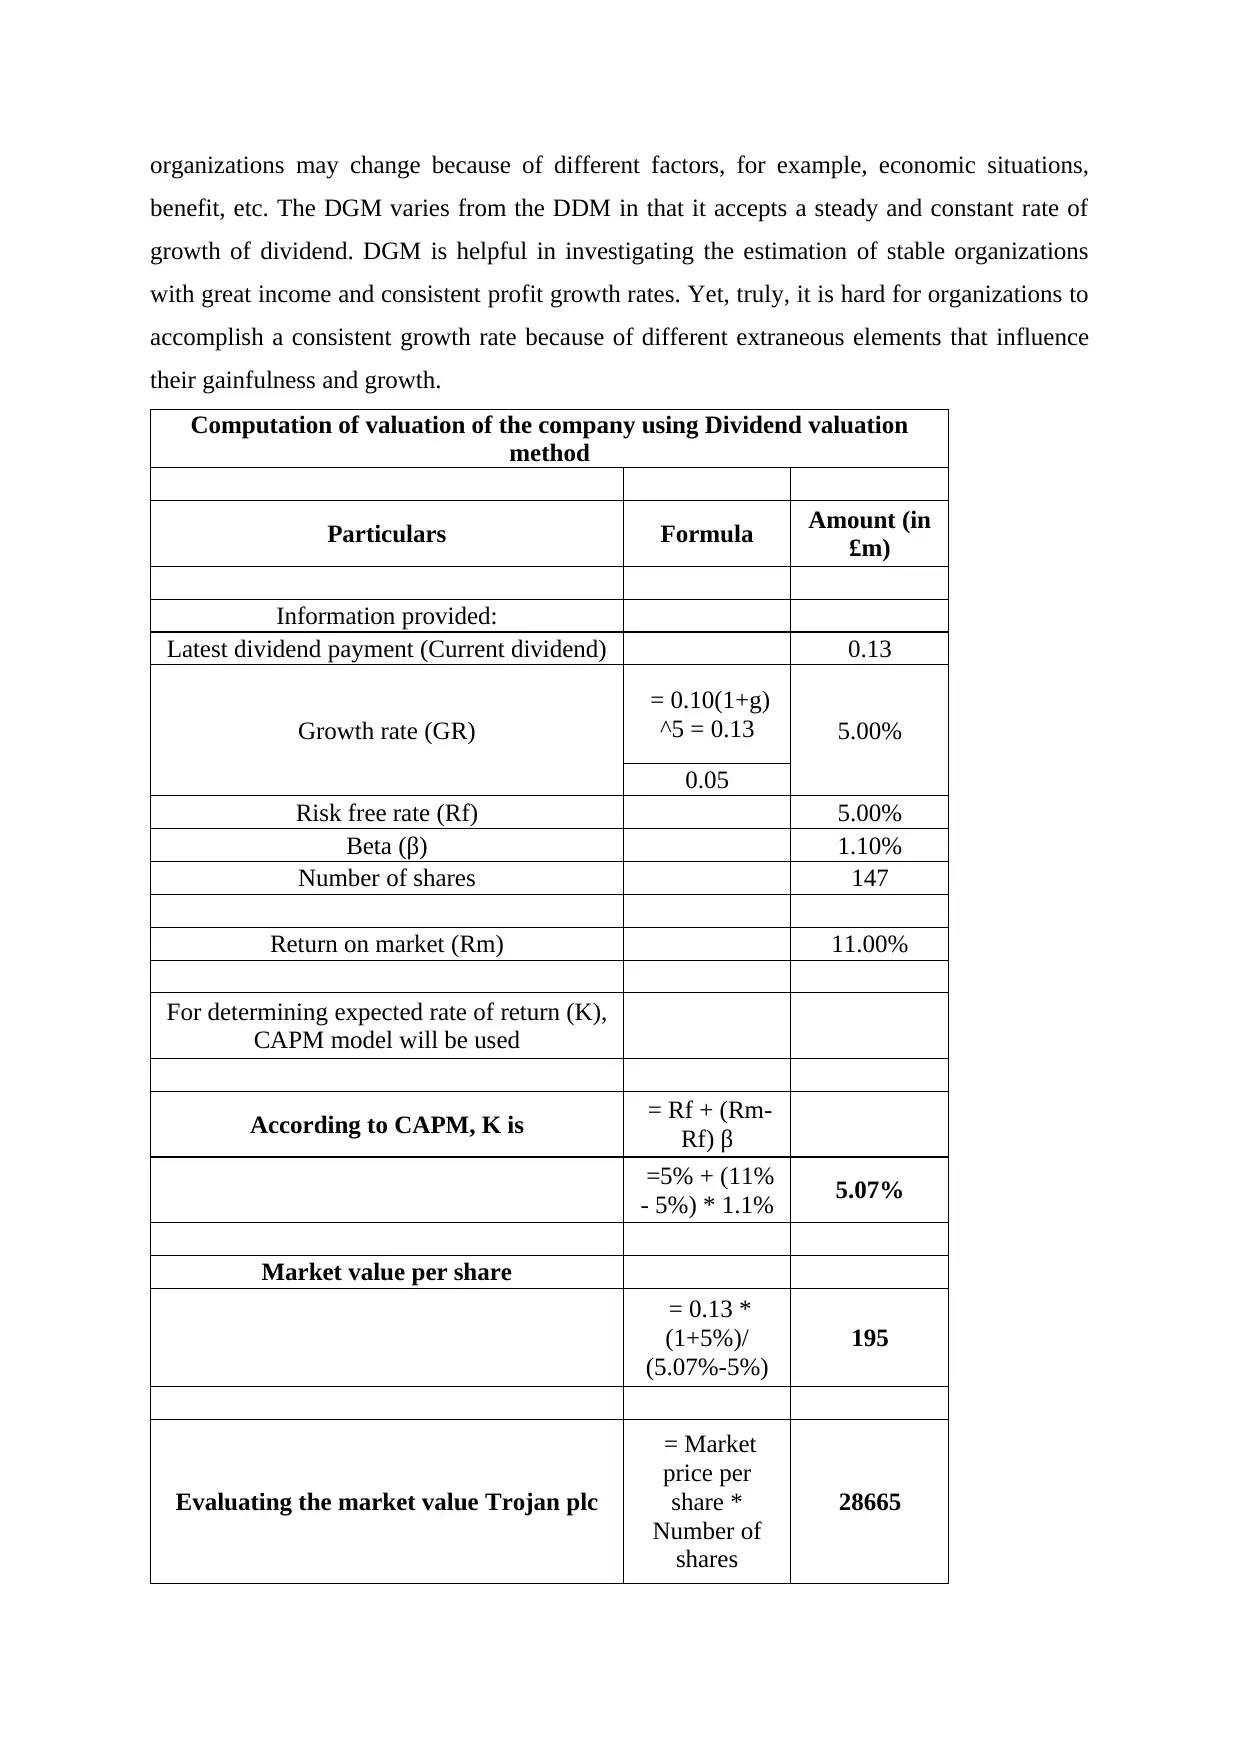
organizations may change because of different factors, for example, economic situations,
benefit, etc. The DGM varies from the DDM in that it accepts a steady and constant rate of
growth of dividend. DGM is helpful in investigating the estimation of stable organizations
with great income and consistent profit growth rates. Yet, truly, it is hard for organizations to
accomplish a consistent growth rate because of different extraneous elements that influence
their gainfulness and growth.
Computation of valuation of the company using Dividend valuation
method
Particulars Formula Amount (in
£m)
Information provided:
Latest dividend payment (Current dividend) 0.13
Growth rate (GR)
= 0.10(1+g)
^5 = 0.13 5.00%
0.05
Risk free rate (Rf) 5.00%
Beta (β) 1.10%
Number of shares 147
Return on market (Rm) 11.00%
For determining expected rate of return (K),
CAPM model will be used
According to CAPM, K is = Rf + (Rm-
Rf) β
=5% + (11%
- 5%) * 1.1% 5.07%
Market value per share
= 0.13 *
(1+5%)/
(5.07%-5%)
195
Evaluating the market value Trojan plc
= Market
price per
share *
Number of
shares
28665
Paraphrase This Document
Need a fresh take? Get an instant paraphrase of this document with our AI Paraphraser
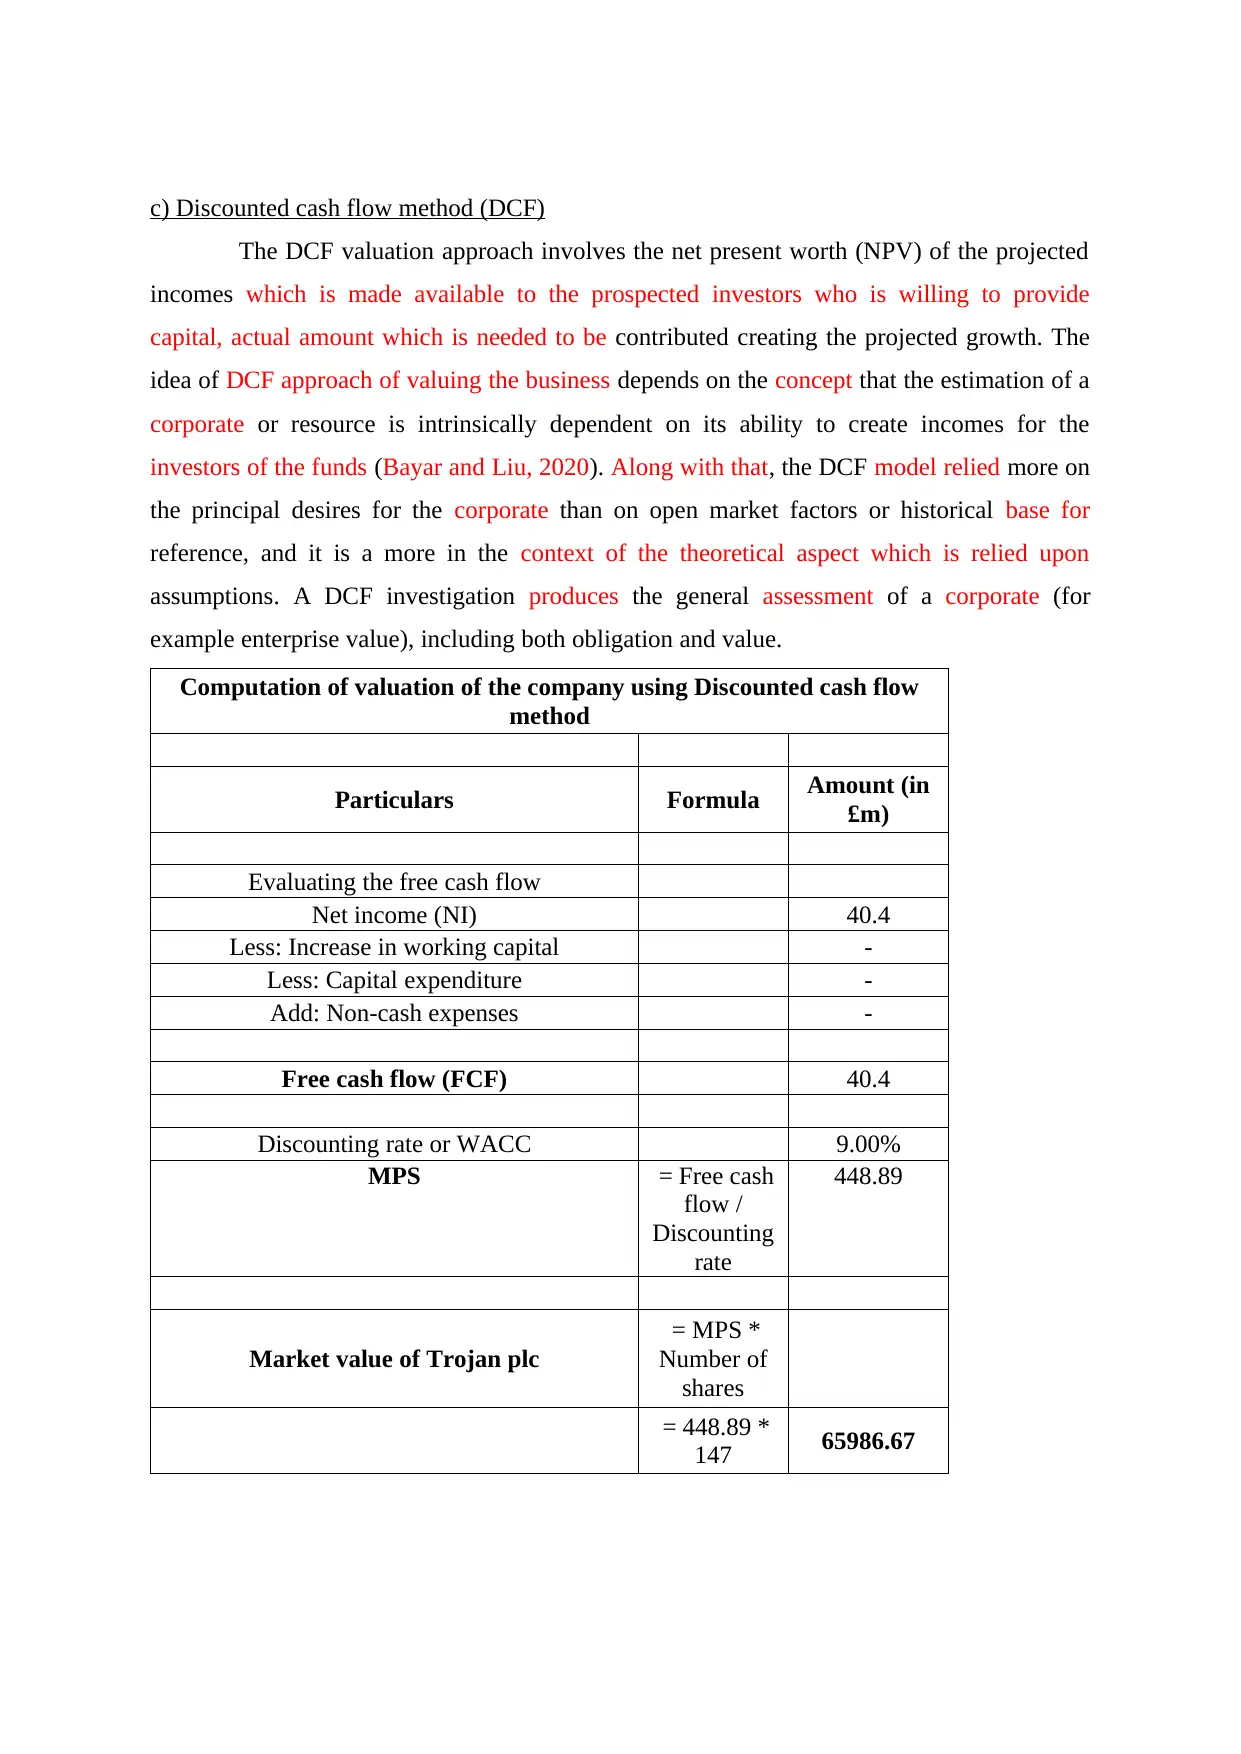
c) Discounted cash flow method (DCF)
The DCF valuation approach involves the net present worth (NPV) of the projected
incomes which is made available to the prospected investors who is willing to provide
capital, actual amount which is needed to be contributed creating the projected growth. The
idea of DCF approach of valuing the business depends on the concept that the estimation of a
corporate or resource is intrinsically dependent on its ability to create incomes for the
investors of the funds (Bayar and Liu, 2020). Along with that, the DCF model relied more on
the principal desires for the corporate than on open market factors or historical base for
reference, and it is a more in the context of the theoretical aspect which is relied upon
assumptions. A DCF investigation produces the general assessment of a corporate (for
example enterprise value), including both obligation and value.
Computation of valuation of the company using Discounted cash flow
method
Particulars Formula Amount (in
£m)
Evaluating the free cash flow
Net income (NI) 40.4
Less: Increase in working capital -
Less: Capital expenditure -
Add: Non-cash expenses -
Free cash flow (FCF) 40.4
Discounting rate or WACC 9.00%
MPS = Free cash
flow /
Discounting
rate
448.89
Market value of Trojan plc
= MPS *
Number of
shares
= 448.89 *
147 65986.67
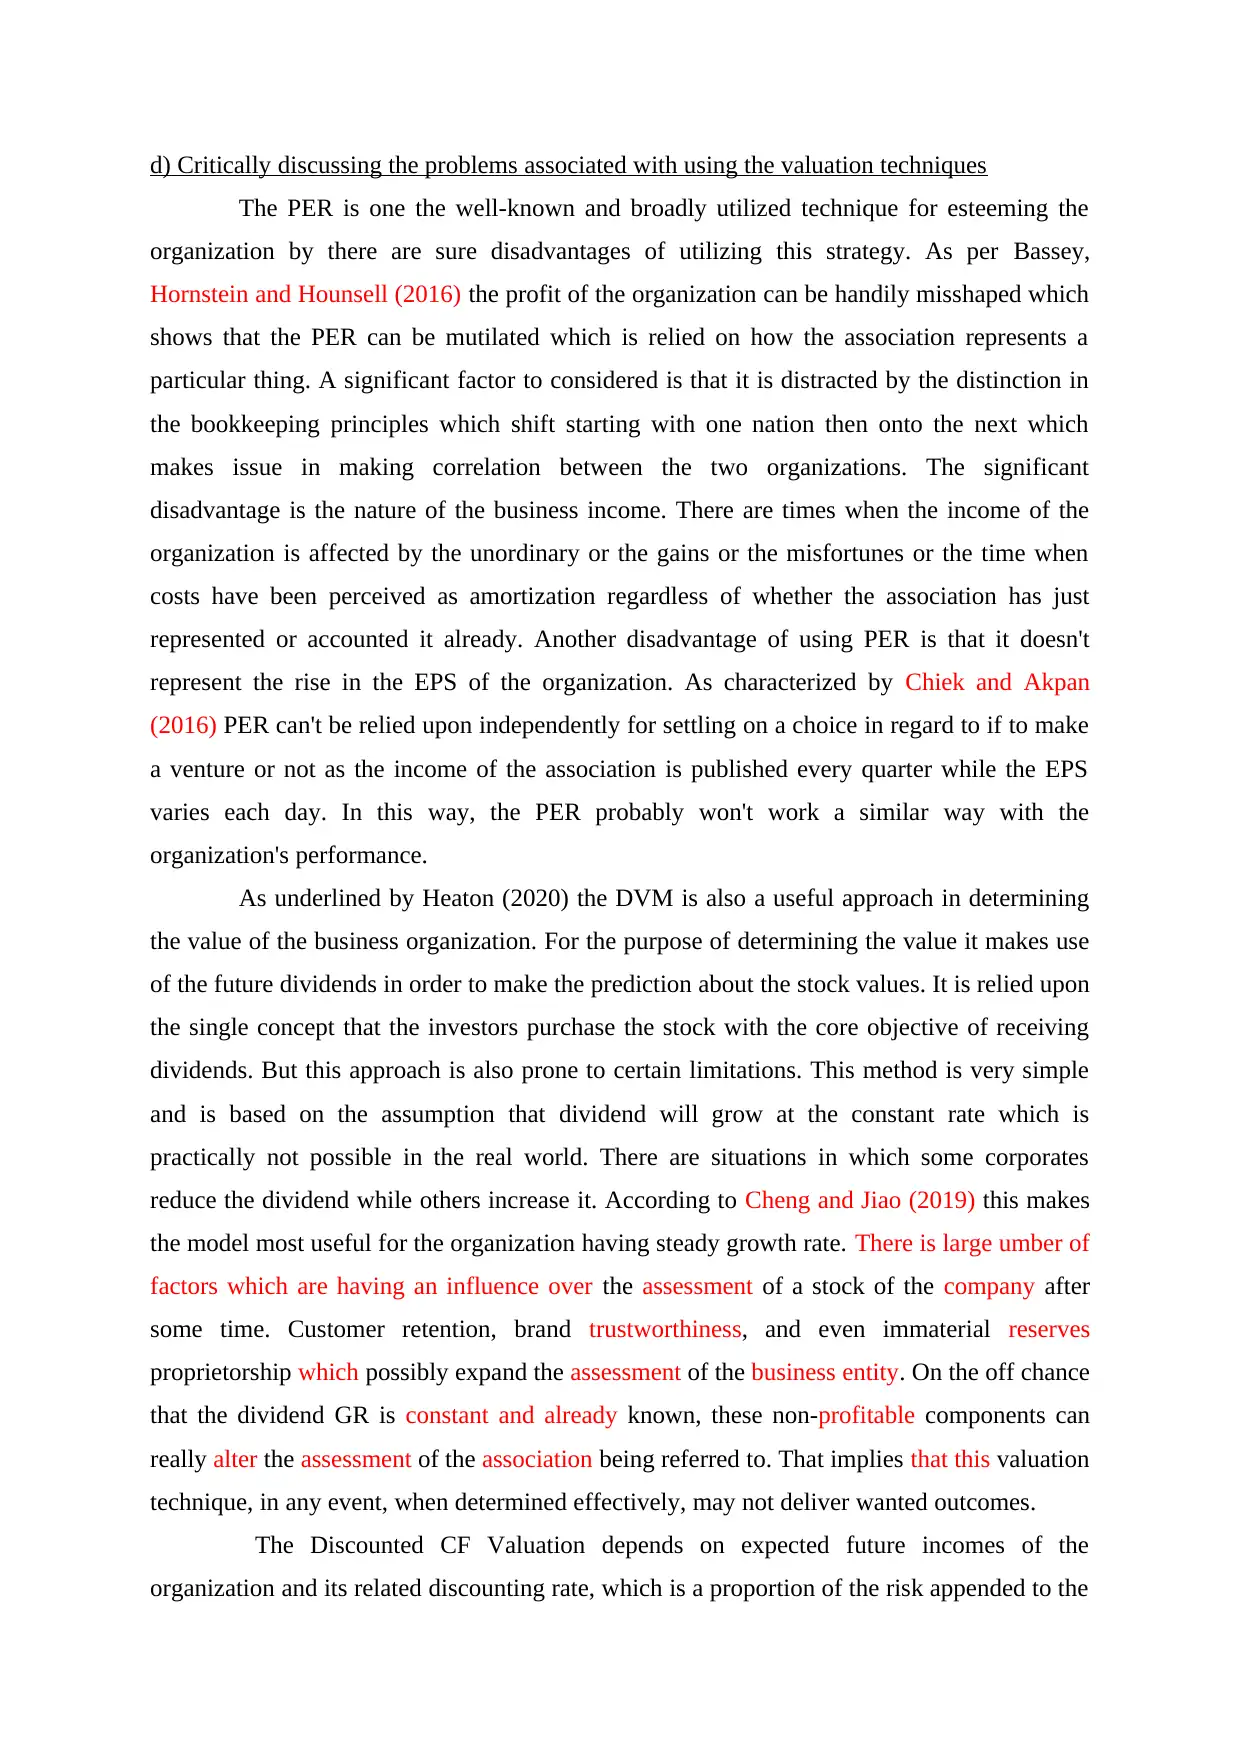
d) Critically discussing the problems associated with using the valuation techniques
The PER is one the well-known and broadly utilized technique for esteeming the
organization by there are sure disadvantages of utilizing this strategy. As per Bassey,
Hornstein and Hounsell (2016) the profit of the organization can be handily misshaped which
shows that the PER can be mutilated which is relied on how the association represents a
particular thing. A significant factor to considered is that it is distracted by the distinction in
the bookkeeping principles which shift starting with one nation then onto the next which
makes issue in making correlation between the two organizations. The significant
disadvantage is the nature of the business income. There are times when the income of the
organization is affected by the unordinary or the gains or the misfortunes or the time when
costs have been perceived as amortization regardless of whether the association has just
represented or accounted it already. Another disadvantage of using PER is that it doesn't
represent the rise in the EPS of the organization. As characterized by Chiek and Akpan
(2016) PER can't be relied upon independently for settling on a choice in regard to if to make
a venture or not as the income of the association is published every quarter while the EPS
varies each day. In this way, the PER probably won't work a similar way with the
organization's performance.
As underlined by Heaton (2020) the DVM is also a useful approach in determining
the value of the business organization. For the purpose of determining the value it makes use
of the future dividends in order to make the prediction about the stock values. It is relied upon
the single concept that the investors purchase the stock with the core objective of receiving
dividends. But this approach is also prone to certain limitations. This method is very simple
and is based on the assumption that dividend will grow at the constant rate which is
practically not possible in the real world. There are situations in which some corporates
reduce the dividend while others increase it. According to Cheng and Jiao (2019) this makes
the model most useful for the organization having steady growth rate. There is large umber of
factors which are having an influence over the assessment of a stock of the company after
some time. Customer retention, brand trustworthiness, and even immaterial reserves
proprietorship which possibly expand the assessment of the business entity. On the off chance
that the dividend GR is constant and already known, these non-profitable components can
really alter the assessment of the association being referred to. That implies that this valuation
technique, in any event, when determined effectively, may not deliver wanted outcomes.
The Discounted CF Valuation depends on expected future incomes of the
organization and its related discounting rate, which is a proportion of the risk appended to the
⊘ This is a preview!⊘
Do you want full access?
Subscribe today to unlock all pages.
Trusted by 1+ million students worldwide
business in general way and specifically to the organization. As defined by Neaxie and
Hendrawan (2017) DCF Valuation, this methodology is simplest to use for resources,
organizations, and so forth whose sources of income are at present certain and can be
estimated with some dependability, and where an intermediary for risk that can be utilized to
get the discounting rates is accessible. DCF Valuation is incredibly sensitive to the
presumptions identified with the perpetual GR and the discounting rate. Any minor mistake
in the assumption, and the DCF Valuation will vary uncontrollably and the reasonable worth
of the organization will not be accurate.
As defined by Komikov (2020) the DCF model works good and well when there is a
serious extent of certainty in regard to the future incomes. However, in the event that the
administration's activities require perceivability, it gets complex to forecast the sales,
employed costs and capital investment with conviction. While estimating incomes for the
upcoming years is not an easy task. In that capacity, DCF strategy is increases the chances of
blunder if not appropriately represented these information sources. One of the major
drawbacks of this valuation method is that the terminal values involves nearly 65% to 75% of
the total value and in case there is a minor error in making these assumptions in respect to the
terminal values then it would have a significant influence over the organization’s valuation.
In light of the basic examination, it very well may be stated that the PER is the most
reasonable technique for valuation reason which is on the grounds that despite the fact that it
is inclined to certain downsides yet it is not a risky attempt for valuing the business and this
methodology is generally utilized by the partners or the organizations. Alongside it, it is
exceptionally simple to figure out and comprehend.
QUESTION 3
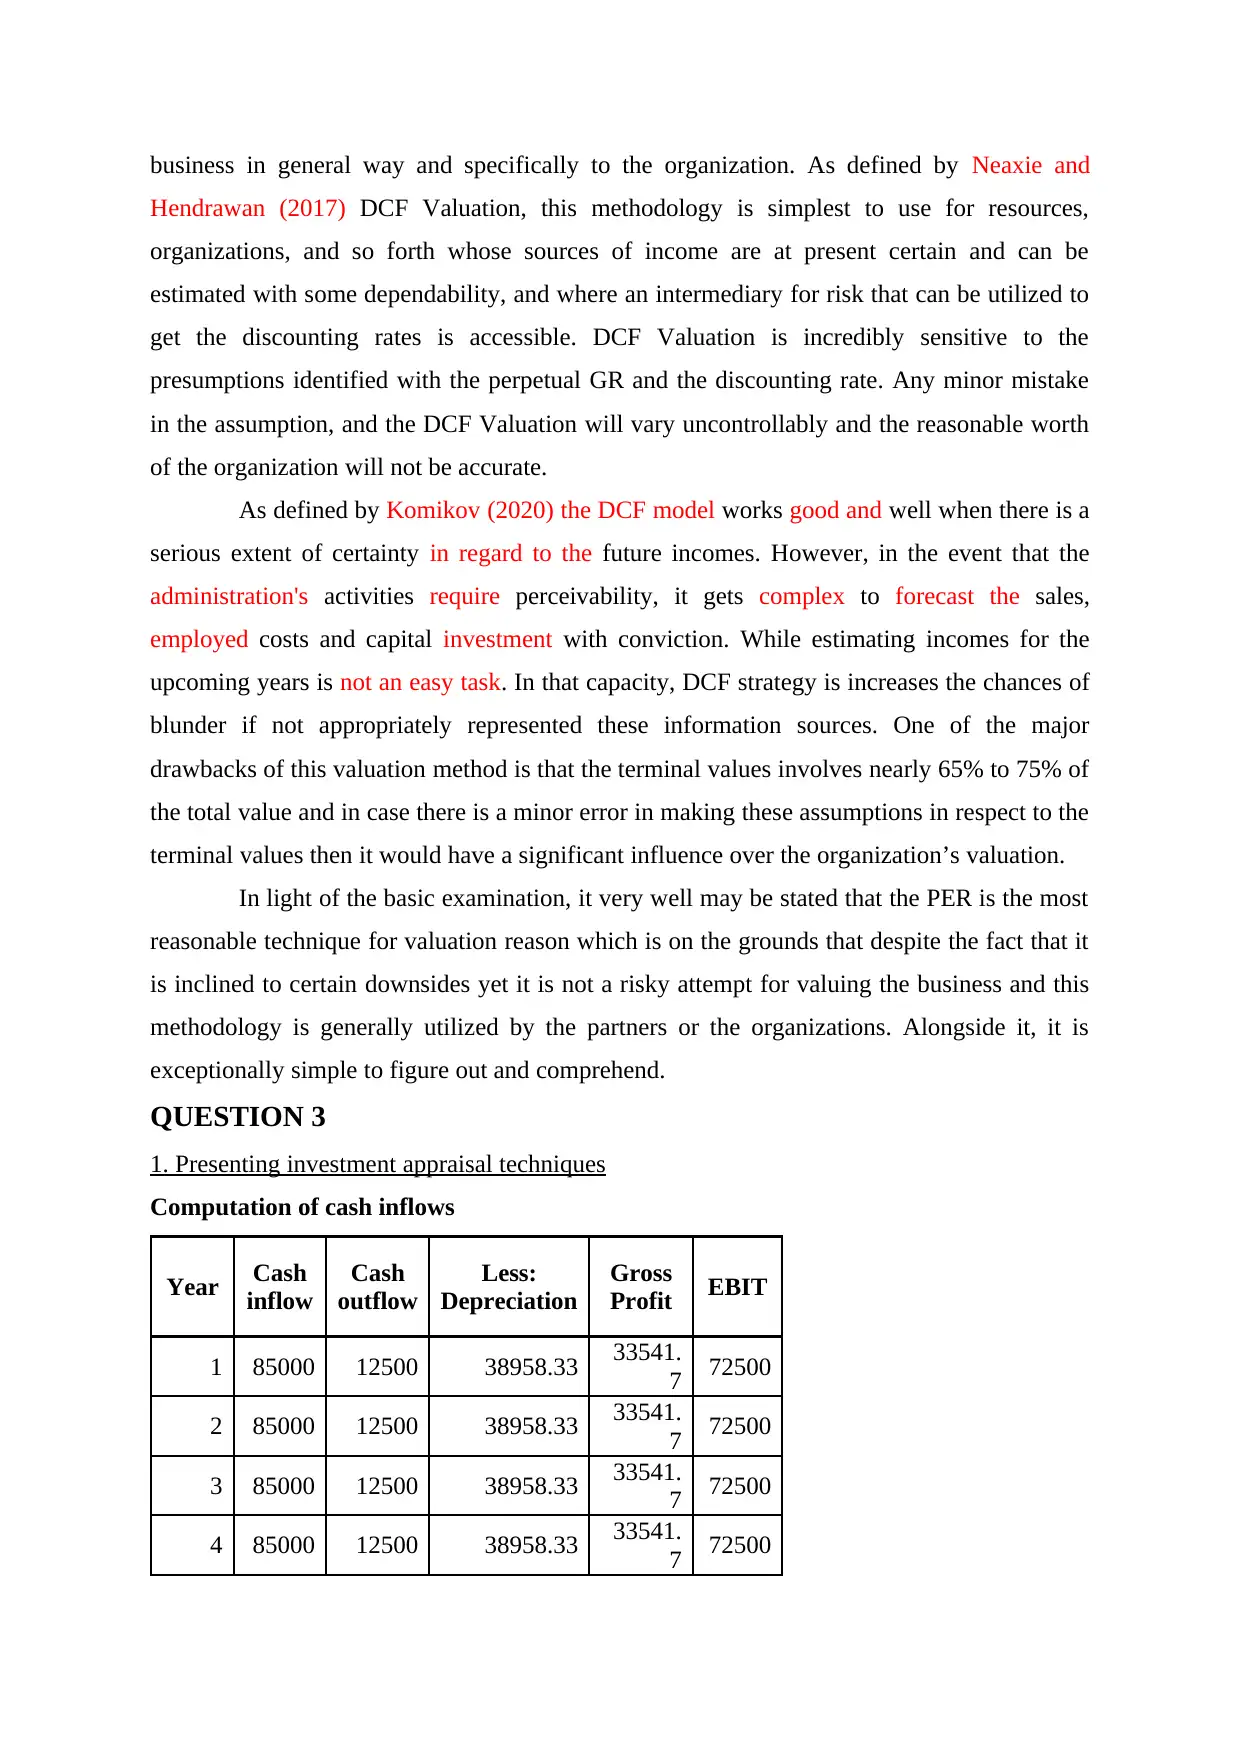
1. Presenting investment appraisal techniques
Computation of cash inflows
Year Cash
inflow
Cash
outflow
Less:
Depreciation
Gross
Profit EBIT
1 85000 12500 38958.33 33541.
7 72500
2 85000 12500 38958.33 33541.
7 72500
3 85000 12500 38958.33 33541.
7 72500
4 85000 12500 38958.33 33541.
7 72500
Hendrawan (2017) DCF Valuation, this methodology is simplest to use for resources,
organizations, and so forth whose sources of income are at present certain and can be
estimated with some dependability, and where an intermediary for risk that can be utilized to
get the discounting rates is accessible. DCF Valuation is incredibly sensitive to the
presumptions identified with the perpetual GR and the discounting rate. Any minor mistake
in the assumption, and the DCF Valuation will vary uncontrollably and the reasonable worth
of the organization will not be accurate.
As defined by Komikov (2020) the DCF model works good and well when there is a
serious extent of certainty in regard to the future incomes. However, in the event that the
administration's activities require perceivability, it gets complex to forecast the sales,
employed costs and capital investment with conviction. While estimating incomes for the
upcoming years is not an easy task. In that capacity, DCF strategy is increases the chances of
blunder if not appropriately represented these information sources. One of the major
drawbacks of this valuation method is that the terminal values involves nearly 65% to 75% of
the total value and in case there is a minor error in making these assumptions in respect to the
terminal values then it would have a significant influence over the organization’s valuation.
In light of the basic examination, it very well may be stated that the PER is the most
reasonable technique for valuation reason which is on the grounds that despite the fact that it
is inclined to certain downsides yet it is not a risky attempt for valuing the business and this
methodology is generally utilized by the partners or the organizations. Alongside it, it is
exceptionally simple to figure out and comprehend.
QUESTION 3
1. Presenting investment appraisal techniques
Computation of cash inflows
Year Cash
inflow
Cash
outflow
Less:
Depreciation
Gross
Profit EBIT
1 85000 12500 38958.33 33541.
7 72500
2 85000 12500 38958.33 33541.
7 72500
3 85000 12500 38958.33 33541.
7 72500
4 85000 12500 38958.33 33541.
7 72500
Paraphrase This Document
Need a fresh take? Get an instant paraphrase of this document with our AI Paraphraser
5 85000 12500 38958.33 33541.
7 72500
6 85000 12500 38958.33 33541.
7 72500
Calculating amount of depreciation
Cost of asset 275000
Useful life of the asset 6
Estimated salvage value 275000*15%
41250
Depreciation
(cost of asset - estimated salvage value) /
Useful of the asset
(275000-41250)/6
38958.33
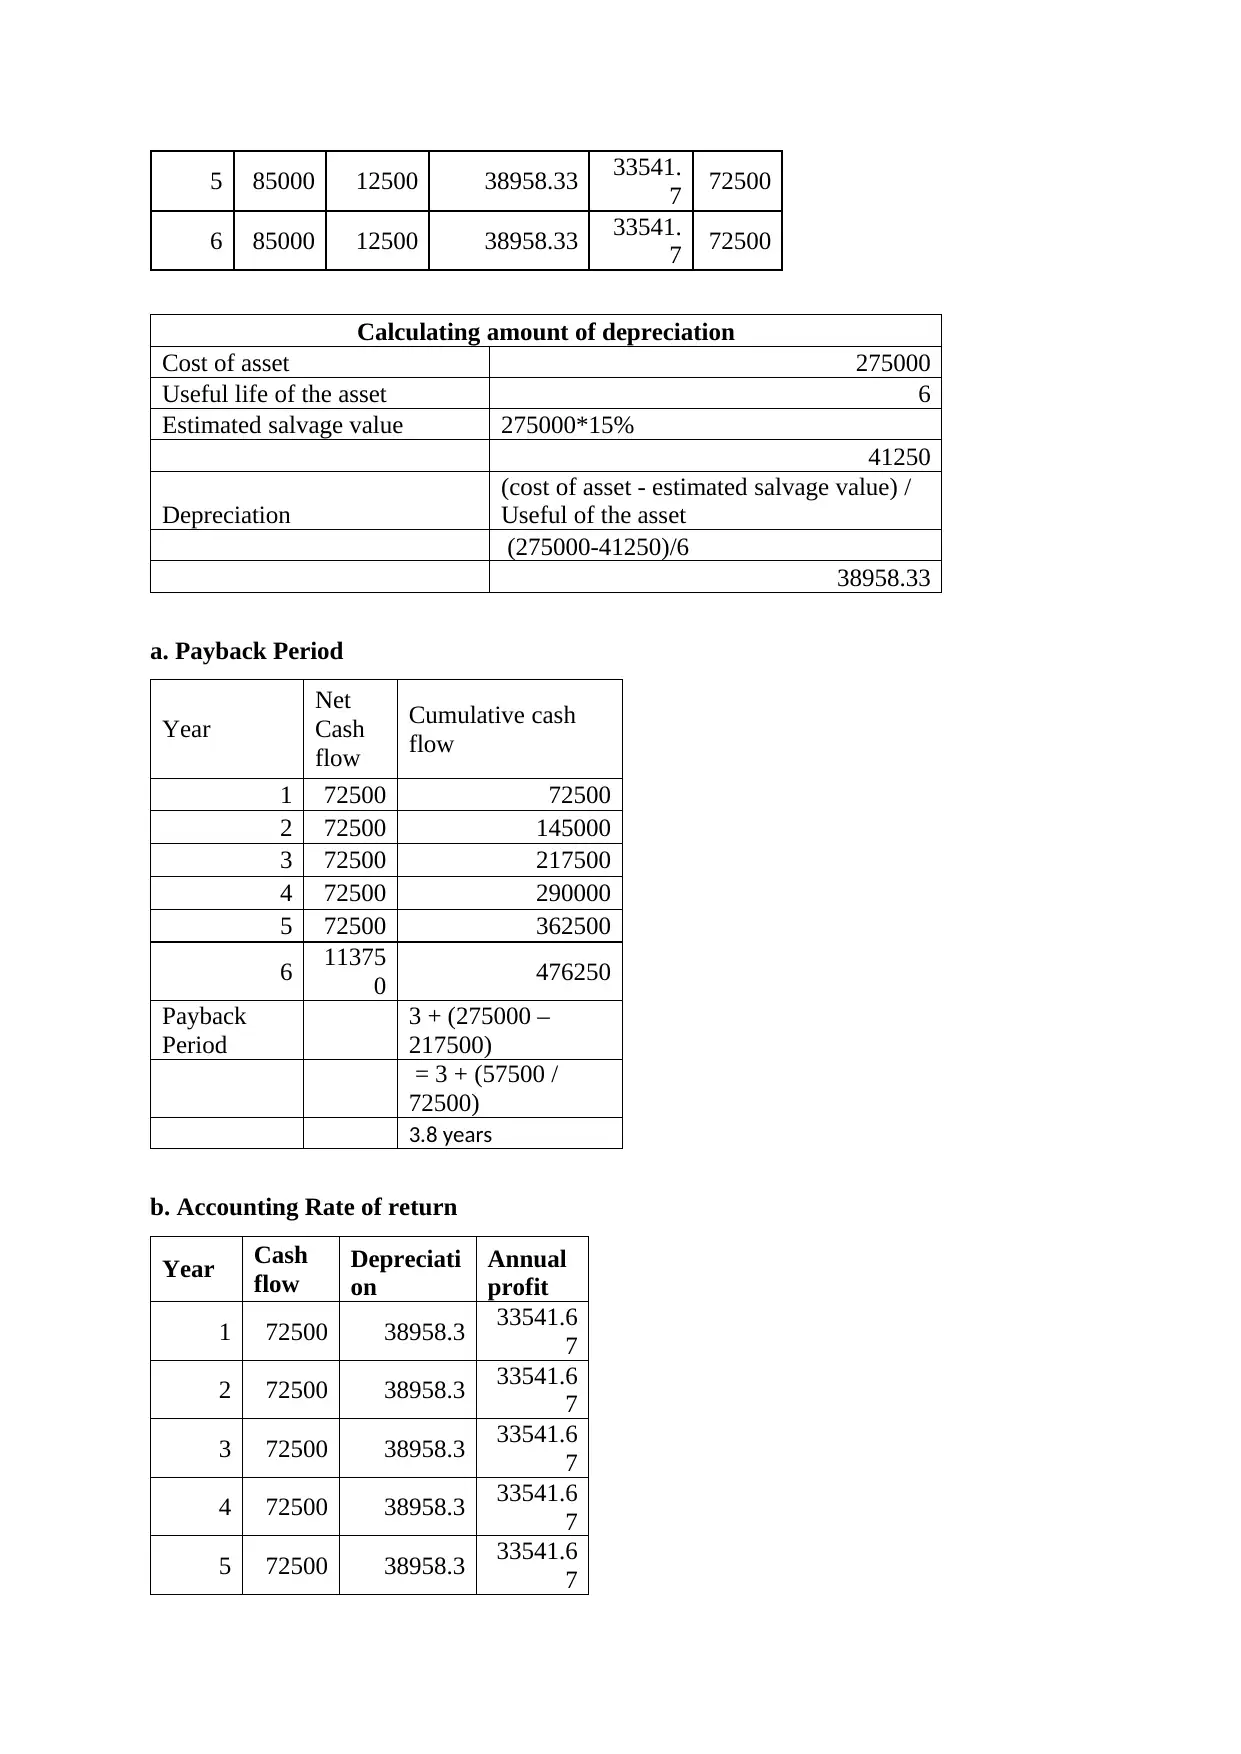
a. Payback Period
Year
Net
Cash
flow
Cumulative cash
flow
1 72500 72500
2 72500 145000
3 72500 217500
4 72500 290000
5 72500 362500
6 11375
0 476250
Payback
Period
3 + (275000 –
217500)
= 3 + (57500 /
72500)
3.8 years
b. Accounting Rate of return
Year Cash
flow
Depreciati
on
Annual
profit
1 72500 38958.3 33541.6
7
2 72500 38958.3 33541.6
7
3 72500 38958.3 33541.6
7
4 72500 38958.3 33541.6
7
5 72500 38958.3 33541.6
7
7 72500
6 85000 12500 38958.33 33541.
7 72500
Calculating amount of depreciation
Cost of asset 275000
Useful life of the asset 6
Estimated salvage value 275000*15%
41250
Depreciation
(cost of asset - estimated salvage value) /
Useful of the asset
(275000-41250)/6
38958.33
a. Payback Period
Year
Net
Cash
flow
Cumulative cash
flow
1 72500 72500
2 72500 145000
3 72500 217500
4 72500 290000
5 72500 362500
6 11375
0 476250
Payback
Period
3 + (275000 –
217500)
= 3 + (57500 /
72500)
3.8 years
b. Accounting Rate of return
Year Cash
flow
Depreciati
on
Annual
profit
1 72500 38958.3 33541.6
7
2 72500 38958.3 33541.6
7
3 72500 38958.3 33541.6
7
4 72500 38958.3 33541.6
7
5 72500 38958.3 33541.6
7
6 11375
0 38958.3 74791.6
7
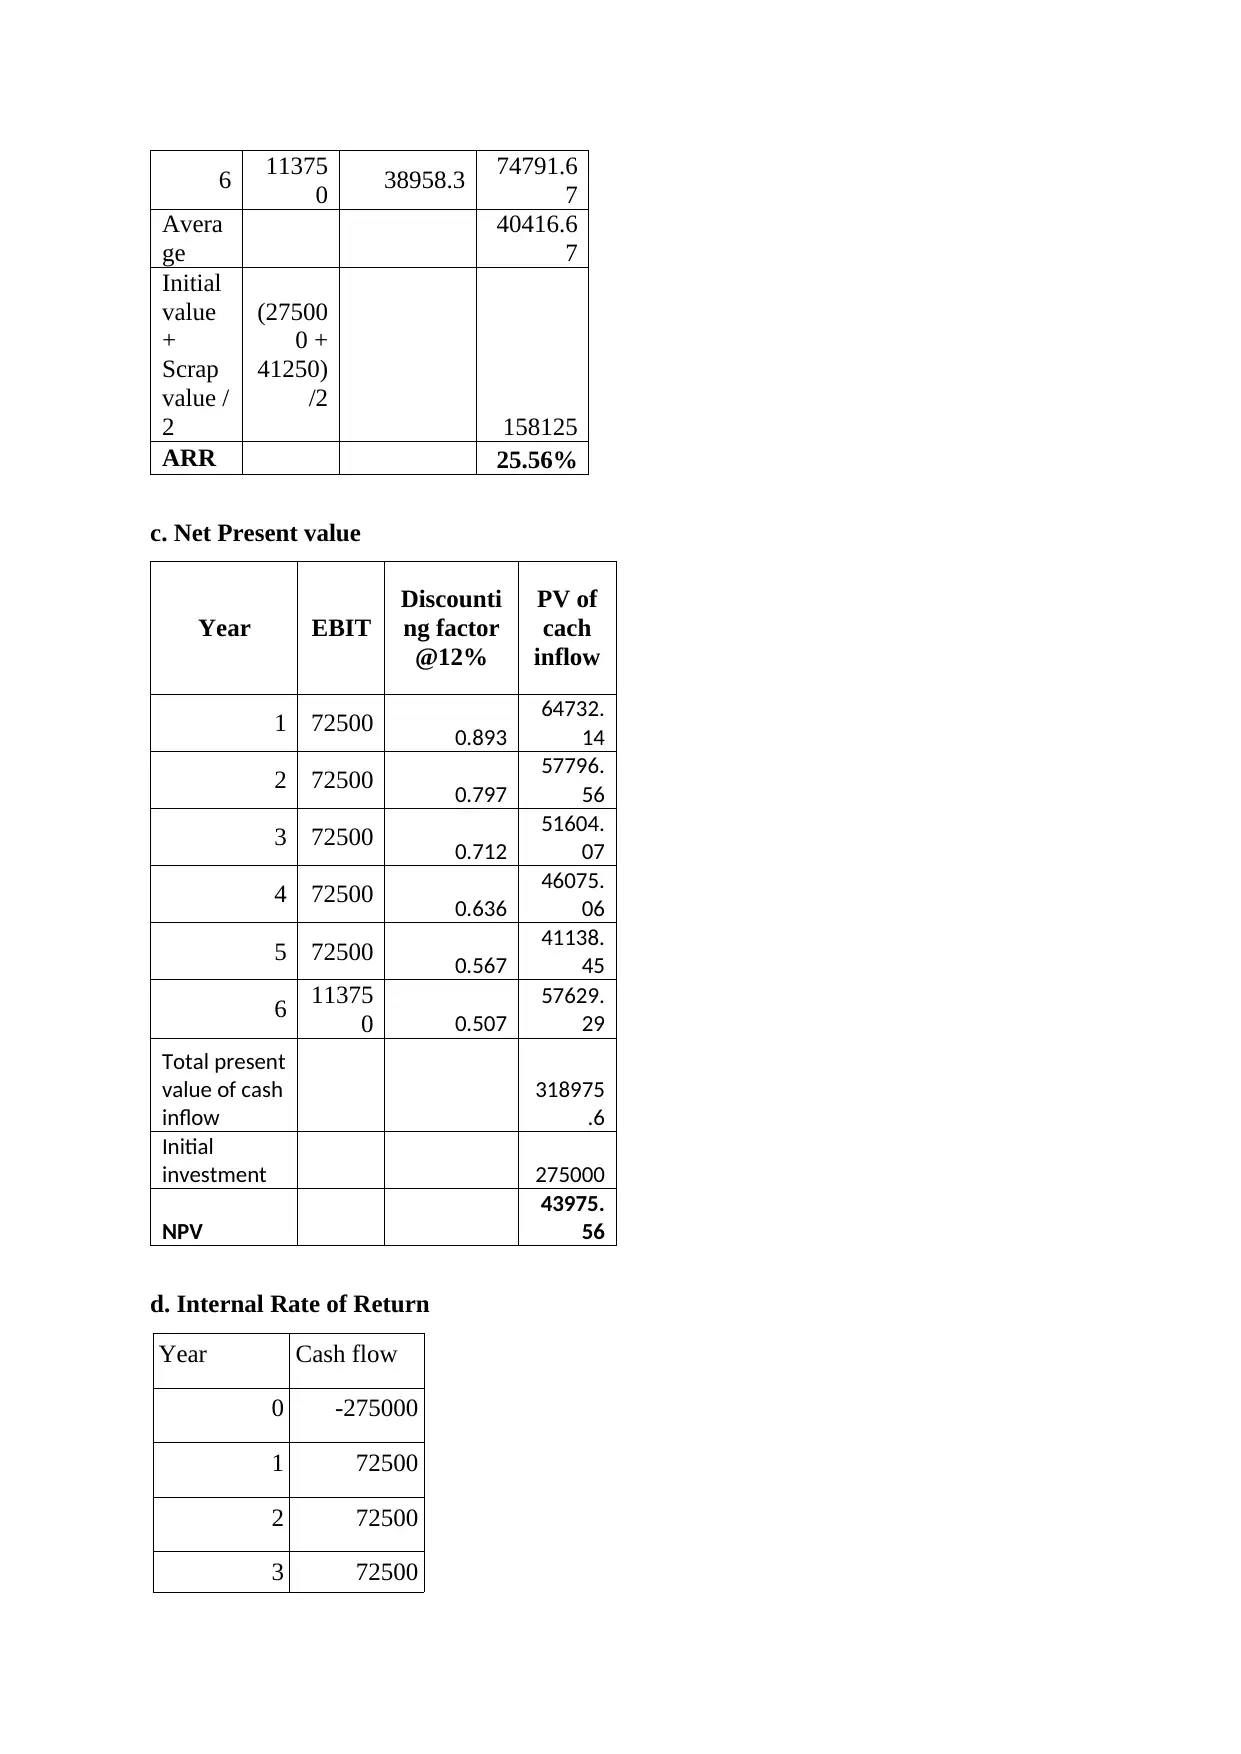
Avera
ge
40416.6
7
Initial
value
+
Scrap
value /
2
(27500
0 +
41250)
/2
158125
ARR 25.56%
c. Net Present value
Year EBIT
Discounti
ng factor
@12%
PV of
cach
inflow
1 72500 0.893
64732.
14
2 72500 0.797
57796.
56
3 72500 0.712
51604.
07
4 72500 0.636
46075.
06
5 72500 0.567
41138.
45
6 11375
0 0.507
57629.
29
Total present
value of cash
inflow
318975
.6
Initial
investment 275000
NPV
43975.
56
d. Internal Rate of Return
Year Cash flow
0 -275000
1 72500
2 72500
3 72500
0 38958.3 74791.6
7
Avera
ge
40416.6
7
Initial
value
+
Scrap
value /
2
(27500
0 +
41250)
/2
158125
ARR 25.56%
c. Net Present value
Year EBIT
Discounti
ng factor
@12%
PV of
cach
inflow
1 72500 0.893
64732.
14
2 72500 0.797
57796.
56
3 72500 0.712
51604.
07
4 72500 0.636
46075.
06
5 72500 0.567
41138.
45
6 11375
0 0.507
57629.
29
Total present
value of cash
inflow
318975
.6
Initial
investment 275000
NPV
43975.
56
d. Internal Rate of Return
Year Cash flow
0 -275000
1 72500
2 72500
3 72500
⊘ This is a preview!⊘
Do you want full access?
Subscribe today to unlock all pages.
Trusted by 1+ million students worldwide
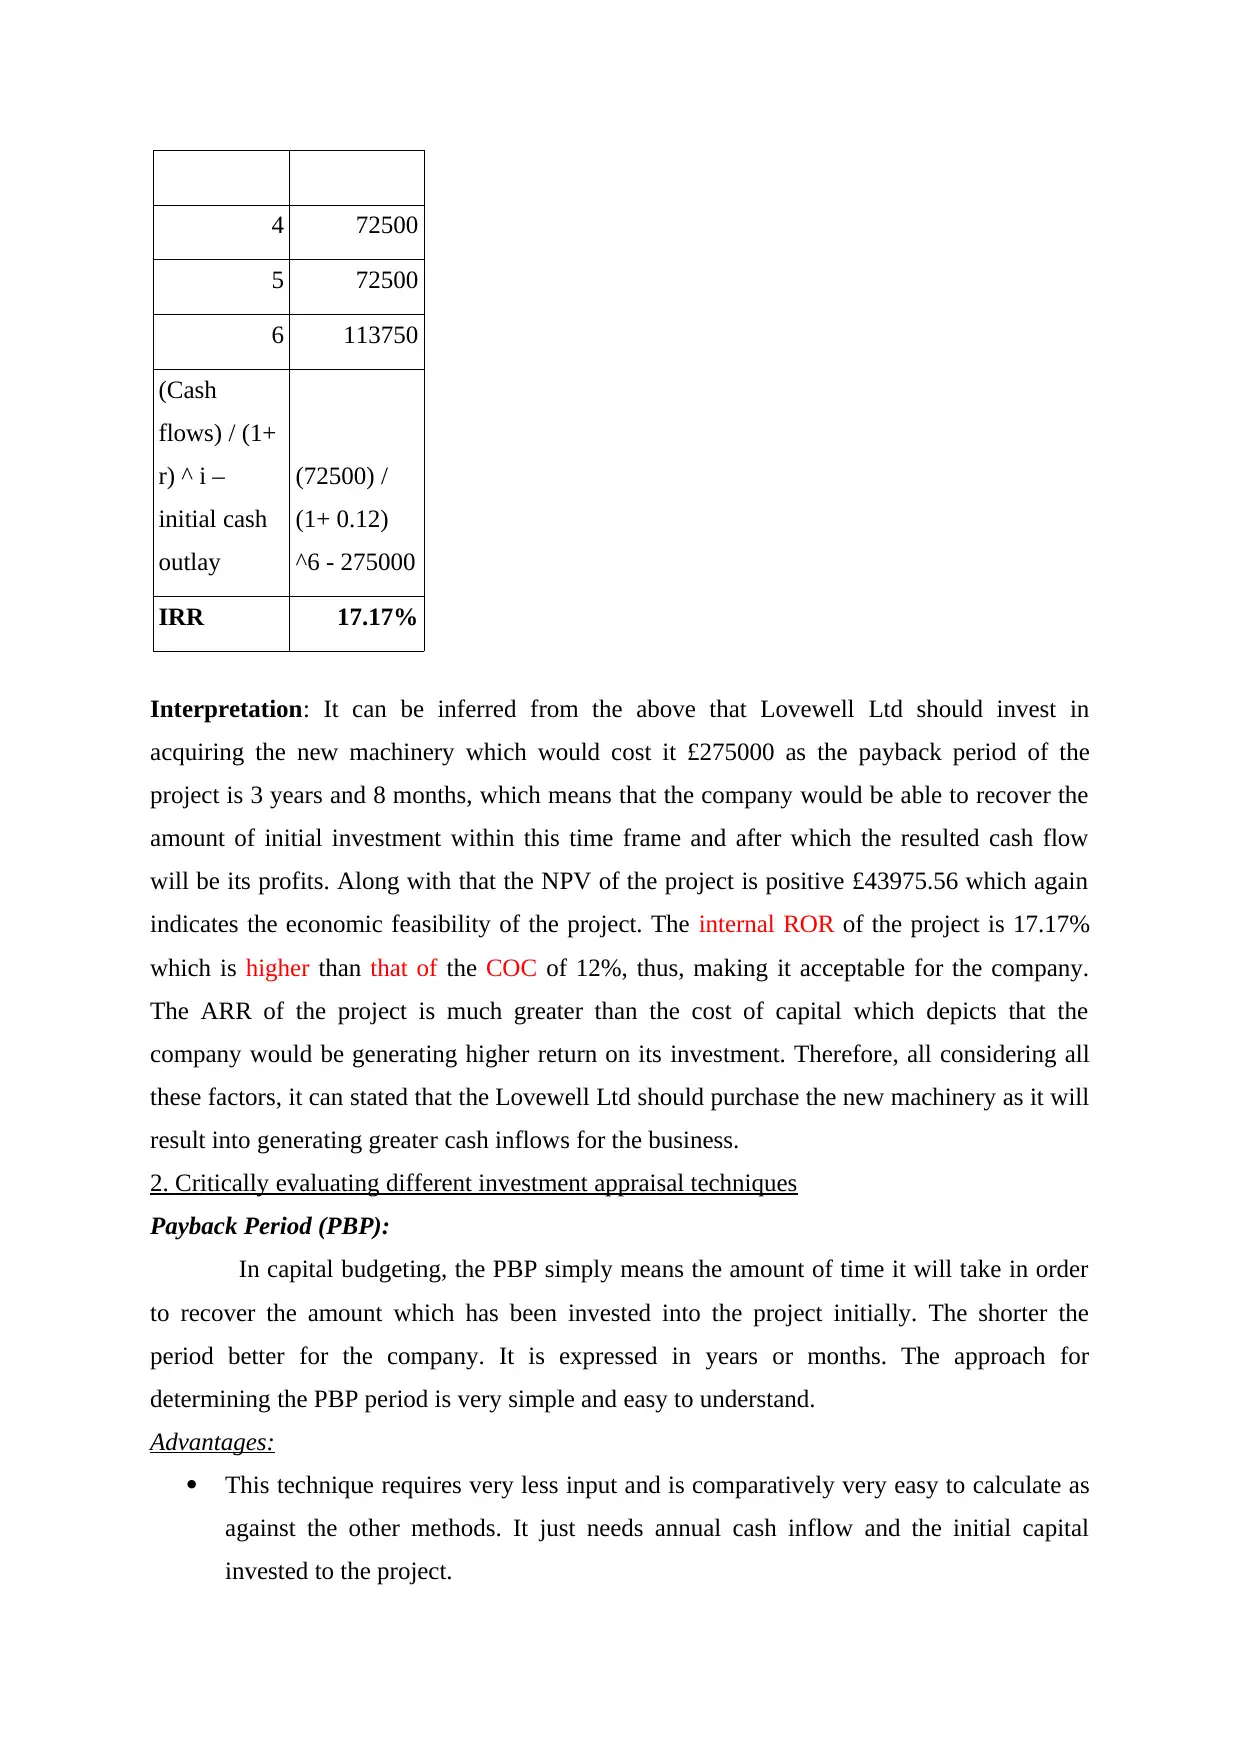
4 72500
5 72500
6 113750
(Cash
flows) / (1+
r) ^ i –
initial cash
outlay
(72500) /
(1+ 0.12)
^6 - 275000
IRR 17.17%
Interpretation: It can be inferred from the above that Lovewell Ltd should invest in
acquiring the new machinery which would cost it £275000 as the payback period of the
project is 3 years and 8 months, which means that the company would be able to recover the
amount of initial investment within this time frame and after which the resulted cash flow
will be its profits. Along with that the NPV of the project is positive £43975.56 which again
indicates the economic feasibility of the project. The internal ROR of the project is 17.17%
which is higher than that of the COC of 12%, thus, making it acceptable for the company.
The ARR of the project is much greater than the cost of capital which depicts that the
company would be generating higher return on its investment. Therefore, all considering all
these factors, it can stated that the Lovewell Ltd should purchase the new machinery as it will
result into generating greater cash inflows for the business.
2. Critically evaluating different investment appraisal techniques
Payback Period (PBP):
In capital budgeting, the PBP simply means the amount of time it will take in order
to recover the amount which has been invested into the project initially. The shorter the
period better for the company. It is expressed in years or months. The approach for
determining the PBP period is very simple and easy to understand.
Advantages:
This technique requires very less input and is comparatively very easy to calculate as
against the other methods. It just needs annual cash inflow and the initial capital
invested to the project.
Paraphrase This Document
Need a fresh take? Get an instant paraphrase of this document with our AI Paraphraser
It provides crucial information which other methods fails to provide. Under this,
usually projects having a shorter PBP is also carrying lower risk (Ali and Hashlamun,
2019). This is important to the businesses which are having limited resources and
requires to quickly recover the amount invested.
This is beneficial in the industries which are uncertain and faces rapid change in
technology. These uncertainty results into making future cash inflows difficult. Thus,
focusing on projects with lower PBP helps in reducing the chances of loss.
Disadvantages:
The key downside of it is that it does not account for the time value of money and
therefore, affecting the actual value of the cash flow.
This method only considers the cash flows until the amount initially invested is
recovered. It does not consider cash flow generating after that time frame (Kim, Park
and Sawng, 2018). This cause looking the true potential of the project as there are
times when the lucrative cash flow s generated later on years.
It does not account for the profits as the shorter PBP does not provide any guarantee
the profitability. There are times when the cash flow from the project stops or reduces
after the PBP making the project not feasible.
Accounting rate of return (ARR):
The ARR provides the rate of return from the amount invested in the project. In
other words, it gives the accounting profits which is being arisen from the investment made in
the form of a percentage.
Advantages
Just like PBP it is very simple and easy to determine the value. It just requires the
total profits over the entire life of the venture (Torabi, Giahi and Sahebjamnia, 2016).
This approach undertakes the concept of net earnings after tax and depreciation. This
is considered as a crucial factor in capital budgeting.
This technique encourages the comparison of new project venture with that of cost
diminishing undertaking or other different investment proposals of similar nature.
This technique provides a clear depiction of the gainfulness of a task and is valuable
to quantify current performance level of the company.
Disadvantages:
It creates a problem if one calculates the ROI and others ARR as it will make the
situation complex in carrying out the decision.
This approach ignores time value of money which is its biggest weakness. Along with
that, the fair rate cannot be determined by using ARR.
It does not take into account the outside aspects which has a higher influence on the
profitability of the business entity (Ejoh, Okpa and Ibanga, 2016).
It does not consider the time period in which profit is earned, such as, 18% ROR in 10
years would be more favorable than the 14% ROR which is for 6 years. This is not
correct as the longer is the time frame, greater is the risk involved.
Net Present Value (NPV):
This technique of investment appraisal provides information on whether the total
cash flow that will be generated by the investment will exceed the cost involved in it. The
resulting outcome can be either positive or negative. The positive means that project is
generating positive cash flow while negative means that the project won’t be able to exceed
the cost.
Advantages:
This method can be implemented very easily if the discounting rate and annual cash
inflow is provided. Under this, the discounting rate is decided by the management
which can be adjusted with the risk prevailing within the industry along with the other
important factors which are essential for getting the desired output.
NPV also considers the inflation rate in order to determine the right future
profitability and cash inflow (Michalkova and Spuchlakova, 2017). Thus, it considers
the time factor for determining the present value of future cash flow.
Through this, multiple projects can be compared with the same expected life under the
situation of mutually exclusive projects. This helps in selecting the most appropriate
and economically feasible project.
Disadvantages:
There are chances that it becomes difficult to calculate the opportunity which is
mainly considered in the initial outlay and thus, underestimating the initial cash
outflow would might distort the end result. Along with that, the sunk cost is also not
included which mainly includes the research and development cost incurred before
initiating the project.
The rate at which the cash flows are to be discounted is very difficult to determine.
Many a times firms make use of the WACC as the discount rate but it should be the
projects ROR and therefore, the wrong discounting rate might result into making
wrong estimation causing incorrect NPV value (Baker, Jabbouri and Dyaz, 2017). The
⊘ This is a preview!⊘
Do you want full access?
Subscribe today to unlock all pages.
Trusted by 1+ million students worldwide
1 out of 14
Related Documents


Your All-in-One AI-Powered Toolkit for Academic Success.
+13062052269
info@desklib.com
Available 24*7 on WhatsApp / Email
![[object Object]](/_next/static/media/star-bottom.7253800d.svg)
Unlock your academic potential
Copyright © 2020–2026 A2Z Services. All Rights Reserved. Developed and managed by ZUCOL.