Semester 1 Financial Management and Decision Making Assignment
VerifiedAdded on 2022/11/29
|15
|2884
|388
Homework Assignment
AI Summary
This document presents a comprehensive solution to a financial management and decision-making assignment. The assignment covers several key areas, including capital budgeting techniques like payback period and net present value (NPV), with detailed calculations and recommendations. It analyzes financial ratios, such as gross profit margin, operating profit margin, and liquidity ratios, to assess a company's performance over two years. The solution also involves variance analysis, calculating sales, material, labor, and overhead variances, along with an operating statement. Additionally, it includes break-even point analysis for two products, determining contribution margins and break-even points in units. The assignment emphasizes the application of financial concepts to real-world scenarios, providing a thorough understanding of financial management principles.
SEMESTER 1, EXAMINATION 2021/22
FINANCIAL MANAGEMENT AND DECISION
MAKING
MODULE NO: BMP5006
Date: 05 June 2021 Exam Start Time: 10:00 am
(Submit by 10:00 pm on 05 June
2021)
ANSWER BOOKLET
All the pages of the answer booklet should be submitted including blank ones.
Please type your answers in the spaces provided.
Insert additional pages where required.
Student Name
ID Number
Question 1
(a)
Calculation of Payback Period for each product:
Paraphrase This Document
Need a fresh take? Get an instant paraphrase of this document with our AI Paraphraser

Project A Project B Project C
£ £ £
Year 1 4000 5000 4000
2 of 15
£ £ £
Year 1 4000 5000 4000
2 of 15
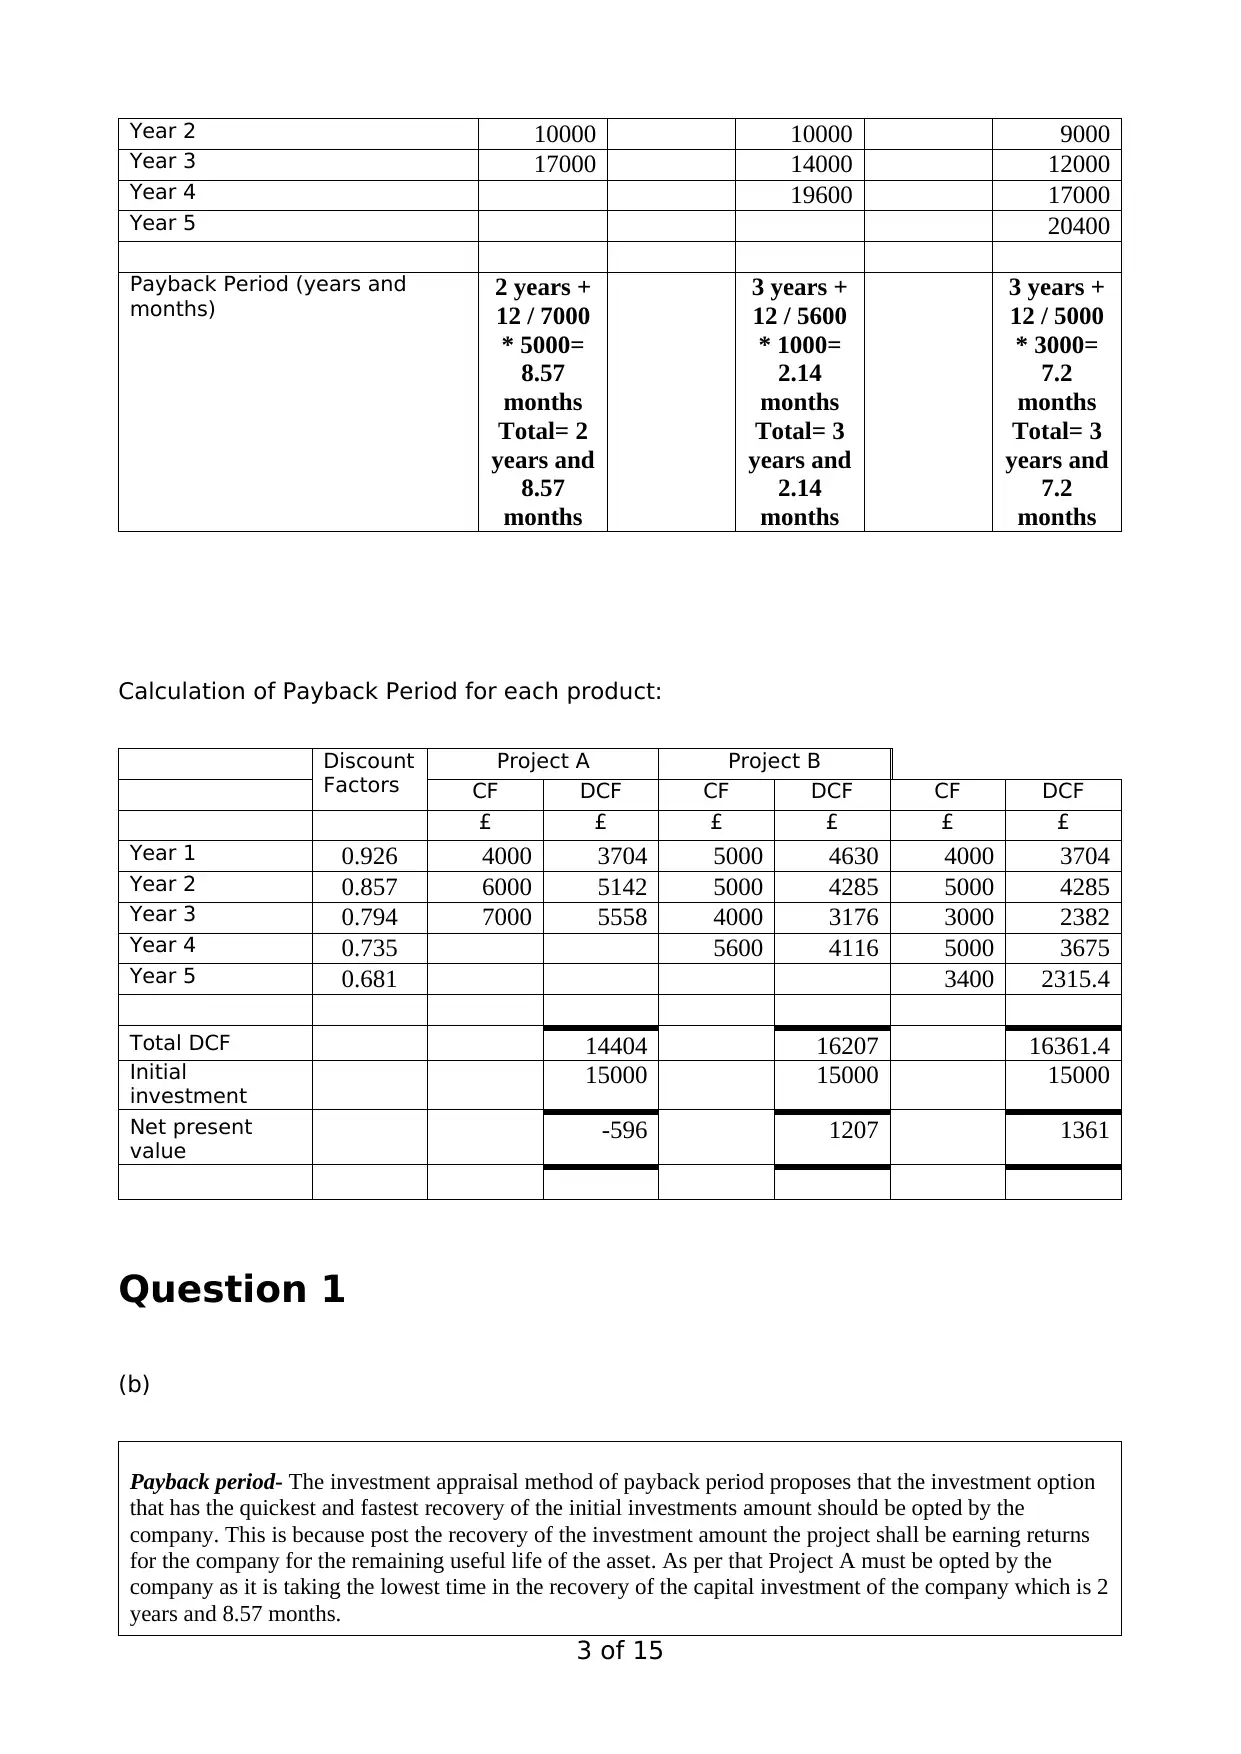
Year 2 10000 10000 9000
Year 3 17000 14000 12000
Year 4 19600 17000
Year 5 20400
Payback Period (years and
months) 2 years +
12 / 7000
* 5000=
8.57
months
Total= 2
years and
8.57
months
3 years +
12 / 5600
* 1000=
2.14
months
Total= 3
years and
2.14
months
3 years +
12 / 5000
* 3000=
7.2
months
Total= 3
years and
7.2
months
Calculation of Payback Period for each product:
Discount
Factors
Project A Project B
CF DCF CF DCF CF DCF
£ £ £ £ £ £
Year 1 0.926 4000 3704 5000 4630 4000 3704
Year 2 0.857 6000 5142 5000 4285 5000 4285
Year 3 0.794 7000 5558 4000 3176 3000 2382
Year 4 0.735 5600 4116 5000 3675
Year 5 0.681 3400 2315.4
Total DCF 14404 16207 16361.4
Initial
investment 15000 15000 15000
Net present
value -596 1207 1361
Question 1
(b)
Payback period- The investment appraisal method of payback period proposes that the investment option
that has the quickest and fastest recovery of the initial investments amount should be opted by the
company. This is because post the recovery of the investment amount the project shall be earning returns
for the company for the remaining useful life of the asset. As per that Project A must be opted by the
company as it is taking the lowest time in the recovery of the capital investment of the company which is 2
years and 8.57 months.
3 of 15
⊘ This is a preview!⊘
Do you want full access?
Subscribe today to unlock all pages.
Trusted by 1+ million students worldwide
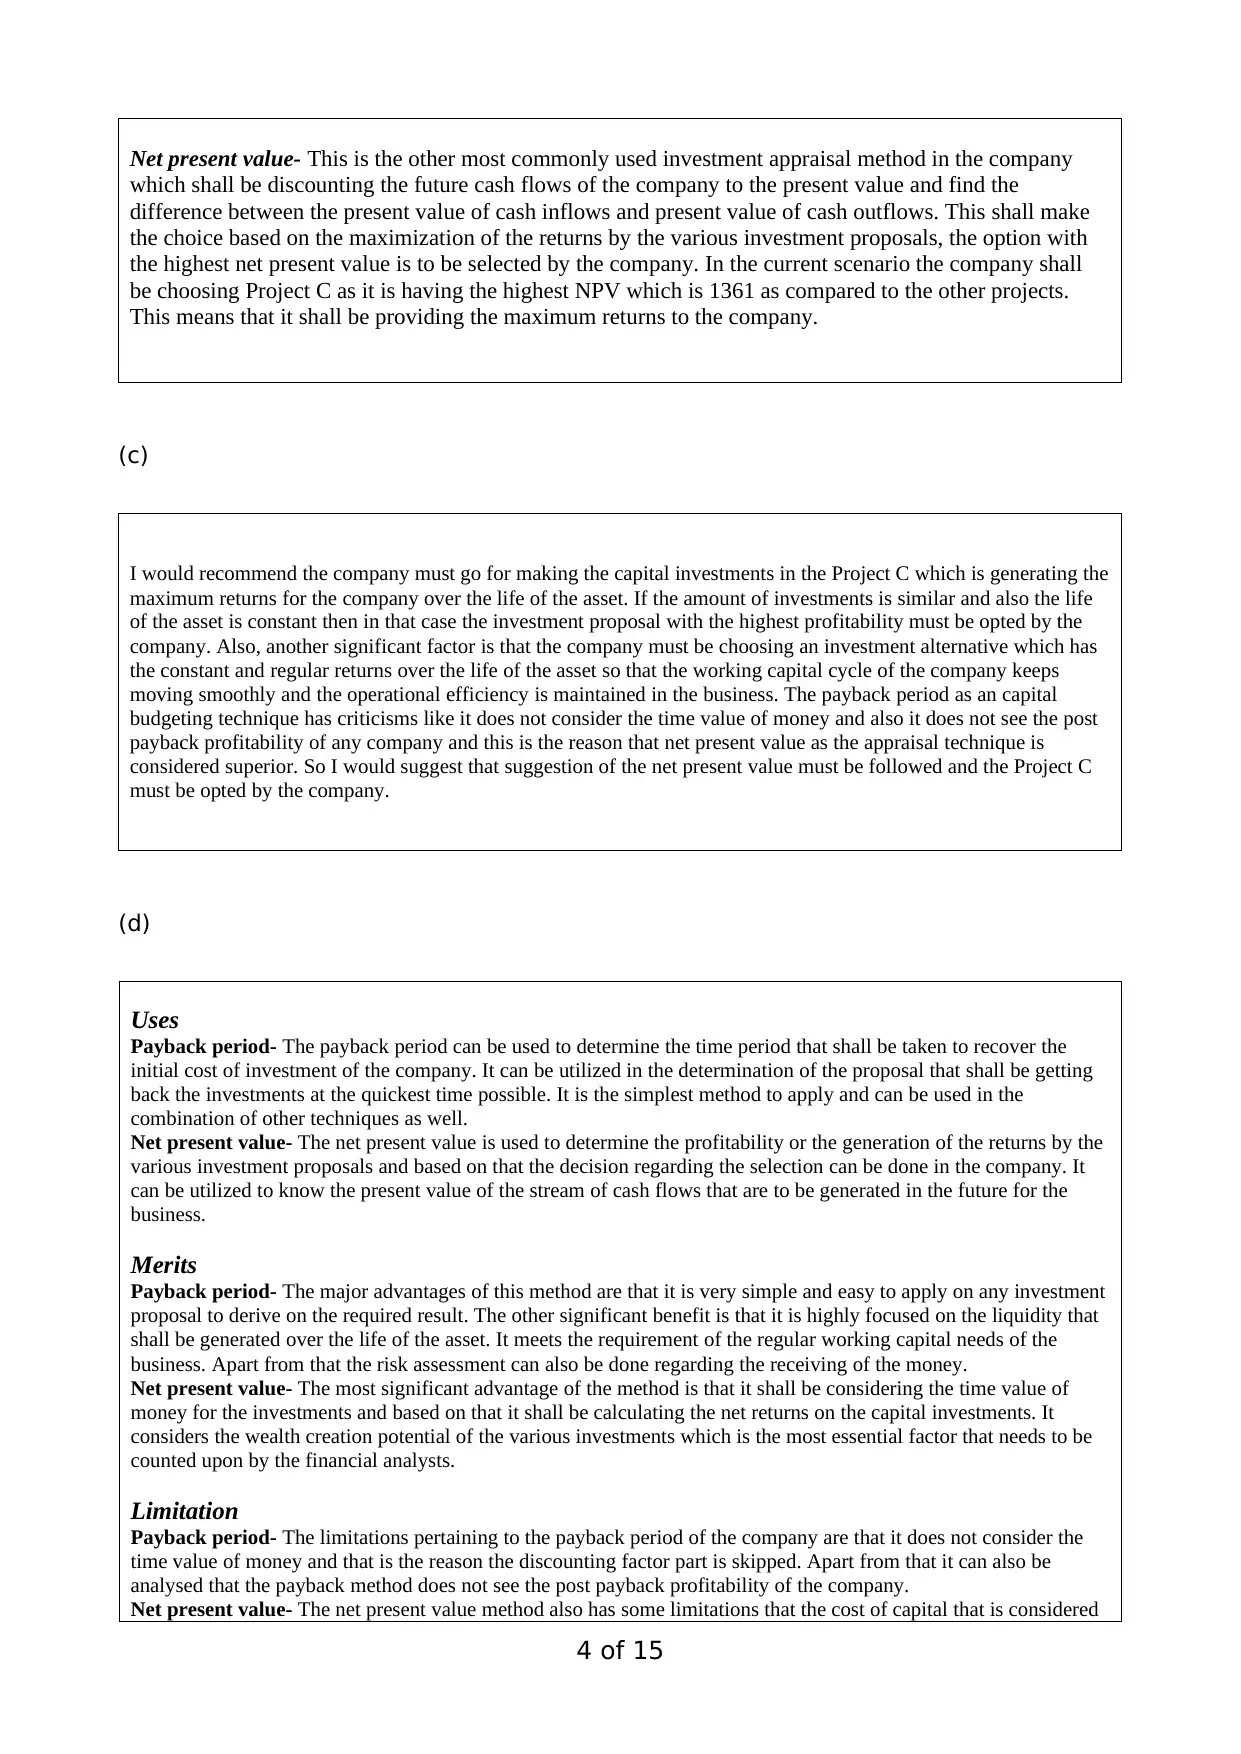
Net present value- This is the other most commonly used investment appraisal method in the company
which shall be discounting the future cash flows of the company to the present value and find the
difference between the present value of cash inflows and present value of cash outflows. This shall make
the choice based on the maximization of the returns by the various investment proposals, the option with
the highest net present value is to be selected by the company. In the current scenario the company shall
be choosing Project C as it is having the highest NPV which is 1361 as compared to the other projects.
This means that it shall be providing the maximum returns to the company.
(c)
I would recommend the company must go for making the capital investments in the Project C which is generating the
maximum returns for the company over the life of the asset. If the amount of investments is similar and also the life
of the asset is constant then in that case the investment proposal with the highest profitability must be opted by the
company. Also, another significant factor is that the company must be choosing an investment alternative which has
the constant and regular returns over the life of the asset so that the working capital cycle of the company keeps
moving smoothly and the operational efficiency is maintained in the business. The payback period as an capital
budgeting technique has criticisms like it does not consider the time value of money and also it does not see the post
payback profitability of any company and this is the reason that net present value as the appraisal technique is
considered superior. So I would suggest that suggestion of the net present value must be followed and the Project C
must be opted by the company.
(d)
Uses
Payback period- The payback period can be used to determine the time period that shall be taken to recover the
initial cost of investment of the company. It can be utilized in the determination of the proposal that shall be getting
back the investments at the quickest time possible. It is the simplest method to apply and can be used in the
combination of other techniques as well.
Net present value- The net present value is used to determine the profitability or the generation of the returns by the
various investment proposals and based on that the decision regarding the selection can be done in the company. It
can be utilized to know the present value of the stream of cash flows that are to be generated in the future for the
business.
Merits
Payback period- The major advantages of this method are that it is very simple and easy to apply on any investment
proposal to derive on the required result. The other significant benefit is that it is highly focused on the liquidity that
shall be generated over the life of the asset. It meets the requirement of the regular working capital needs of the
business. Apart from that the risk assessment can also be done regarding the receiving of the money.
Net present value- The most significant advantage of the method is that it shall be considering the time value of
money for the investments and based on that it shall be calculating the net returns on the capital investments. It
considers the wealth creation potential of the various investments which is the most essential factor that needs to be
counted upon by the financial analysts.
Limitation
Payback period- The limitations pertaining to the payback period of the company are that it does not consider the
time value of money and that is the reason the discounting factor part is skipped. Apart from that it can also be
analysed that the payback method does not see the post payback profitability of the company.
Net present value- The net present value method also has some limitations that the cost of capital that is considered
4 of 15
Paraphrase This Document
Need a fresh take? Get an instant paraphrase of this document with our AI Paraphraser
is used on the estimated basis by the company. Apart from that it can be assessed that this method is not applicable
on the projects having different investment amounts as they do not stand comparable.
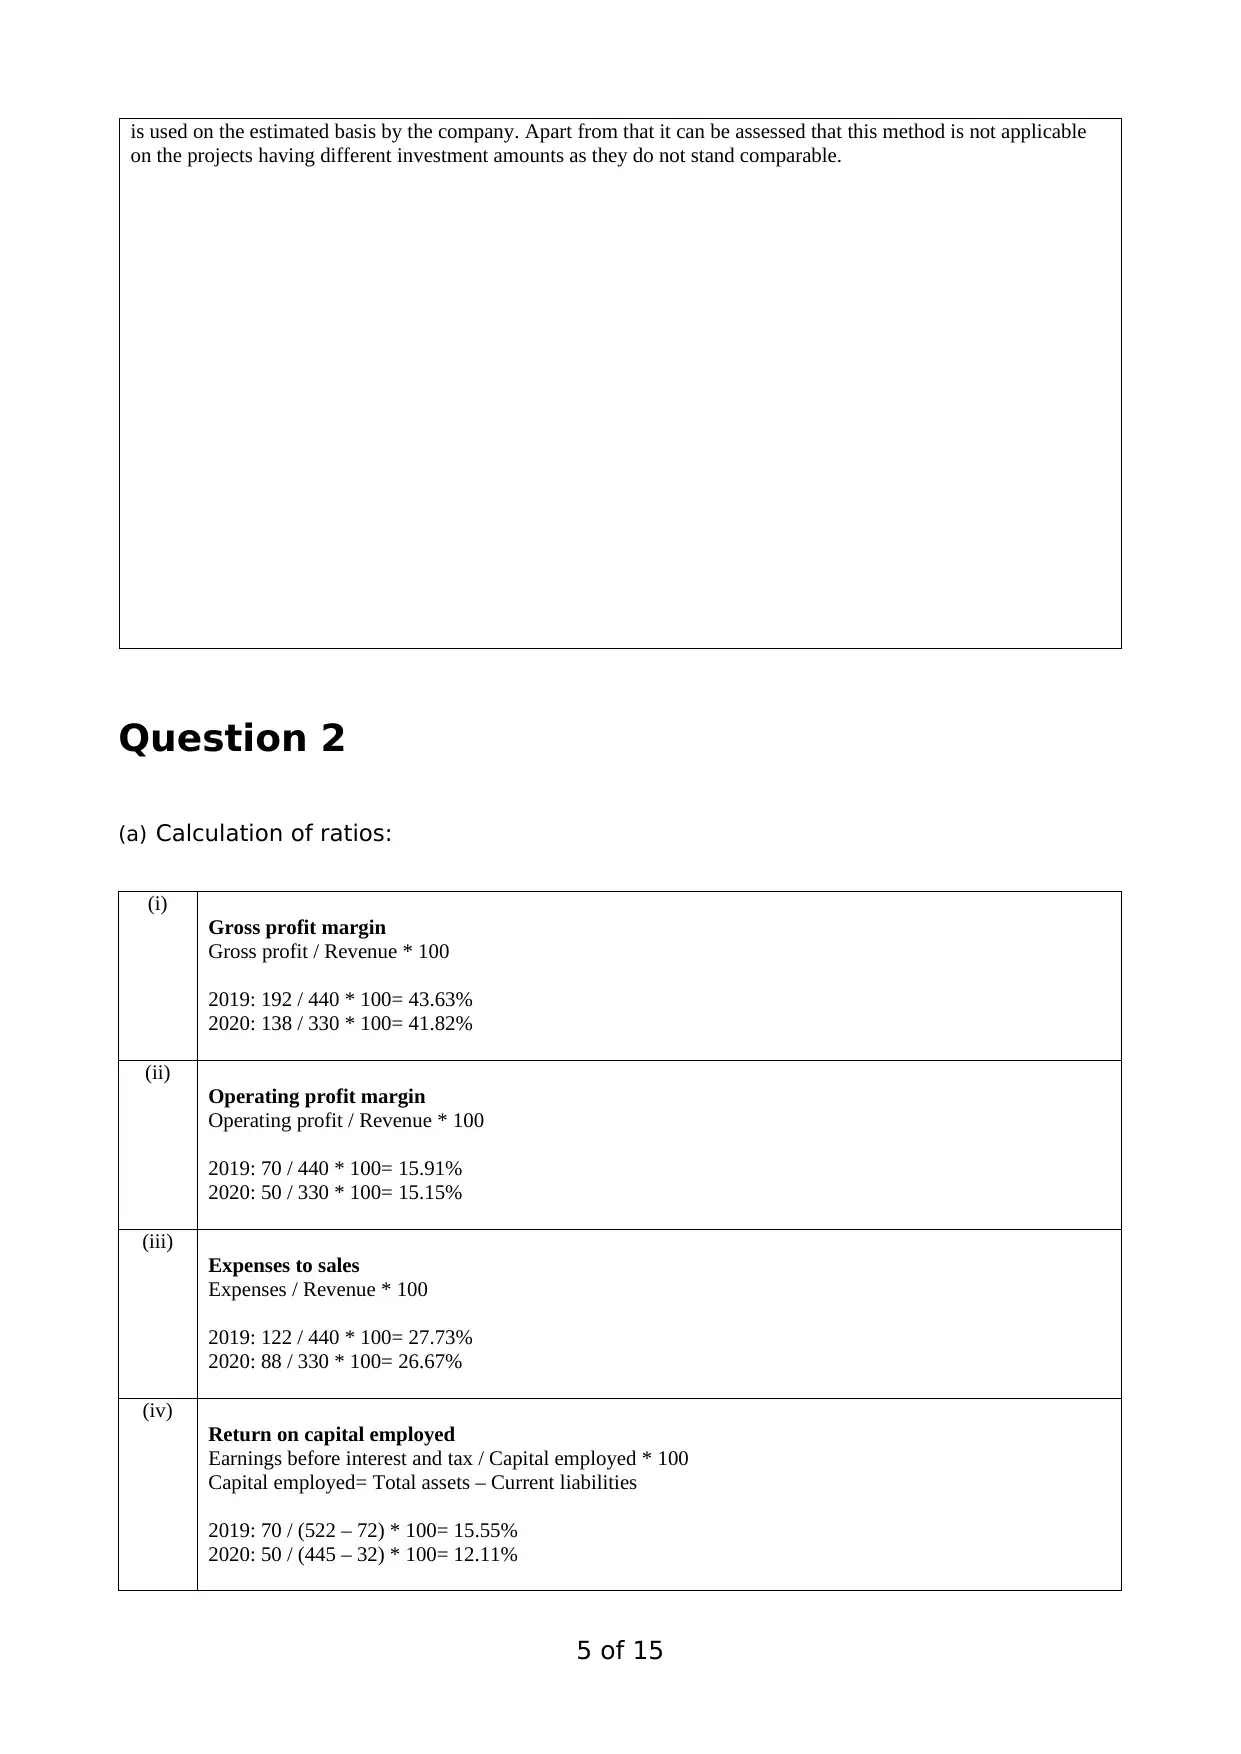
Question 2
(a) Calculation of ratios:
(i)
Gross profit margin
Gross profit / Revenue * 100
2019: 192 / 440 * 100= 43.63%
2020: 138 / 330 * 100= 41.82%
(ii)
Operating profit margin
Operating profit / Revenue * 100
2019: 70 / 440 * 100= 15.91%
2020: 50 / 330 * 100= 15.15%
(iii)
Expenses to sales
Expenses / Revenue * 100
2019: 122 / 440 * 100= 27.73%
2020: 88 / 330 * 100= 26.67%
(iv)
Return on capital employed
Earnings before interest and tax / Capital employed * 100
Capital employed= Total assets – Current liabilities
2019: 70 / (522 – 72) * 100= 15.55%
2020: 50 / (445 – 32) * 100= 12.11%
5 of 15
on the projects having different investment amounts as they do not stand comparable.
Question 2
(a) Calculation of ratios:
(i)
Gross profit margin
Gross profit / Revenue * 100
2019: 192 / 440 * 100= 43.63%
2020: 138 / 330 * 100= 41.82%
(ii)
Operating profit margin
Operating profit / Revenue * 100
2019: 70 / 440 * 100= 15.91%
2020: 50 / 330 * 100= 15.15%
(iii)
Expenses to sales
Expenses / Revenue * 100
2019: 122 / 440 * 100= 27.73%
2020: 88 / 330 * 100= 26.67%
(iv)
Return on capital employed
Earnings before interest and tax / Capital employed * 100
Capital employed= Total assets – Current liabilities
2019: 70 / (522 – 72) * 100= 15.55%
2020: 50 / (445 – 32) * 100= 12.11%
5 of 15
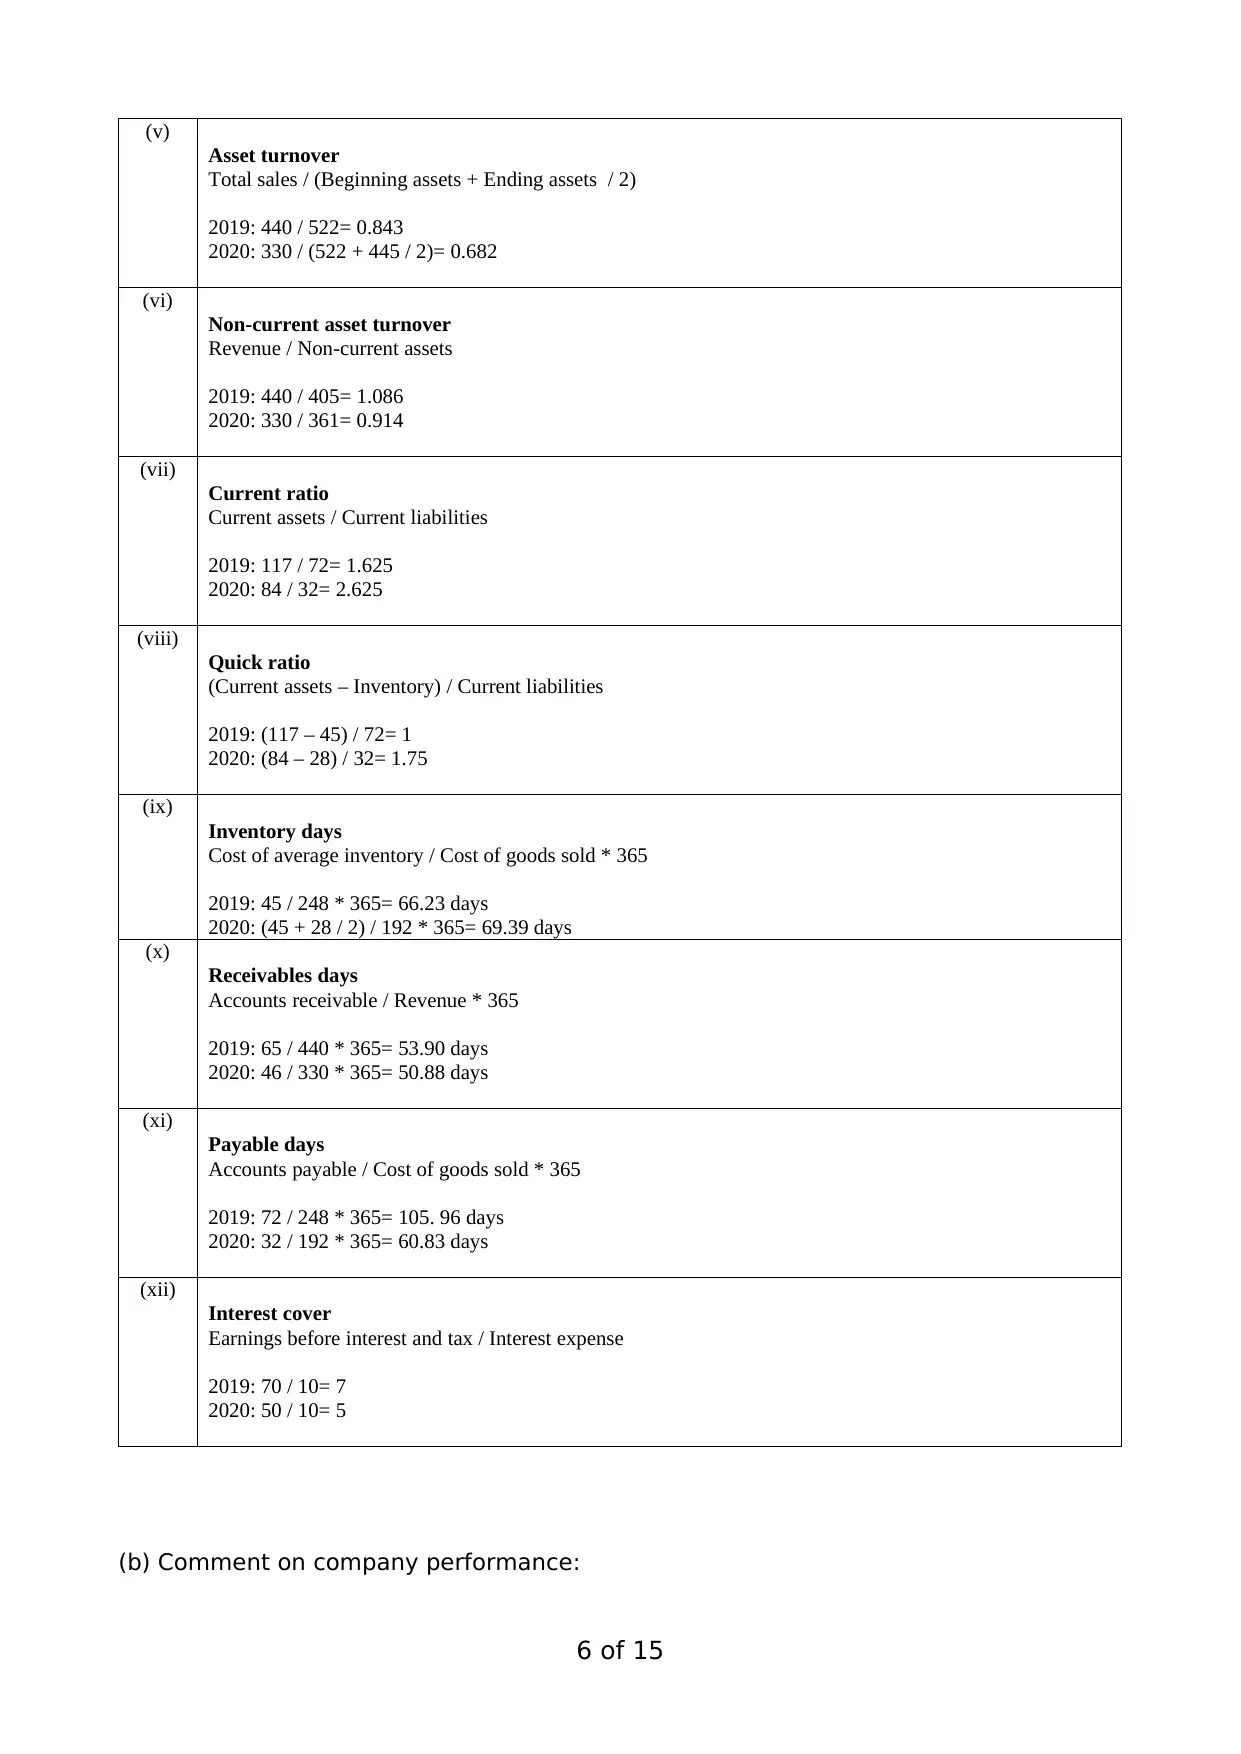
(v)
Asset turnover
Total sales / (Beginning assets + Ending assets / 2)
2019: 440 / 522= 0.843
2020: 330 / (522 + 445 / 2)= 0.682
(vi)
Non-current asset turnover
Revenue / Non-current assets
2019: 440 / 405= 1.086
2020: 330 / 361= 0.914
(vii)
Current ratio
Current assets / Current liabilities
2019: 117 / 72= 1.625
2020: 84 / 32= 2.625
(viii)
Quick ratio
(Current assets – Inventory) / Current liabilities
2019: (117 – 45) / 72= 1
2020: (84 – 28) / 32= 1.75
(ix)
Inventory days
Cost of average inventory / Cost of goods sold * 365
2019: 45 / 248 * 365= 66.23 days
2020: (45 + 28 / 2) / 192 * 365= 69.39 days
(x)
Receivables days
Accounts receivable / Revenue * 365
2019: 65 / 440 * 365= 53.90 days
2020: 46 / 330 * 365= 50.88 days
(xi)
Payable days
Accounts payable / Cost of goods sold * 365
2019: 72 / 248 * 365= 105. 96 days
2020: 32 / 192 * 365= 60.83 days
(xii)
Interest cover
Earnings before interest and tax / Interest expense
2019: 70 / 10= 7
2020: 50 / 10= 5
(b) Comment on company performance:
6 of 15
⊘ This is a preview!⊘
Do you want full access?
Subscribe today to unlock all pages.
Trusted by 1+ million students worldwide
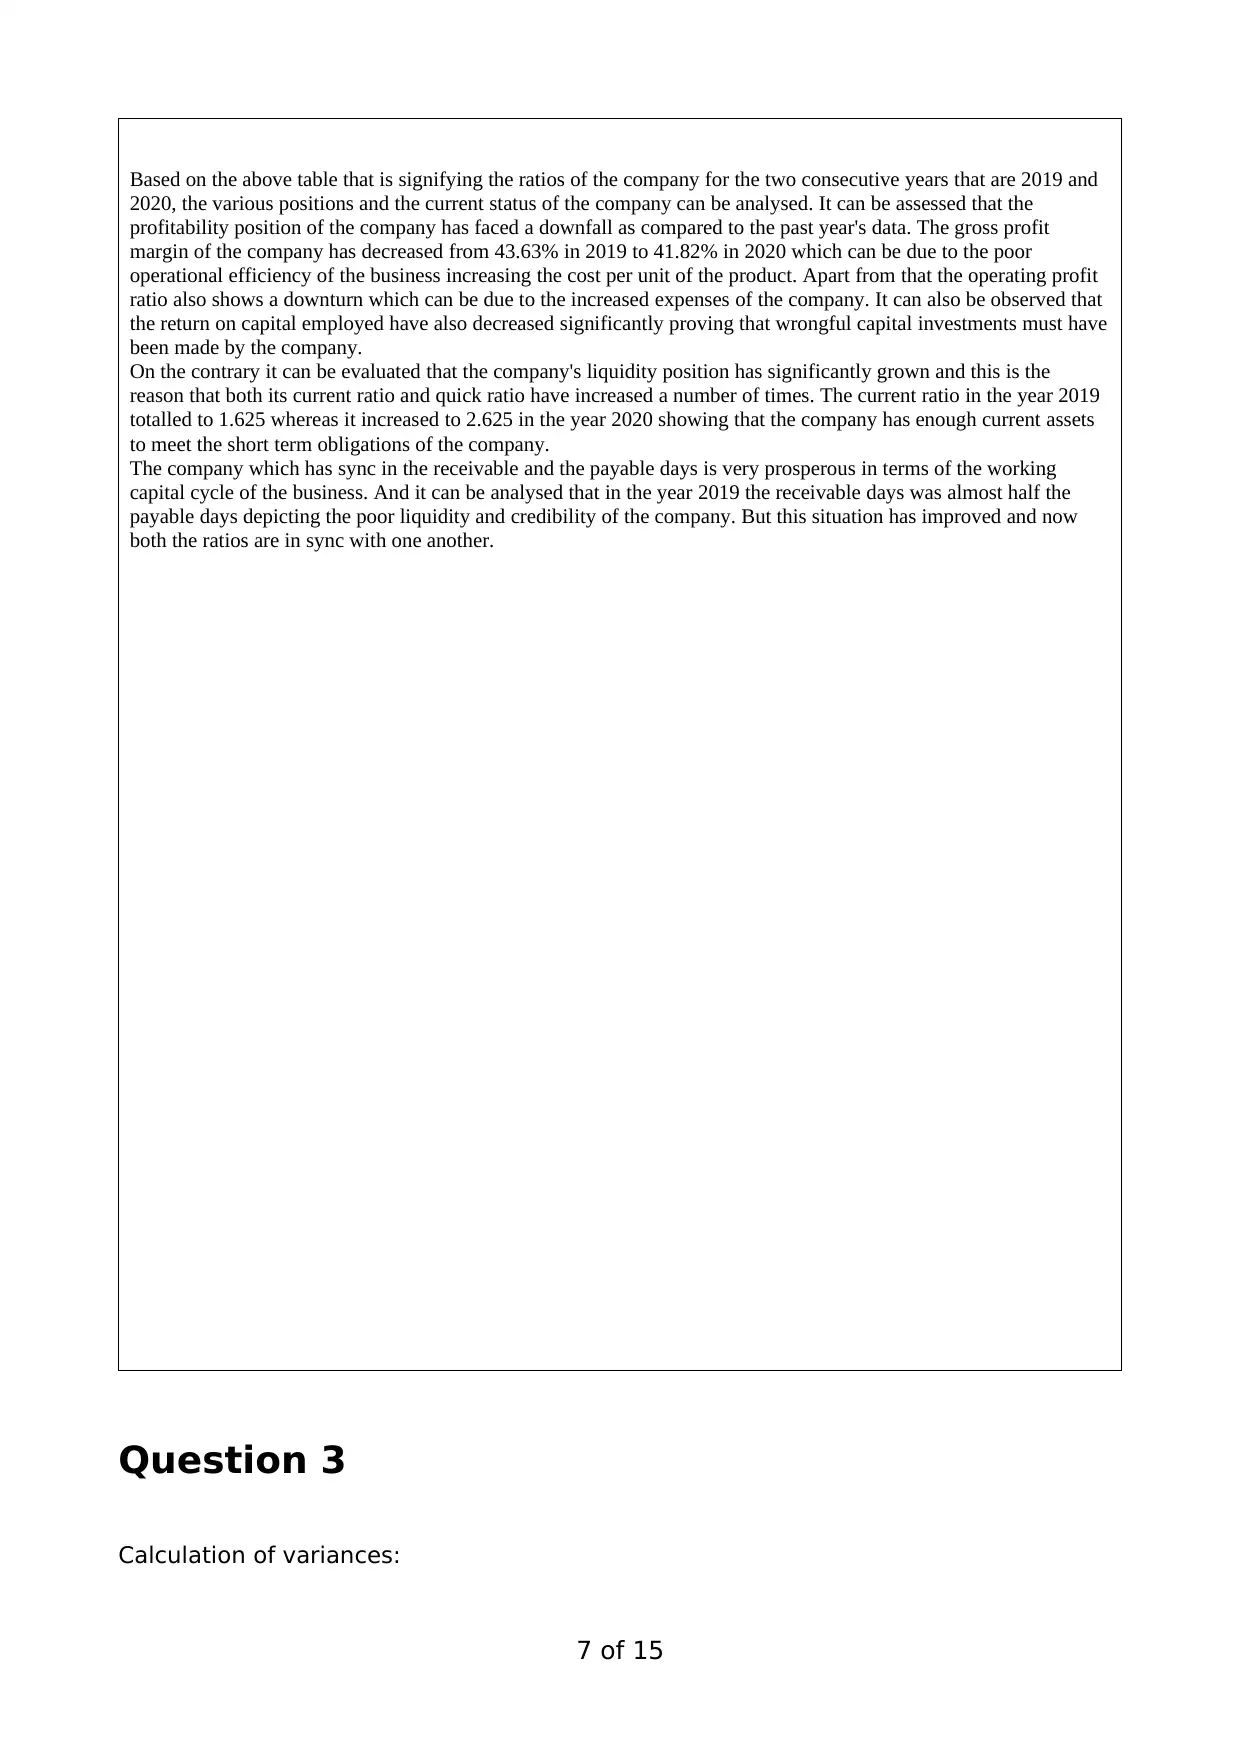
Based on the above table that is signifying the ratios of the company for the two consecutive years that are 2019 and
2020, the various positions and the current status of the company can be analysed. It can be assessed that the
profitability position of the company has faced a downfall as compared to the past year's data. The gross profit
margin of the company has decreased from 43.63% in 2019 to 41.82% in 2020 which can be due to the poor
operational efficiency of the business increasing the cost per unit of the product. Apart from that the operating profit
ratio also shows a downturn which can be due to the increased expenses of the company. It can also be observed that
the return on capital employed have also decreased significantly proving that wrongful capital investments must have
been made by the company.
On the contrary it can be evaluated that the company's liquidity position has significantly grown and this is the
reason that both its current ratio and quick ratio have increased a number of times. The current ratio in the year 2019
totalled to 1.625 whereas it increased to 2.625 in the year 2020 showing that the company has enough current assets
to meet the short term obligations of the company.
The company which has sync in the receivable and the payable days is very prosperous in terms of the working
capital cycle of the business. And it can be analysed that in the year 2019 the receivable days was almost half the
payable days depicting the poor liquidity and credibility of the company. But this situation has improved and now
both the ratios are in sync with one another.
Question 3
Calculation of variances:
7 of 15
Paraphrase This Document
Need a fresh take? Get an instant paraphrase of this document with our AI Paraphraser
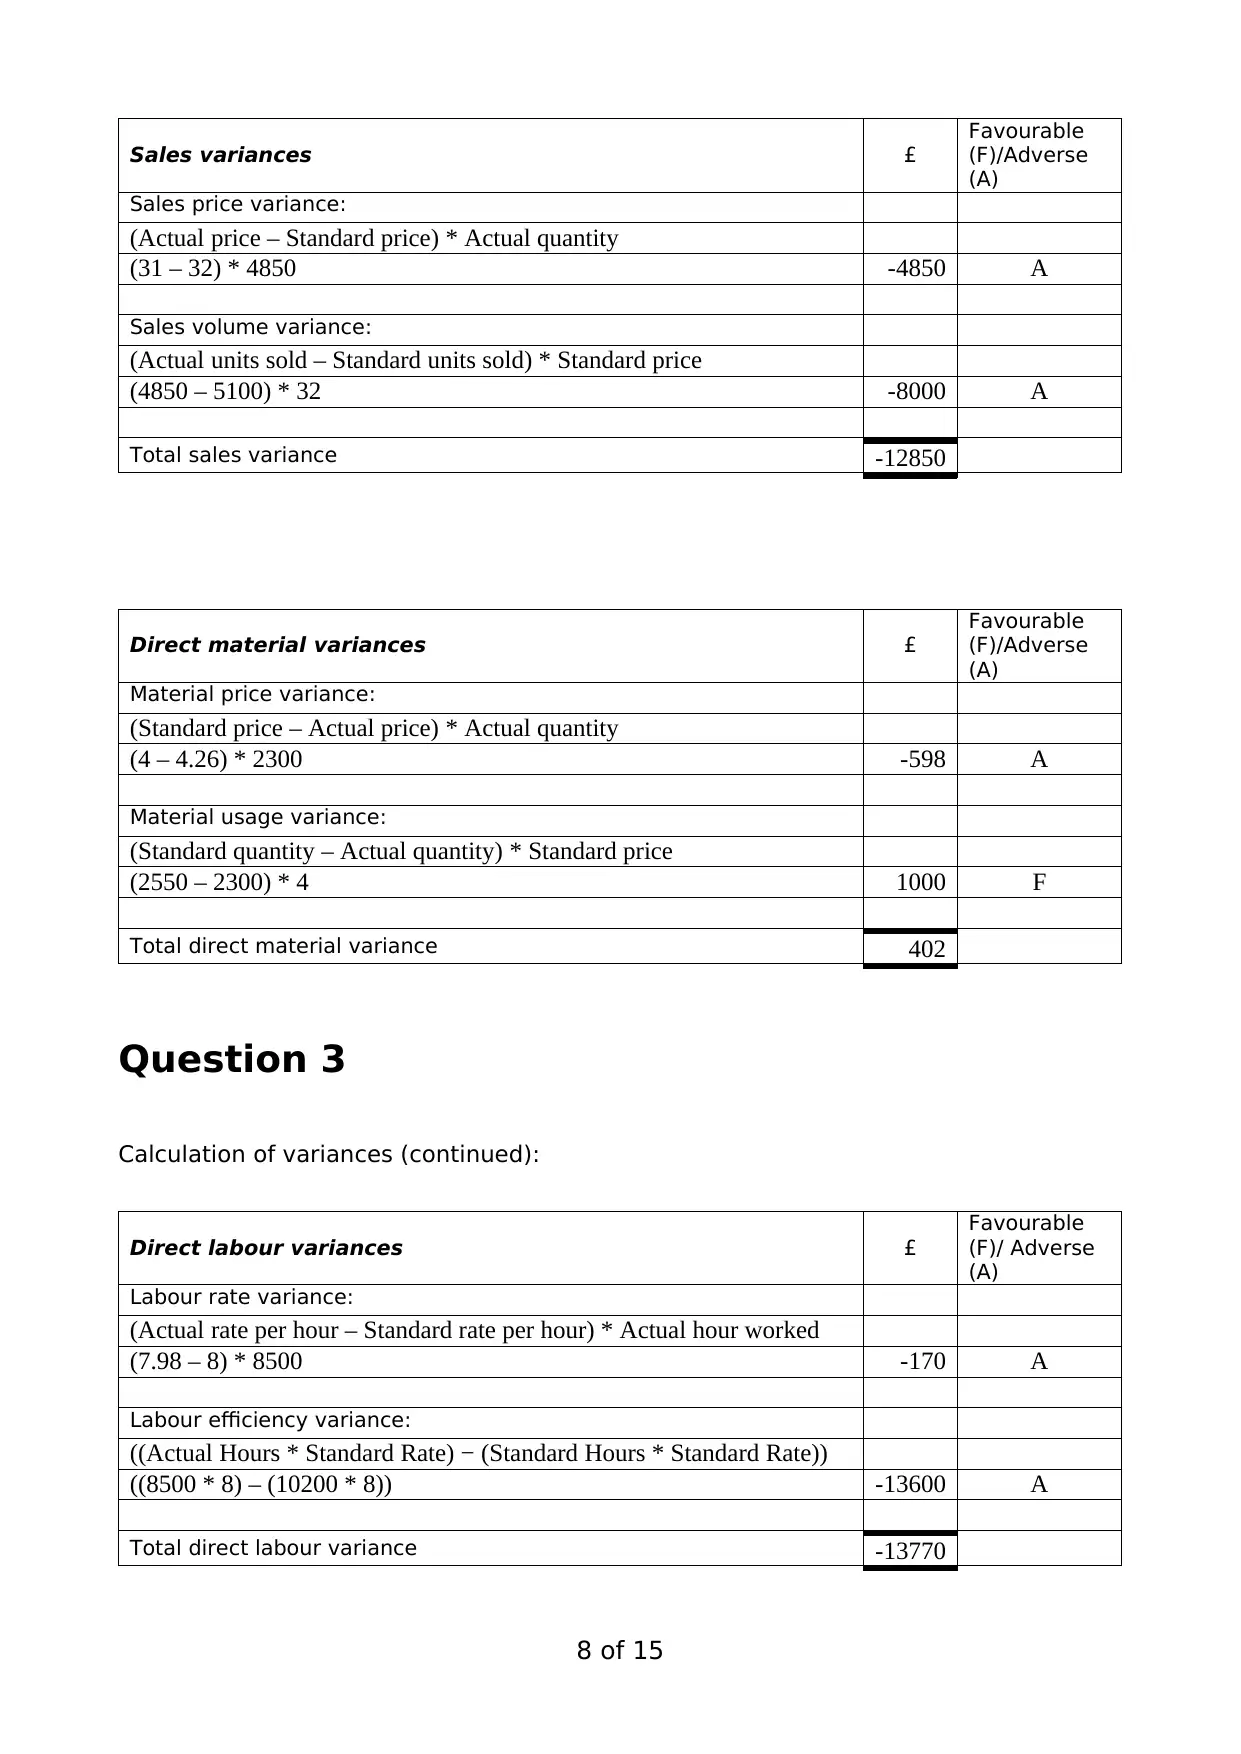
Sales variances £
Favourable
(F)/Adverse
(A)
Sales price variance:
(Actual price – Standard price) * Actual quantity
(31 – 32) * 4850 -4850 A
Sales volume variance:
(Actual units sold – Standard units sold) * Standard price
(4850 – 5100) * 32 -8000 A
Total sales variance -12850
Direct material variances £
Favourable
(F)/Adverse
(A)
Material price variance:
(Standard price – Actual price) * Actual quantity
(4 – 4.26) * 2300 -598 A
Material usage variance:
(Standard quantity – Actual quantity) * Standard price
(2550 – 2300) * 4 1000 F
Total direct material variance 402
Question 3
Calculation of variances (continued):
Direct labour variances £
Favourable
(F)/ Adverse
(A)
Labour rate variance:
(Actual rate per hour – Standard rate per hour) * Actual hour worked
(7.98 – 8) * 8500 -170 A
Labour efficiency variance:
((Actual Hours * Standard Rate) − (Standard Hours * Standard Rate))
((8500 * 8) – (10200 * 8)) -13600 A
Total direct labour variance -13770
8 of 15
Favourable
(F)/Adverse
(A)
Sales price variance:
(Actual price – Standard price) * Actual quantity
(31 – 32) * 4850 -4850 A
Sales volume variance:
(Actual units sold – Standard units sold) * Standard price
(4850 – 5100) * 32 -8000 A
Total sales variance -12850
Direct material variances £
Favourable
(F)/Adverse
(A)
Material price variance:
(Standard price – Actual price) * Actual quantity
(4 – 4.26) * 2300 -598 A
Material usage variance:
(Standard quantity – Actual quantity) * Standard price
(2550 – 2300) * 4 1000 F
Total direct material variance 402
Question 3
Calculation of variances (continued):
Direct labour variances £
Favourable
(F)/ Adverse
(A)
Labour rate variance:
(Actual rate per hour – Standard rate per hour) * Actual hour worked
(7.98 – 8) * 8500 -170 A
Labour efficiency variance:
((Actual Hours * Standard Rate) − (Standard Hours * Standard Rate))
((8500 * 8) – (10200 * 8)) -13600 A
Total direct labour variance -13770
8 of 15
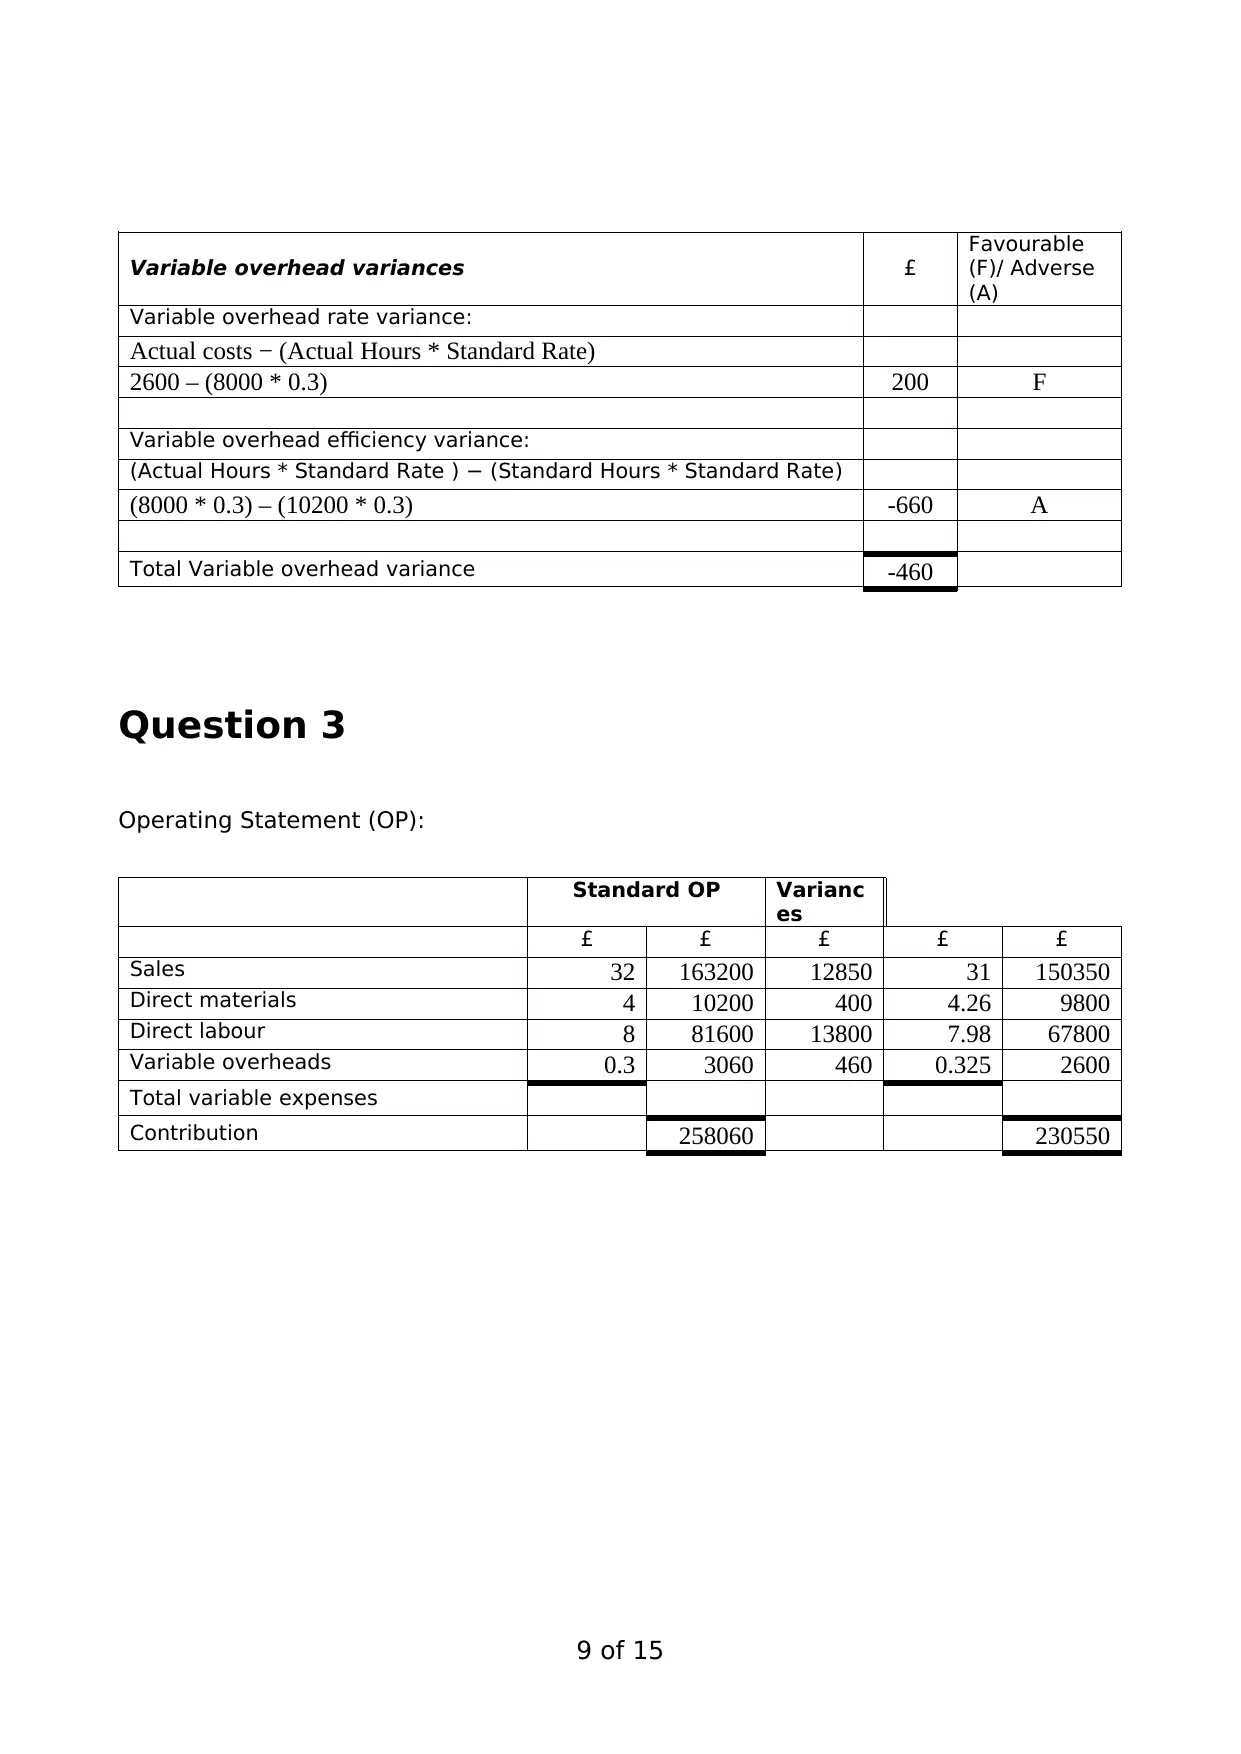
Variable overhead variances £
Favourable
(F)/ Adverse
(A)
Variable overhead rate variance:
Actual costs − (Actual Hours * Standard Rate)
2600 – (8000 * 0.3) 200 F
Variable overhead efficiency variance:
(Actual Hours * Standard Rate ) − (Standard Hours * Standard Rate)
(8000 * 0.3) – (10200 * 0.3) -660 A
Total Variable overhead variance -460
Question 3
Operating Statement (OP):
Standard OP Varianc
es
£ £ £ £ £
Sales 32 163200 12850 31 150350
Direct materials 4 10200 400 4.26 9800
Direct labour 8 81600 13800 7.98 67800
Variable overheads 0.3 3060 460 0.325 2600
Total variable expenses
Contribution 258060 230550
9 of 15
⊘ This is a preview!⊘
Do you want full access?
Subscribe today to unlock all pages.
Trusted by 1+ million students worldwide
Question 4
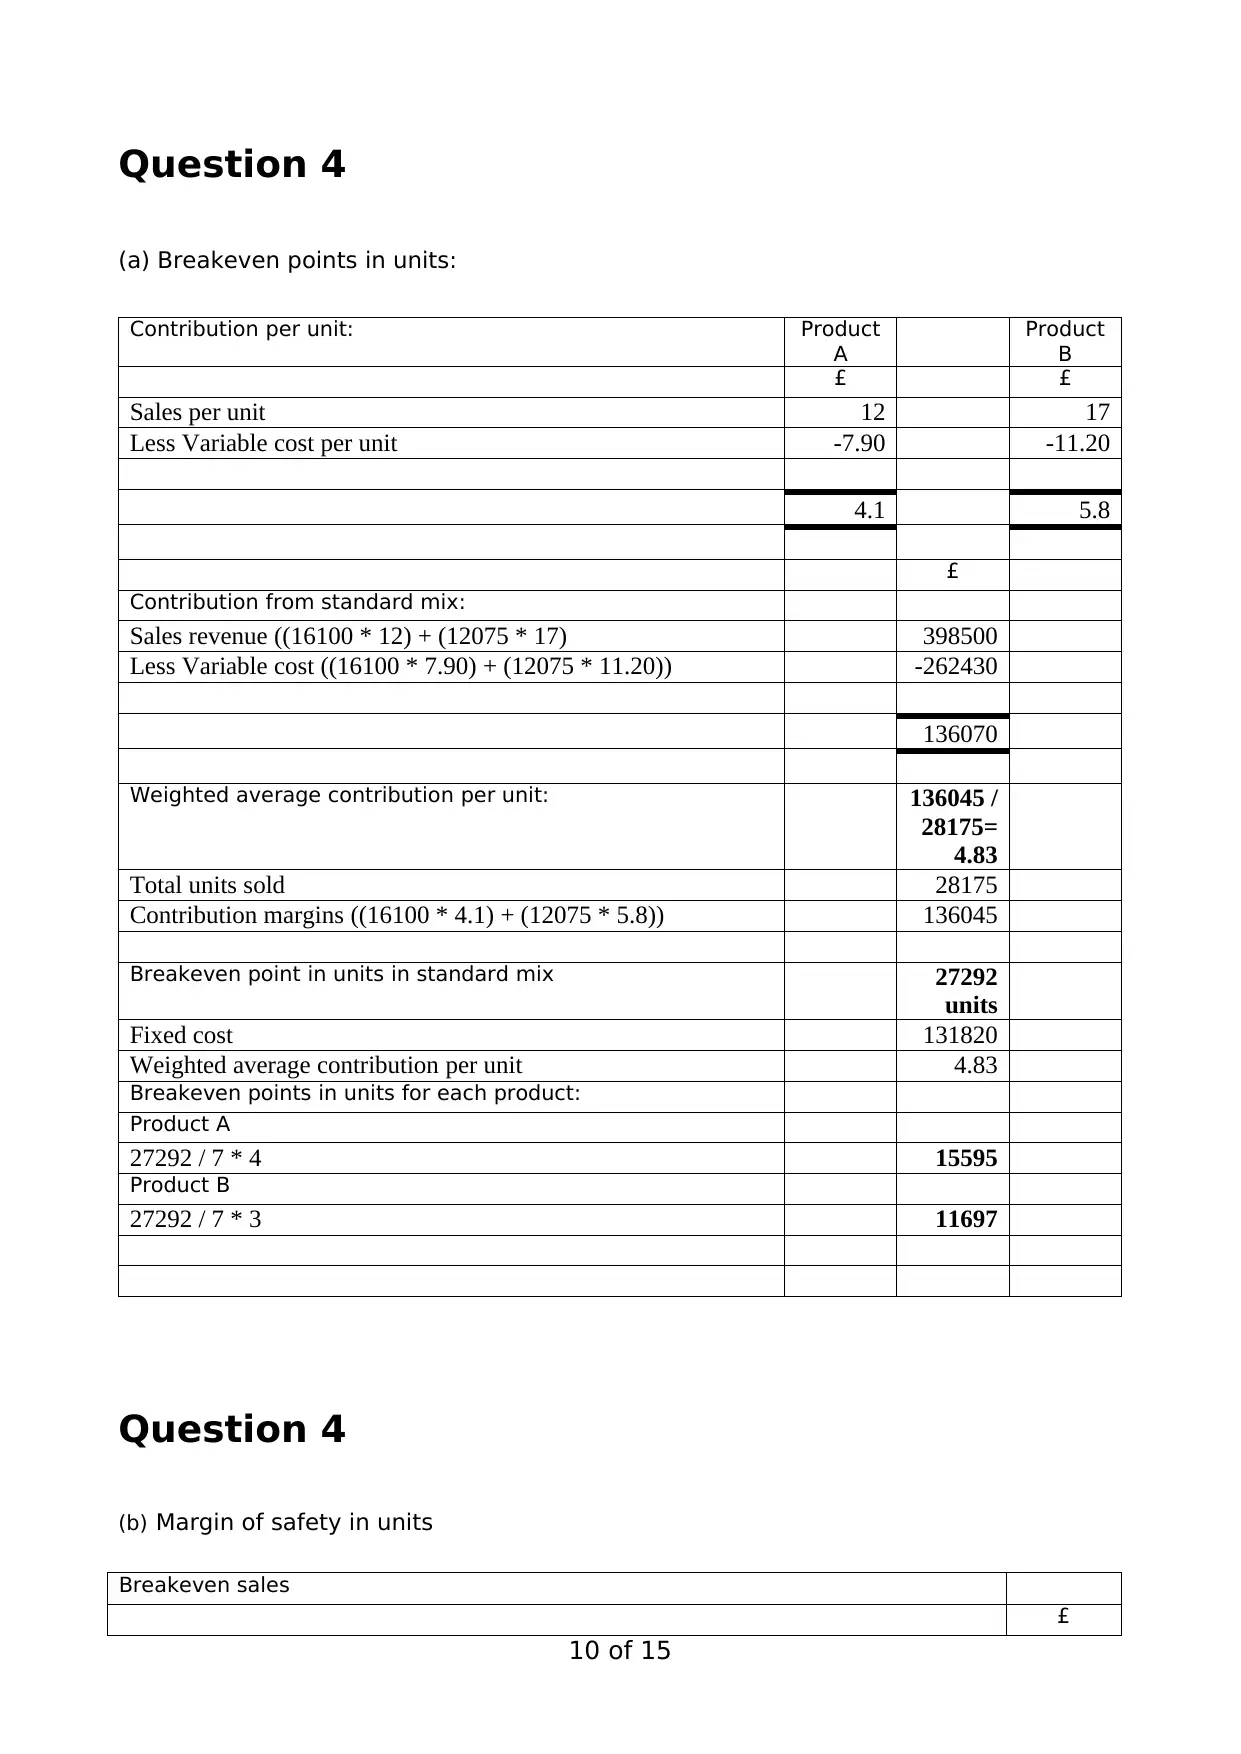
(a) Breakeven points in units:
Contribution per unit: Product
A
Product
B
£ £
Sales per unit 12 17
Less Variable cost per unit -7.90 -11.20
4.1 5.8
£
Contribution from standard mix:
Sales revenue ((16100 * 12) + (12075 * 17) 398500
Less Variable cost ((16100 * 7.90) + (12075 * 11.20)) -262430
136070
Weighted average contribution per unit: 136045 /
28175=
4.83
Total units sold 28175
Contribution margins ((16100 * 4.1) + (12075 * 5.8)) 136045
Breakeven point in units in standard mix 27292
units
Fixed cost 131820
Weighted average contribution per unit 4.83
Breakeven points in units for each product:
Product A
27292 / 7 * 4 15595
Product B
27292 / 7 * 3 11697
Question 4
(b) Margin of safety in units
Breakeven sales
£
10 of 15
Paraphrase This Document
Need a fresh take? Get an instant paraphrase of this document with our AI Paraphraser
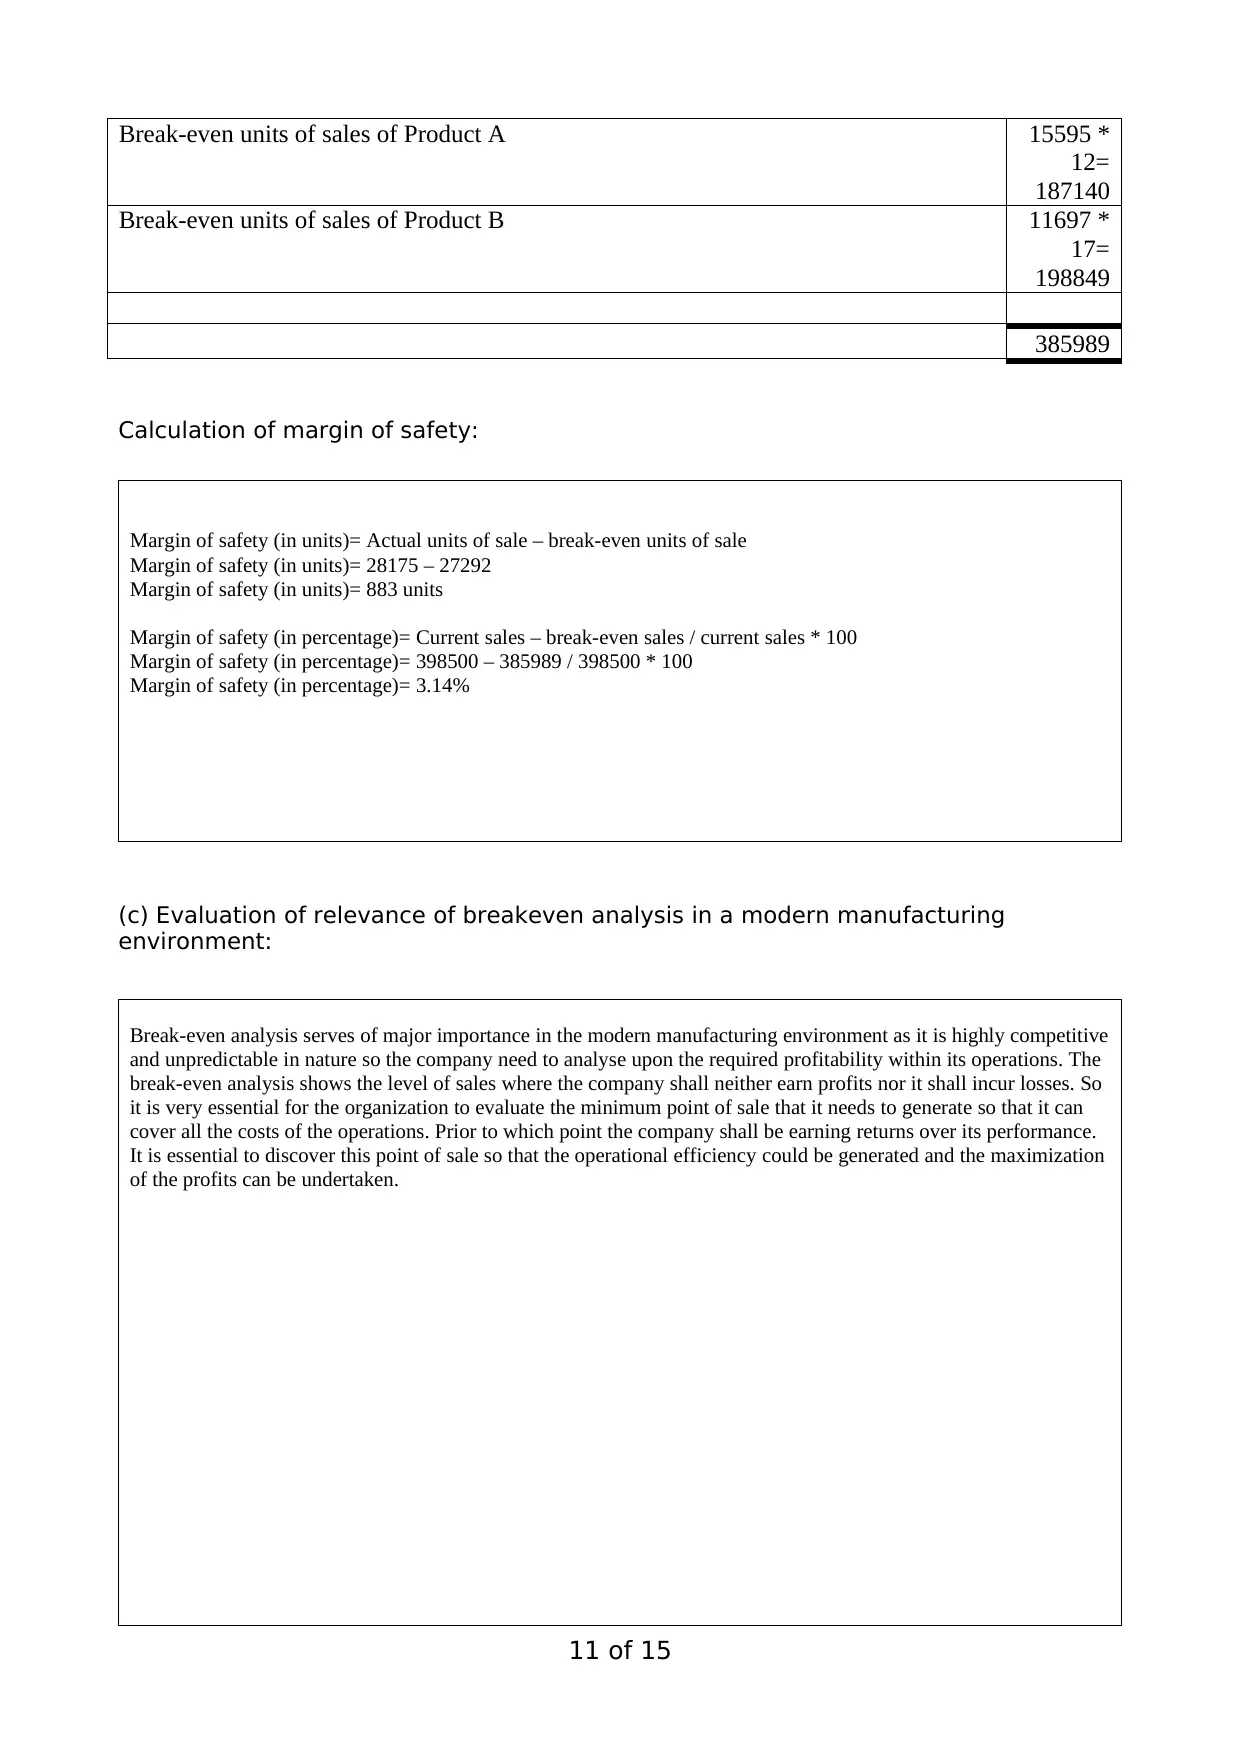
Break-even units of sales of Product A 15595 *
12=
187140
Break-even units of sales of Product B 11697 *
17=
198849
385989
Calculation of margin of safety:
Margin of safety (in units)= Actual units of sale – break-even units of sale
Margin of safety (in units)= 28175 – 27292
Margin of safety (in units)= 883 units
Margin of safety (in percentage)= Current sales – break-even sales / current sales * 100
Margin of safety (in percentage)= 398500 – 385989 / 398500 * 100
Margin of safety (in percentage)= 3.14%
(c) Evaluation of relevance of breakeven analysis in a modern manufacturing
environment:
Break-even analysis serves of major importance in the modern manufacturing environment as it is highly competitive
and unpredictable in nature so the company need to analyse upon the required profitability within its operations. The
break-even analysis shows the level of sales where the company shall neither earn profits nor it shall incur losses. So
it is very essential for the organization to evaluate the minimum point of sale that it needs to generate so that it can
cover all the costs of the operations. Prior to which point the company shall be earning returns over its performance.
It is essential to discover this point of sale so that the operational efficiency could be generated and the maximization
of the profits can be undertaken.
11 of 15

12 of 15
⊘ This is a preview!⊘
Do you want full access?
Subscribe today to unlock all pages.
Trusted by 1+ million students worldwide
1 out of 15
Related Documents


Your All-in-One AI-Powered Toolkit for Academic Success.
+13062052269
info@desklib.com
Available 24*7 on WhatsApp / Email
![[object Object]](/_next/static/media/star-bottom.7253800d.svg)
Unlock your academic potential
Copyright © 2020–2026 A2Z Services. All Rights Reserved. Developed and managed by ZUCOL.