Financial Management Assignment: Investment and Portfolio Analysis

Verified

Added on  2022/09/08

|11
|2237
|17
Homework Assignment
AI Summary
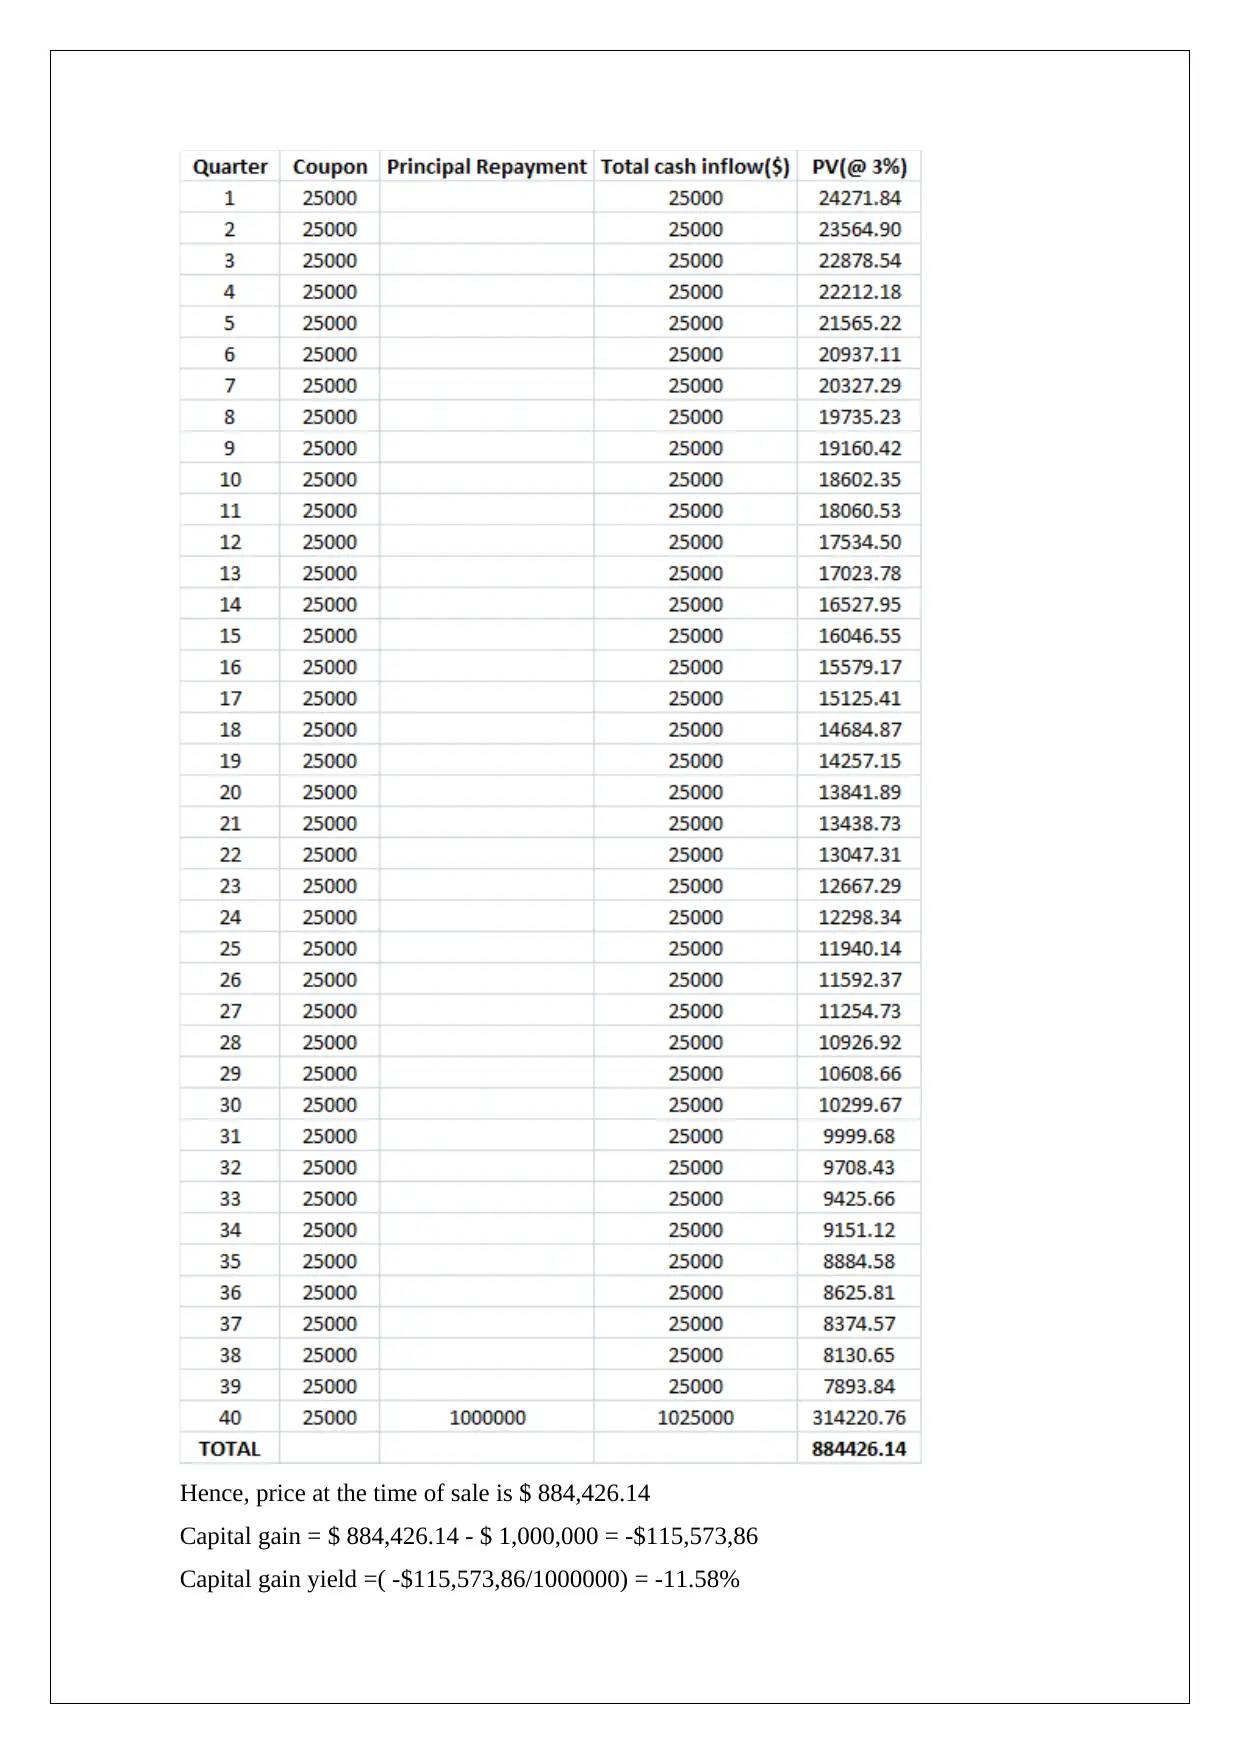
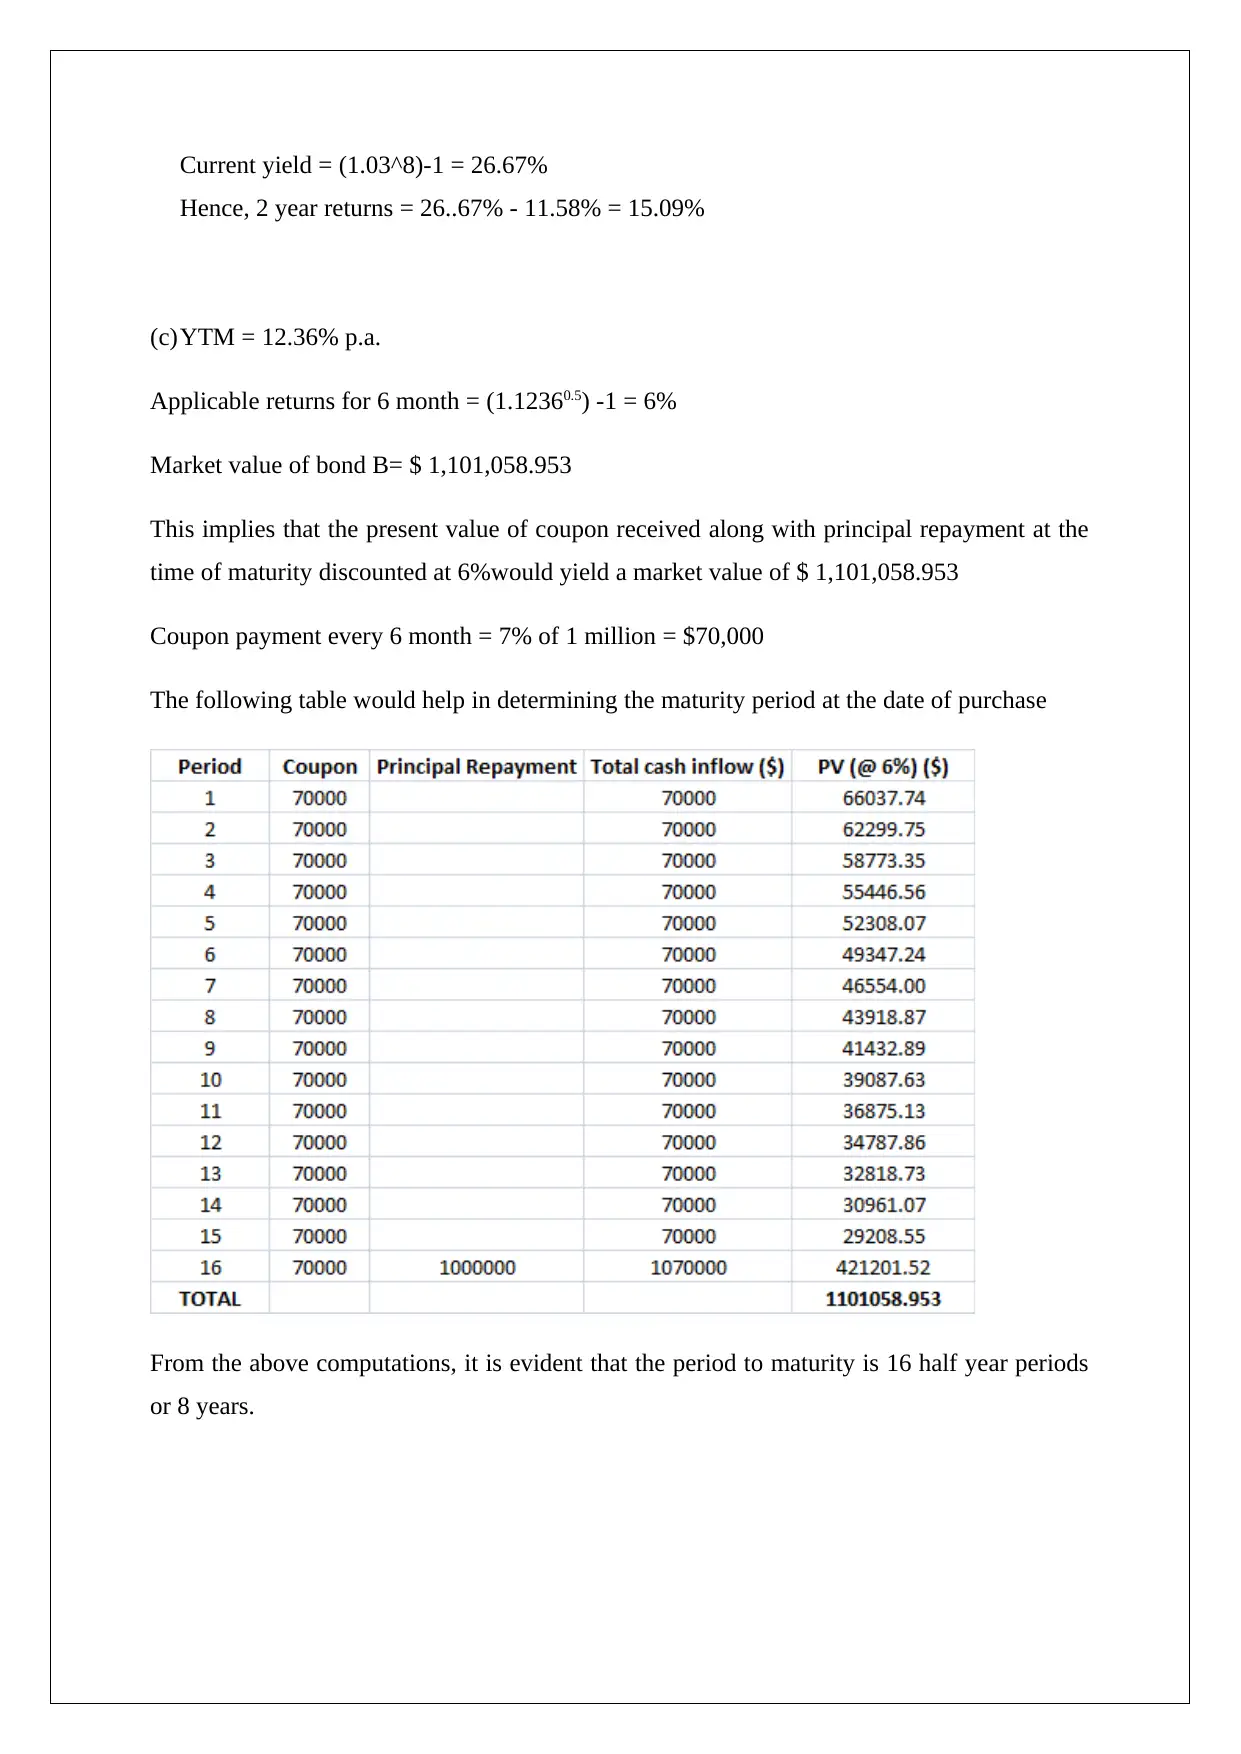
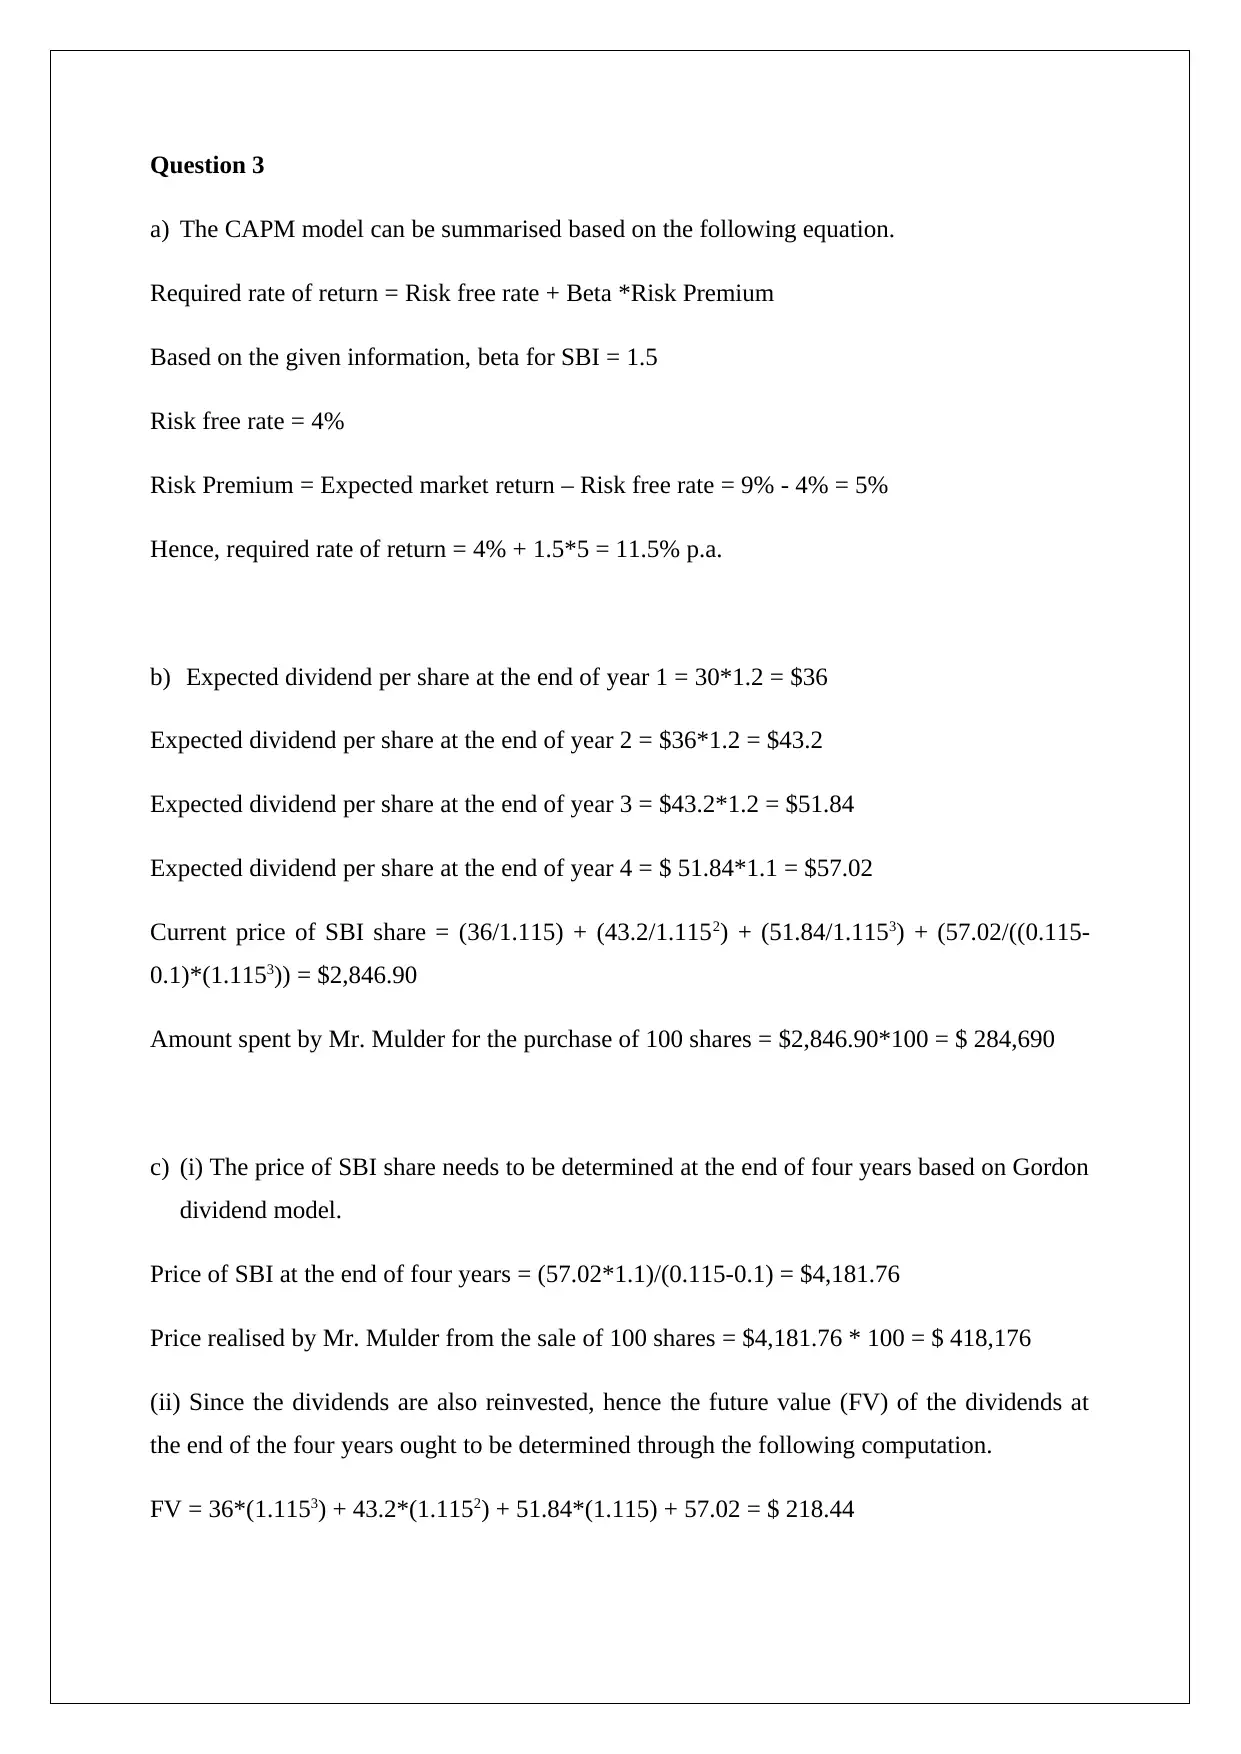
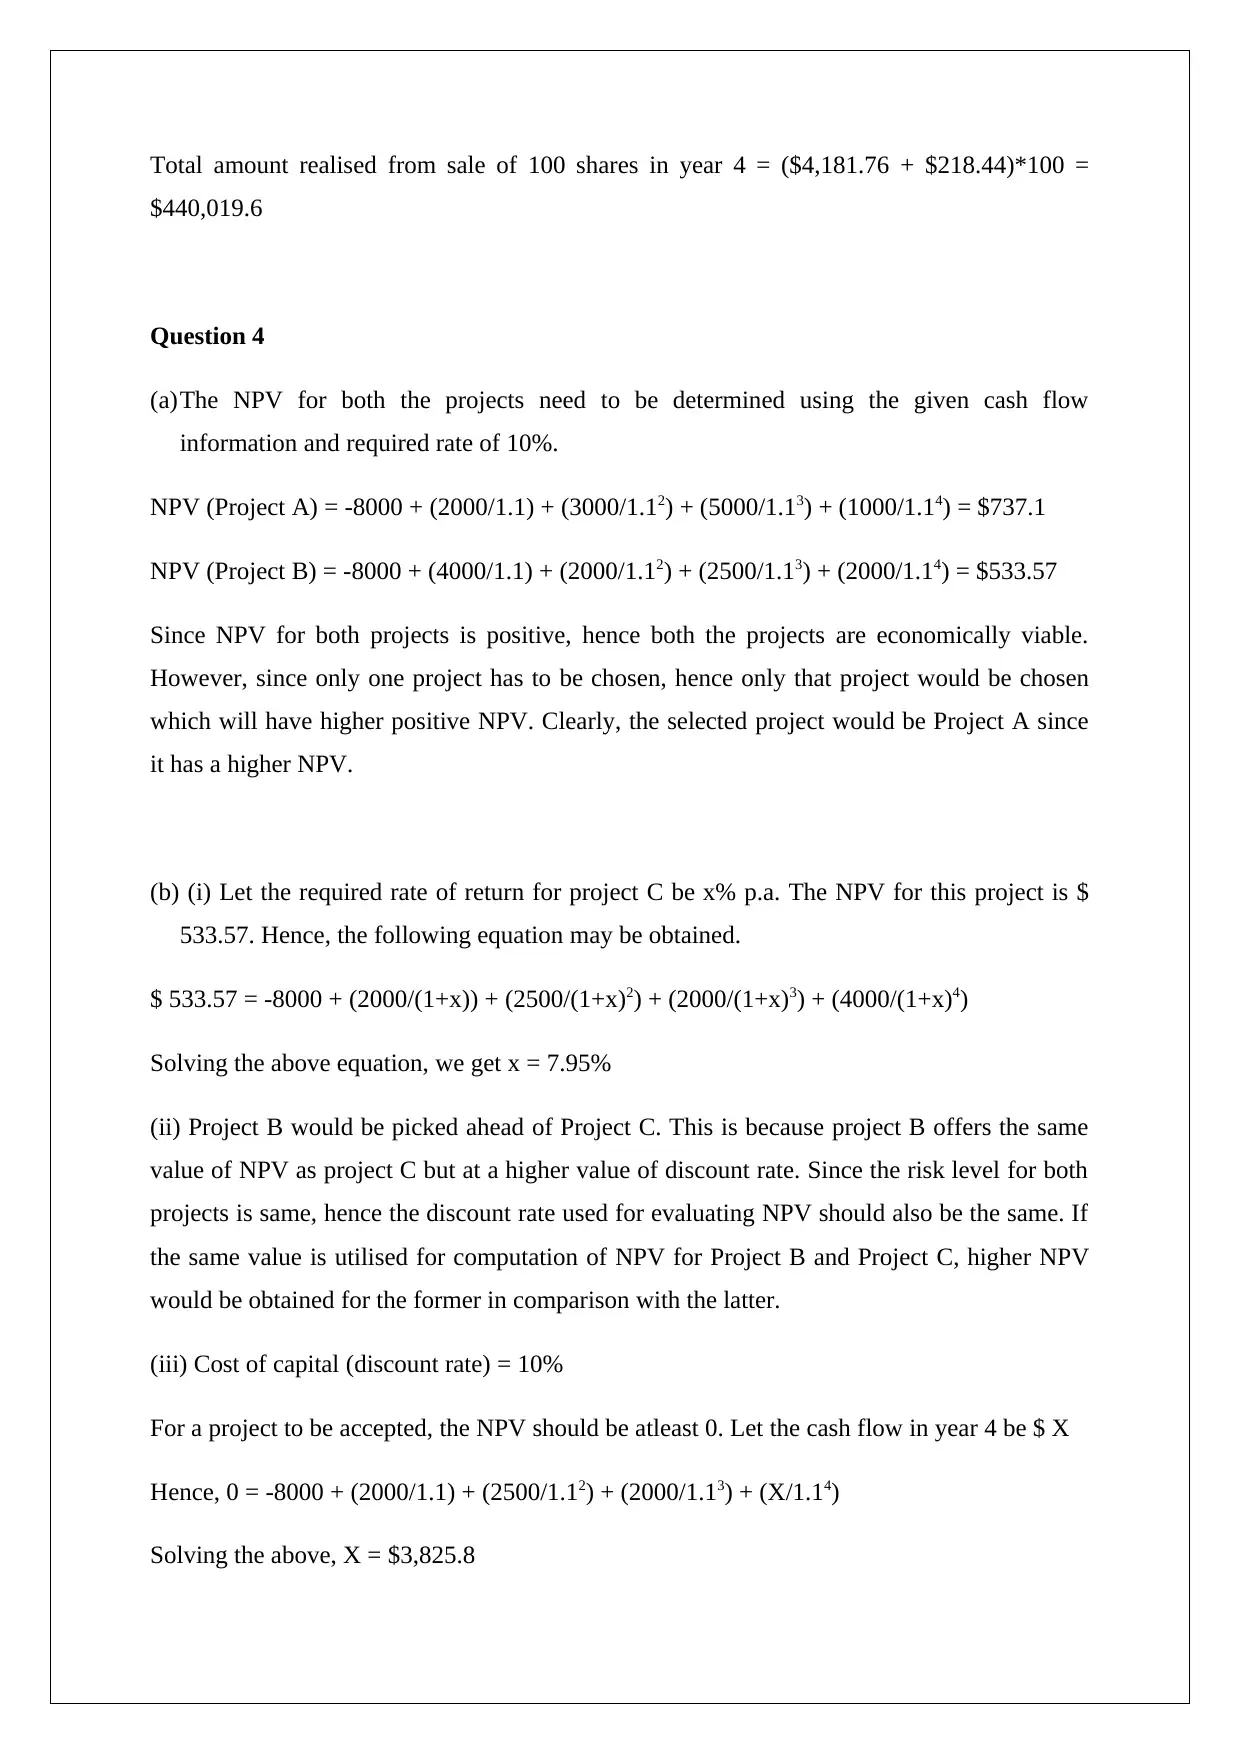
This document presents a comprehensive solution to a financial management assignment, addressing key concepts such as bond valuation, stock analysis, and capital budgeting. The solution begins with a detailed analysis of interest rates and effective annual rates, followed by bond valuation using yield to maturity and coupon rates. The assignment then delves into the Capital Asset Pricing Model (CAPM) to determine the required rate of return for stocks, incorporating dividend growth models for stock valuation. Further, the Net Present Value (NPV) method is applied to evaluate project viability, comparing different investment projects. The document also explores the payback period for projects and concludes with a discussion on portfolio diversification and systematic versus unsystematic risk, providing a well-rounded understanding of financial management principles.
Document Page
FINANCIAL MANAGEMENT
STUDENT ID:
[Pick the date]
tabler-icon-diamond-filled.svg

Secure Best Marks with AI Grader

Need help grading? Try our AI Grader for instant feedback on your assignments.
Document Page
Question 1
(a)The given phrase implies that for every $ 4 borrowed by the customer, $ 5 would need to
be paid after a week.
Hence, principal borrowed = $ 4
Amount returned after one week = $ 5
Thus, interest earned = $ 5-$4 = $ 1
Rate of interest = (1/4)*100 = 25% per week
(b)Effective annual rate of interest considering 52 weeks in a year =( (1.25)52-1)*100 =
10947544.25%
(c)(i) Principal borrowed = $ 10,000
Amount to be paid after 1 year = 10000*(1+10947544.25%) = $ 1,094,754,425
Interest charged = $ 1,094,754,425 - $ 10,000 = $ 1,094,744,425
(ii) Weekly interest on $ 10000 loan = (1/4)*(10000) = $ 2,500
Total interest payment in 52 weeks = 2500*52 = $ 130,000
(iii) Since in a year, there are 52 weeks given, hence 52 weekly payments would need to be
made.
Amount of weekly payment = 1,094,754,425 *0.25*1.2552/(1.2552-1) = $273,691,106
Since payment is starting today, hence weekly payment = ($273,691,106/1.25) = $
218,952,885
Total amount paid in 52 weeks = $ 218,952,885 * 52 = $ 11,385,550,023
Amount of interest paid during the year = $ 11,385,550,023 - $ 1,094,754,425 =
$10,290,795,597
Document Page
Question 2
(a)Since Bond B is issued at the par value, hence the annualised coupon rate would be YTM
for this bond.
Annualised coupon yield on bond B = [(1.072)-1]*100 = 14.49%
Bond A par value = $ 1 million
Annual coupon on this bond = 10% of 1 million = $ 100,000
Time of maturity = July 1, 2025 – July 1, 2011 = 14 years
The price of Bond A as on July 1, 2011 would be the present value of all future cash inflows.
This is shown below.
Hence, bond A value as on July 1, 2011 is $ 736,736.09.
(b)Bond C price needs to be determined on January 1, 2014 and also on January 1, 2016. The
YTM on both dates have been given. Based on this, the price of the bond may be
determined.
Price determination of January 1,2014
EAR = 10.3812891%
Document Page
Relevant discount rate per quarter since coupon payments are carried out quarterly =
(1.103812891)^0.25 -1 = 2.5%
Since this is the same as coupon rate of 2.5% per quarter, hence the price would be same
as face value of $ 1 million.
Price determination of January 1,2016
EAR = 12.550881%
Relevant discount rate per quarter since coupon payments are carried out quarterly =
(1.12550881)^0.25 -1 = 3%
The market price of the bond can be determined based on the following computation.
tabler-icon-diamond-filled.svg

Secure Best Marks with AI Grader

Need help grading? Try our AI Grader for instant feedback on your assignments.
Document Page
Hence, price at the time of sale is $ 884,426.14
Capital gain = $ 884,426.14 - $ 1,000,000 = -$115,573,86
Capital gain yield =( -$115,573,86/1000000) = -11.58%
Document Page
Current yield = (1.03^8)-1 = 26.67%
Hence, 2 year returns = 26..67% - 11.58% = 15.09%
(c)YTM = 12.36% p.a.
Applicable returns for 6 month = (1.12360.5) -1 = 6%
Market value of bond B= $ 1,101,058.953
This implies that the present value of coupon received along with principal repayment at the
time of maturity discounted at 6%would yield a market value of $ 1,101,058.953
Coupon payment every 6 month = 7% of 1 million = $70,000
The following table would help in determining the maturity period at the date of purchase
From the above computations, it is evident that the period to maturity is 16 half year periods
or 8 years.
Document Page
Question 3
a) The CAPM model can be summarised based on the following equation.
Required rate of return = Risk free rate + Beta *Risk Premium
Based on the given information, beta for SBI = 1.5
Risk free rate = 4%
Risk Premium = Expected market return – Risk free rate = 9% - 4% = 5%
Hence, required rate of return = 4% + 1.5*5 = 11.5% p.a.
b) Expected dividend per share at the end of year 1 = 30*1.2 = $36
Expected dividend per share at the end of year 2 = $36*1.2 = $43.2
Expected dividend per share at the end of year 3 = $43.2*1.2 = $51.84
Expected dividend per share at the end of year 4 = $ 51.84*1.1 = $57.02
Current price of SBI share = (36/1.115) + (43.2/1.1152) + (51.84/1.1153) + (57.02/((0.115-
0.1)*(1.1153)) = $2,846.90
Amount spent by Mr. Mulder for the purchase of 100 shares = $2,846.90*100 = $ 284,690
c) (i) The price of SBI share needs to be determined at the end of four years based on Gordon
dividend model.
Price of SBI at the end of four years = (57.02*1.1)/(0.115-0.1) = $4,181.76
Price realised by Mr. Mulder from the sale of 100 shares = $4,181.76 * 100 = $ 418,176
(ii) Since the dividends are also reinvested, hence the future value (FV) of the dividends at
the end of the four years ought to be determined through the following computation.
FV = 36*(1.1153) + 43.2*(1.1152) + 51.84*(1.115) + 57.02 = $ 218.44
tabler-icon-diamond-filled.svg

Paraphrase This Document

Need a fresh take? Get an instant paraphrase of this document with our AI Paraphraser
Document Page
Total amount realised from sale of 100 shares in year 4 = ($4,181.76 + $218.44)*100 =
$440,019.6
Question 4
(a)The NPV for both the projects need to be determined using the given cash flow
information and required rate of 10%.
NPV (Project A) = -8000 + (2000/1.1) + (3000/1.12) + (5000/1.13) + (1000/1.14) = $737.1
NPV (Project B) = -8000 + (4000/1.1) + (2000/1.12) + (2500/1.13) + (2000/1.14) = $533.57
Since NPV for both projects is positive, hence both the projects are economically viable.
However, since only one project has to be chosen, hence only that project would be chosen
which will have higher positive NPV. Clearly, the selected project would be Project A since
it has a higher NPV.
(b) (i) Let the required rate of return for project C be x% p.a. The NPV for this project is $
533.57. Hence, the following equation may be obtained.
$ 533.57 = -8000 + (2000/(1+x)) + (2500/(1+x)2) + (2000/(1+x)3) + (4000/(1+x)4)
Solving the above equation, we get x = 7.95%
(ii) Project B would be picked ahead of Project C. This is because project B offers the same
value of NPV as project C but at a higher value of discount rate. Since the risk level for both
projects is same, hence the discount rate used for evaluating NPV should also be the same. If
the same value is utilised for computation of NPV for Project B and Project C, higher NPV
would be obtained for the former in comparison with the latter.
(iii) Cost of capital (discount rate) = 10%
For a project to be accepted, the NPV should be atleast 0. Let the cash flow in year 4 be $ X
Hence, 0 = -8000 + (2000/1.1) + (2500/1.12) + (2000/1.13) + (X/1.14)
Solving the above, X = $3,825.8
Document Page
(iv)The payback period for Project B and Project C need to be determined based on which
decision needs to be taken in context of acceptance or rejection.
Payback period for Project B
Initial investment = $ 8,000
Cash inflows during the first two years = $4000 + $2000 = $ 6,000
Remaining amount to be recovered = $8,000 - $6,000 = $ 2,000
Time to recover the remaining amount in the 3rd year = (2000/2500) = 0.8
Hence, payback period = 2+0.8 = 2.8 years
Payback period for Project C
Initial investment = $ 8,000
Cash inflows during the first three years = $2000 + $2500 +$2000 = $ 6,500
Remaining amount to be recovered = $8,000 - $6,500 = $ 1,500
Time to recover the remaining amount in the 4th year = (1500/4000) = 0.375
Hence, payback period = 3+0.375 = 3.375 years
Conclusion
Only project B would be accepted based on payback method since for this project, the
payback period is less than 3 years.
(c)The IRR for project A would be positive since the NPV for project A is greater than 0.
This would imply that the IRR would be greater than the current discount rate of 10%.
This is because at IRR, the NPV is expected to be zero.
(d)The 10% rate stated in Project A and Project B essentially represent the hurdle rate which
every project needs to be overcome as to be financially viable for the given entity. This is
typically driven by the financing cost along with project risk. In evaluation of investment
decisions, this rate plays a crucial role as it may be adjusted to highlight the underlying
risk and funding cost. Adjustments would impact the NPV computation and potentially the
decision regarding execution of the underlying investment project.
Document Page
Question 5
a) For market, the beta is taken as 1
The required rate of return on market portfolio can be obtained based on CAPM model.
Expected returns on market portfolio = 3% +1*7% = 10% p.a.
Expected returns on risk free asset = 3% (Given)
Weight of risk free asset = 0.6
Weight of market portfolio = 0.4
Expected return on given portfolio = 0.6*3% + 0.4*10% =5.8% p.a.
b) (i) Required return on stock X as per CAPM = 7% + 1*8% = 15% p.a.
Required return on stock Y as per CAPM = 7% + 0.9*8% = 14.2% p.a.
Expected return on stock = [(Expected price in 1 year – Price Today + Expected dividend in 1
year)/Price Today]*100
Expected return on stock X = [(22-20+2)/20]*100 = 20%
Expected return on stock Y = [(32-30+1.78)/30]*100 = 12.6%
(ii) One should invest in stock X as the expected returns on this stock tend to exceed the
required return which implies that the stock is currently underpriced and hence potential for
upside. On the other hand, stock Y delivers lower returns than expected and hence it is likely
that it will depreciate in price and thus does not result in good investment.
c) Diversification benefits are best realised when the two stocks are dissimilar. As a result, if
the correlation between the stock returns is negative, it would yield greater diversification
benefit as a natural hedge would result in lower movements in portfolio return.
Considering this and the information provided regarding the various 2-asset portfolio, it
can be concluded that the greatest diversification benefits would be realised by Stock A &
B which has the highest negative correlation of 0.66 between the stock returns.
tabler-icon-diamond-filled.svg

Secure Best Marks with AI Grader

Need help grading? Try our AI Grader for instant feedback on your assignments.
Document Page
d) Unsystematic risk is the risk associated with a particular stock or industry. This is
essentially the result of factors which would have significant impact only on a particular
industry or company but would have limited impact on the overall market. Systematic risk
is the risk which is associated with the market as a whole and tends to hint at
macroeconomic factors which has impact potentially on all the industries and companies
to varying extent. It is possible to minimise and potentially eliminate unsystematic risk by
forming a well diversified investment portfolio. However, the same is not possible for
systematic risk which would always remain. The systematic risk for a given security is
measured through beta. With regards to investment, it is imperative to form a diversified
portfolio so that unsystematic risk can be minimised.
chevron_up_icon
1 out of 11
circle_padding
hide_on_mobile
zoom_out_icon
logo.png

Your All-in-One AI-Powered Toolkit for Academic Success.

Available 24*7 on WhatsApp / Email

[object Object]