Financial Analysis of Investment and Portfolio Management Strategies
VerifiedAdded on 2020/02/24
|7
|992
|33
Homework Assignment
AI Summary
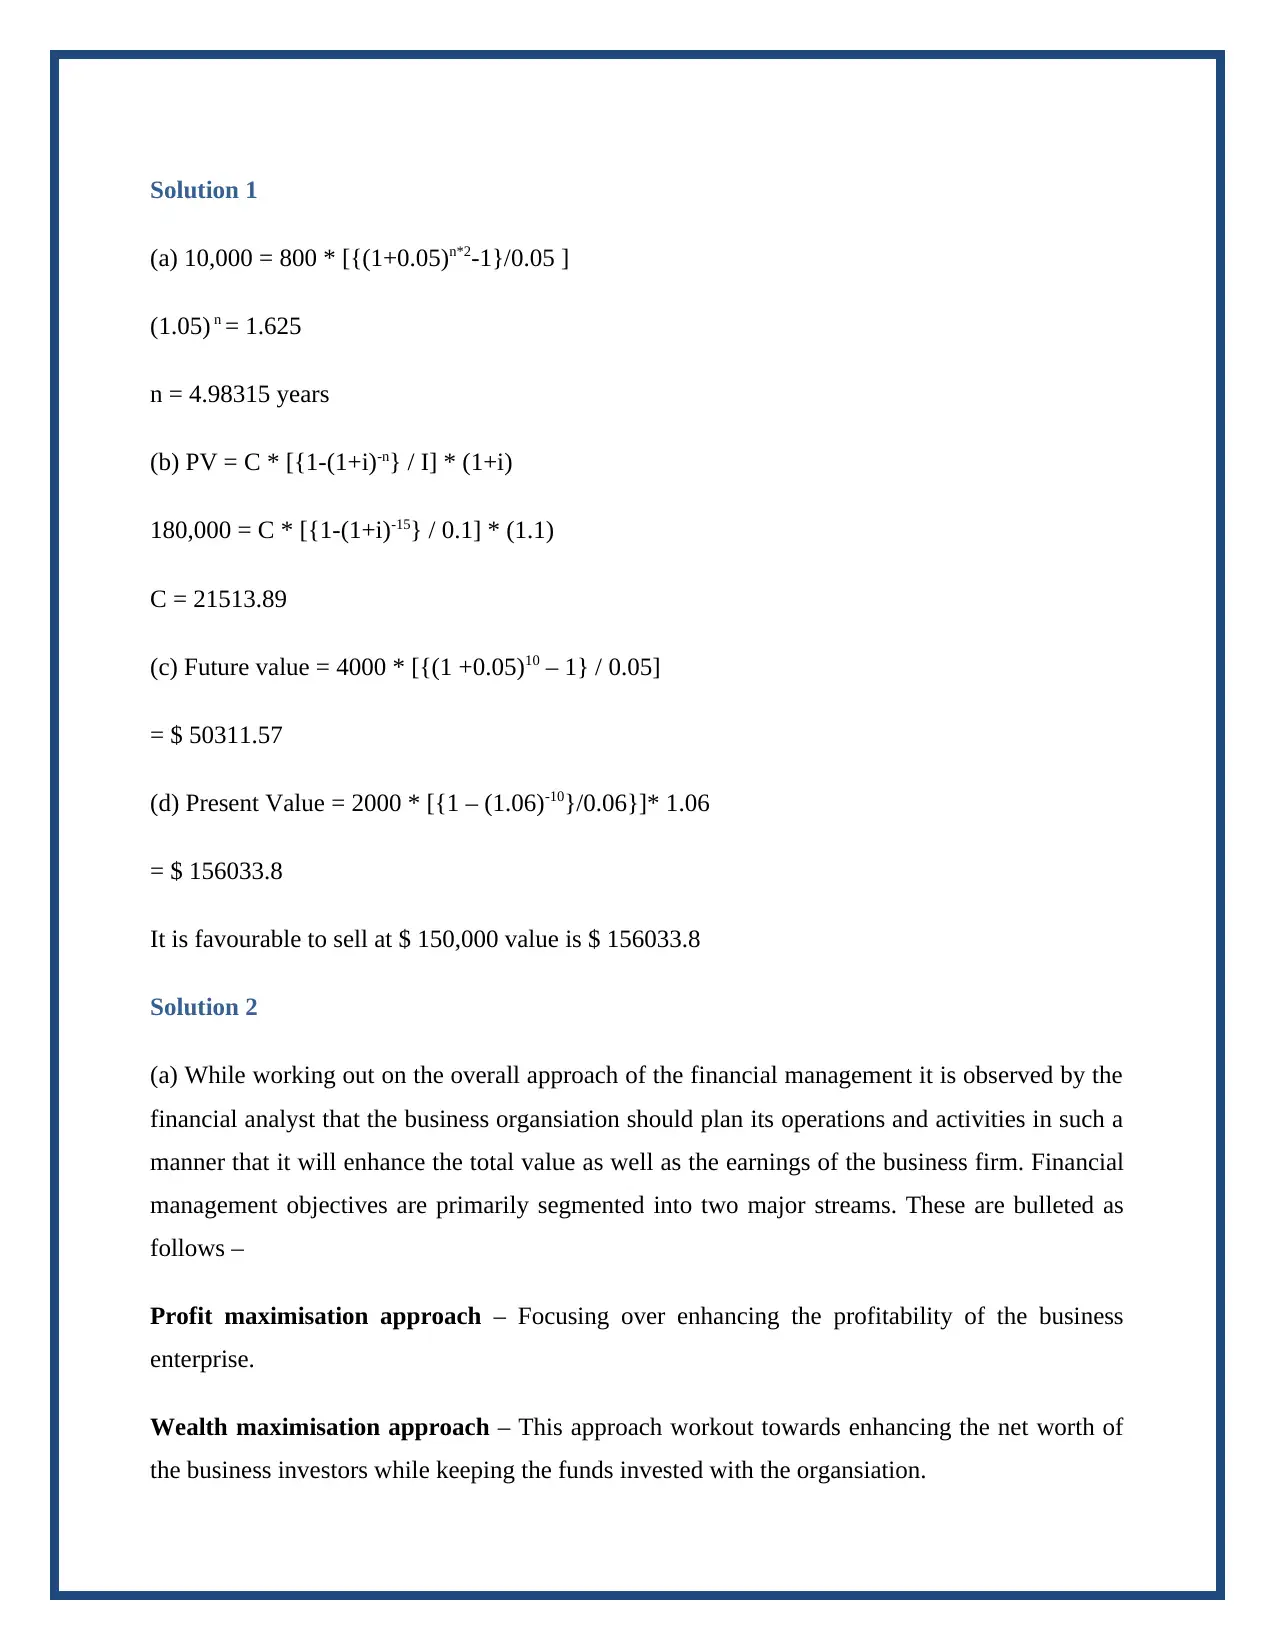
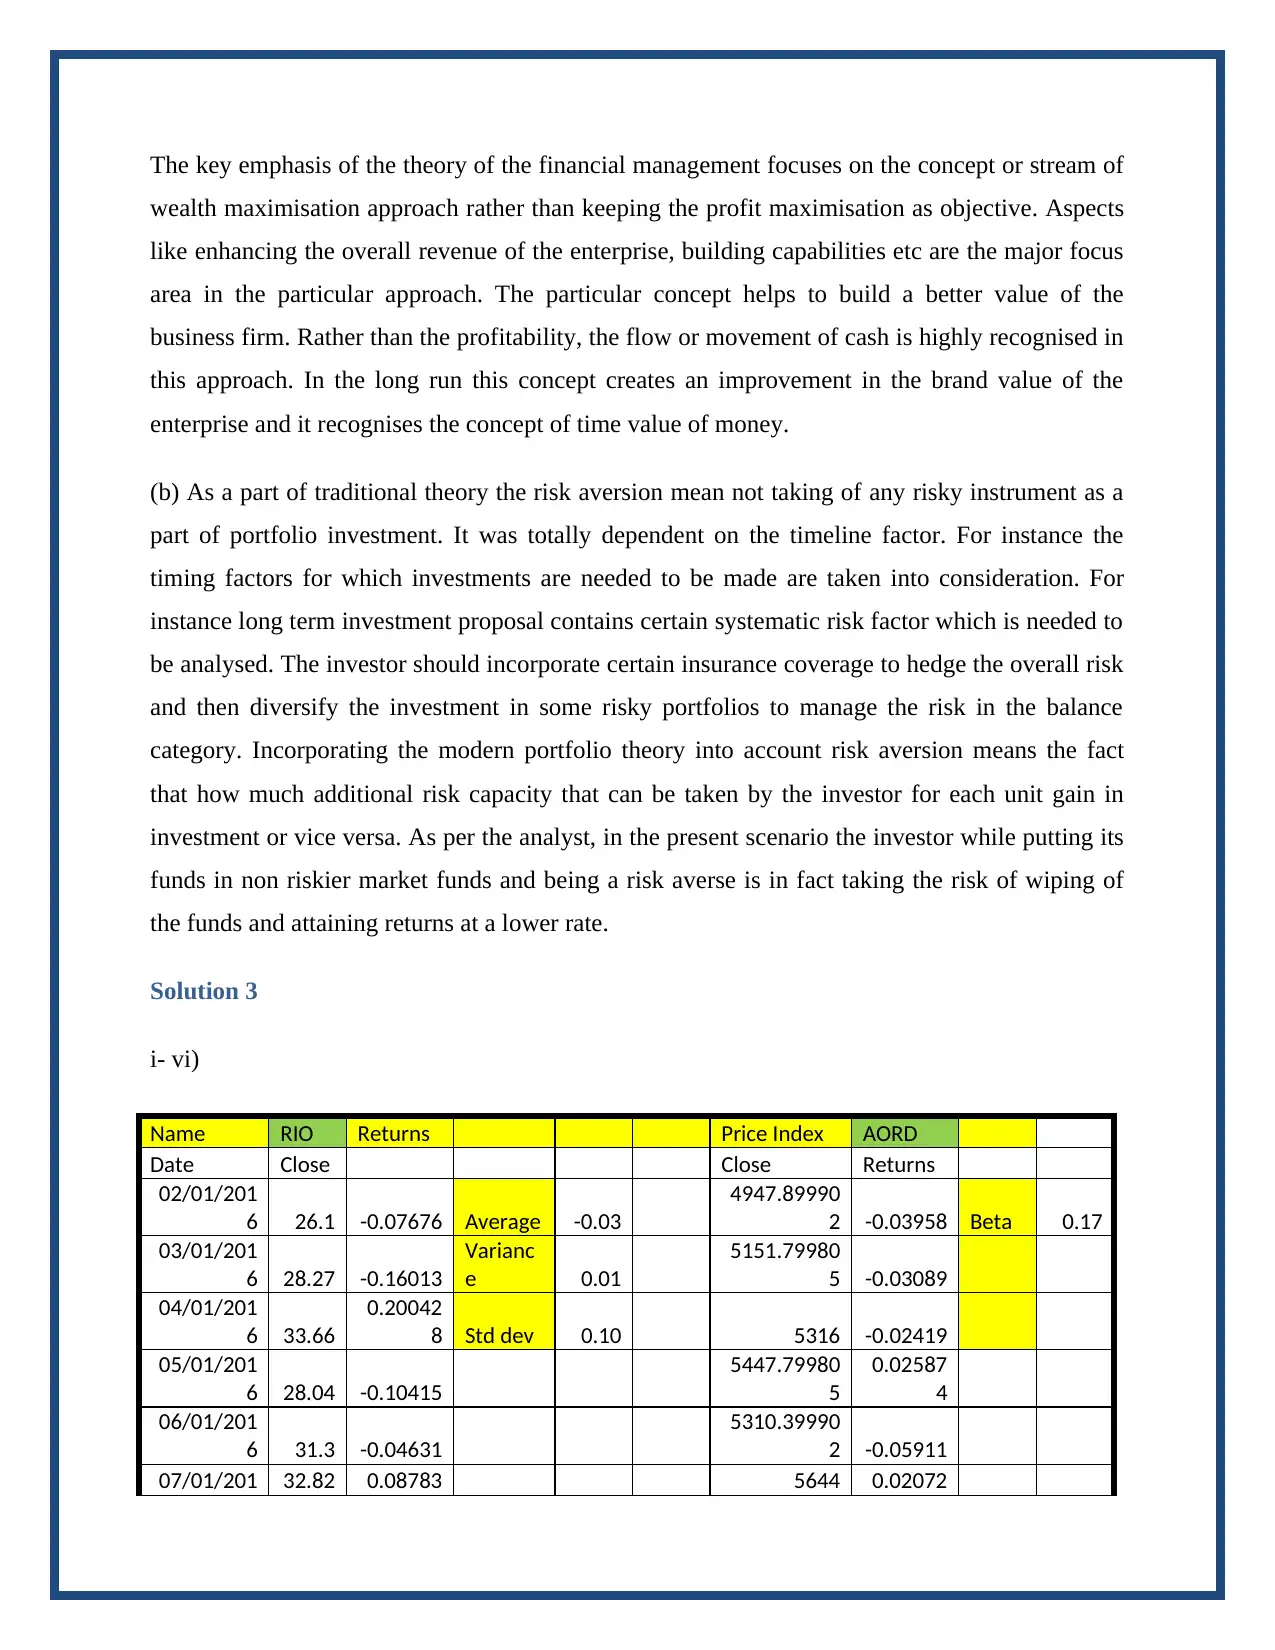
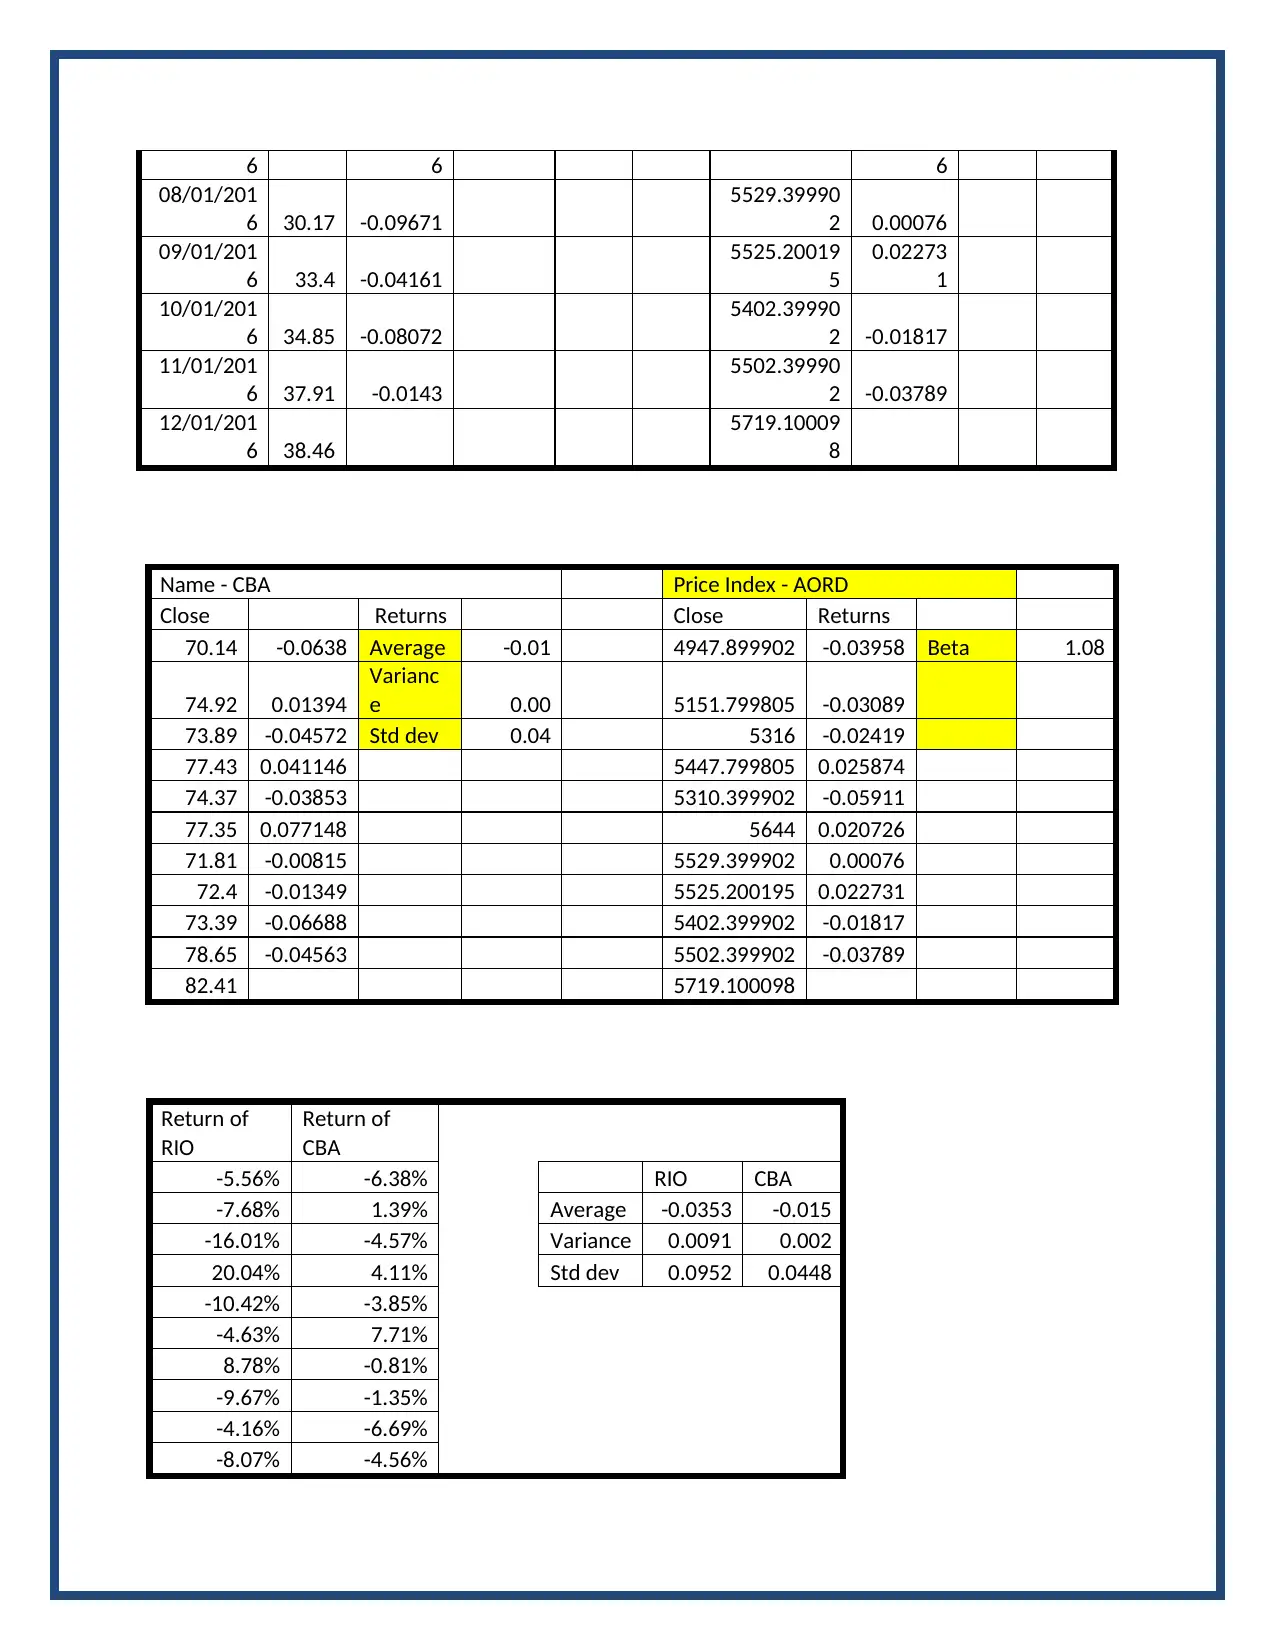
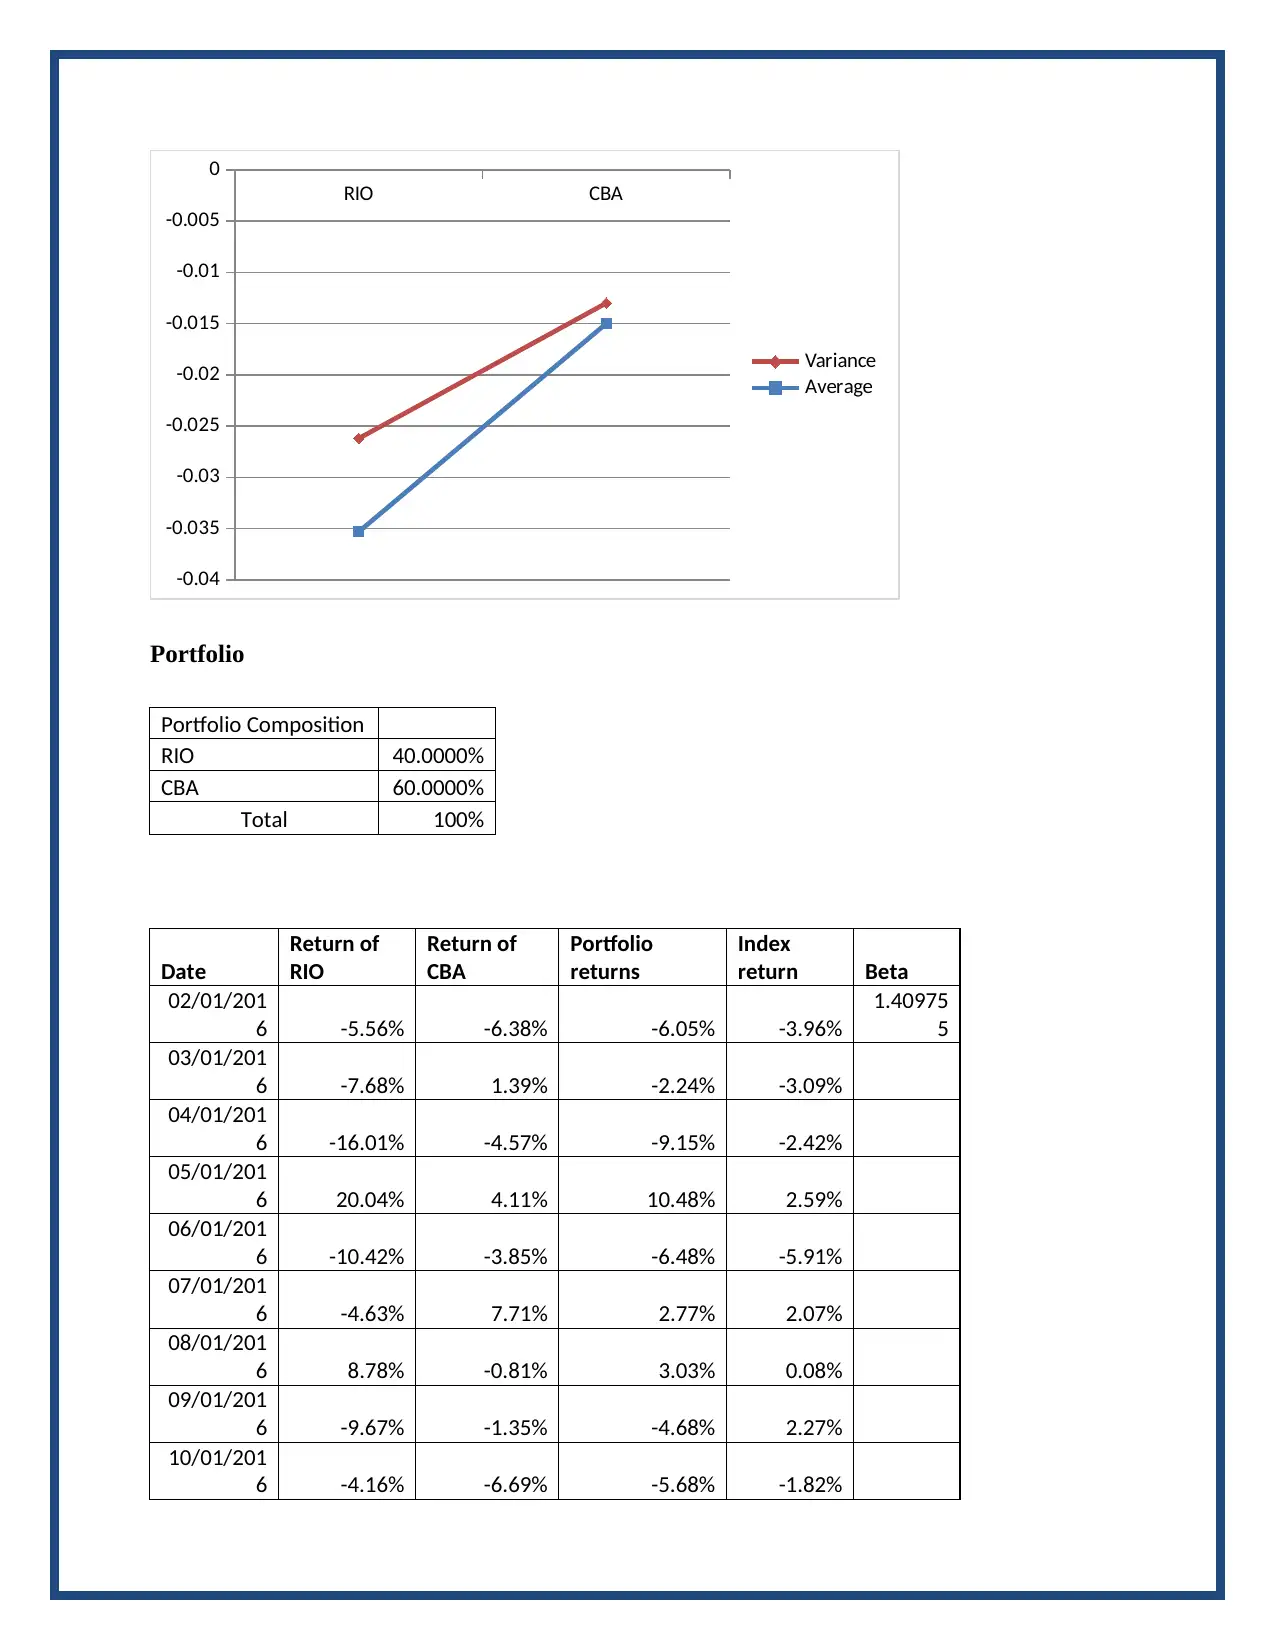
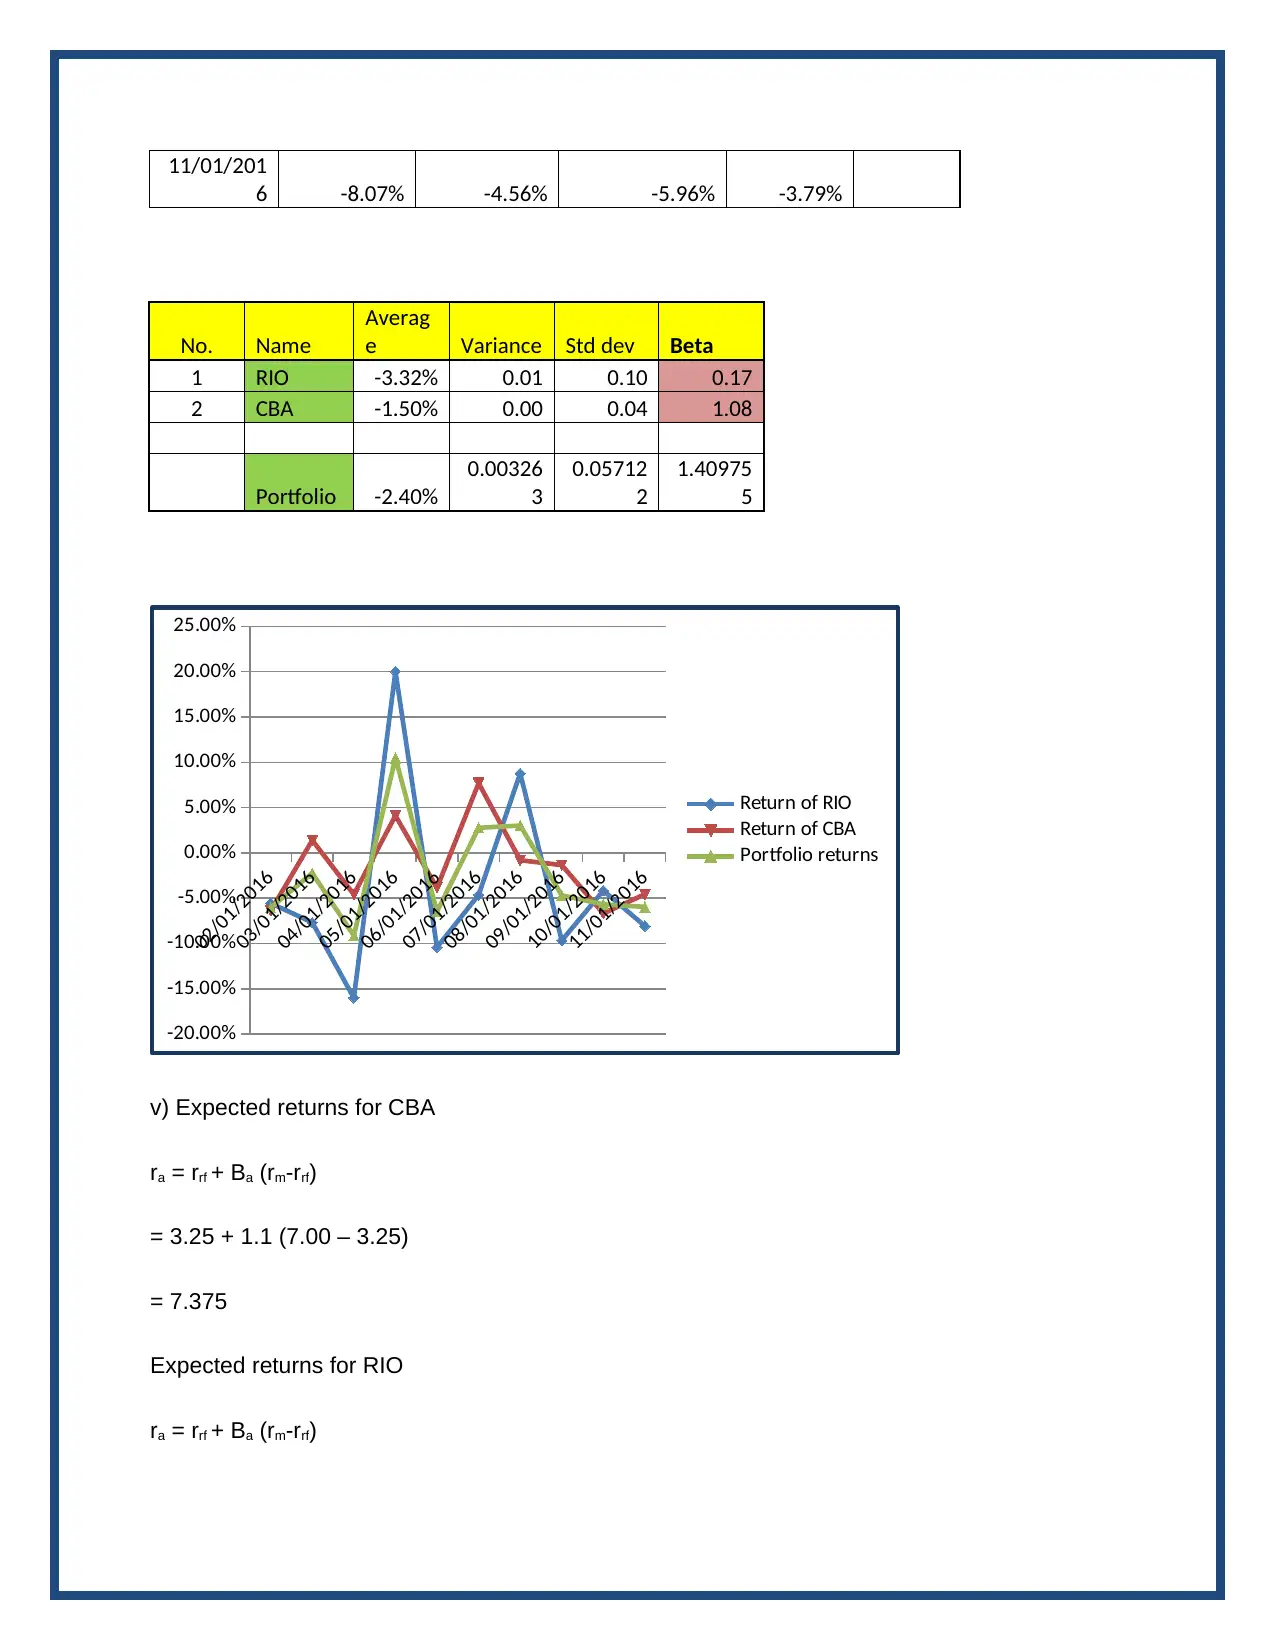
This finance assignment solution covers various aspects of financial management and investment analysis. It includes calculations for present and future value, addressing time value of money concepts. The assignment explores financial management objectives, contrasting profit maximization with wealth maximization, and emphasizing the importance of cash flow. It also delves into risk aversion, comparing traditional and modern portfolio theory approaches. Furthermore, the solution presents an analysis of stock returns for RIO and CBA, including calculations of average returns, variance, standard deviation, and beta. A portfolio composition is analyzed, and expected returns for CBA and RIO are calculated using the Capital Asset Pricing Model (CAPM). Based on the analysis, the solution provides investment recommendations.

Assessment item 2
Paraphrase This Document
Need a fresh take? Get an instant paraphrase of this document with our AI Paraphraser

Solution 1
(a) 10,000 = 800 * [{(1+0.05)n*2-1}/0.05 ]
(1.05) n = 1.625
n = 4.98315 years
(b) PV = C * [{1-(1+i)-n} / I] * (1+i)
180,000 = C * [{1-(1+i)-15} / 0.1] * (1.1)
C = 21513.89
(c) Future value = 4000 * [{(1 +0.05)10 – 1} / 0.05]
= $ 50311.57
(d) Present Value = 2000 * [{1 – (1.06)-10}/0.06}]* 1.06
= $ 156033.8
It is favourable to sell at $ 150,000 value is $ 156033.8
Solution 2
(a) While working out on the overall approach of the financial management it is observed by the
financial analyst that the business organsiation should plan its operations and activities in such a
manner that it will enhance the total value as well as the earnings of the business firm. Financial
management objectives are primarily segmented into two major streams. These are bulleted as
follows –
Profit maximisation approach – Focusing over enhancing the profitability of the business
enterprise.
Wealth maximisation approach – This approach workout towards enhancing the net worth of
the business investors while keeping the funds invested with the organsiation.

The key emphasis of the theory of the financial management focuses on the concept or stream of
wealth maximisation approach rather than keeping the profit maximisation as objective. Aspects
like enhancing the overall revenue of the enterprise, building capabilities etc are the major focus
area in the particular approach. The particular concept helps to build a better value of the
business firm. Rather than the profitability, the flow or movement of cash is highly recognised in
this approach. In the long run this concept creates an improvement in the brand value of the
enterprise and it recognises the concept of time value of money.
(b) As a part of traditional theory the risk aversion mean not taking of any risky instrument as a
part of portfolio investment. It was totally dependent on the timeline factor. For instance the
timing factors for which investments are needed to be made are taken into consideration. For
instance long term investment proposal contains certain systematic risk factor which is needed to
be analysed. The investor should incorporate certain insurance coverage to hedge the overall risk
and then diversify the investment in some risky portfolios to manage the risk in the balance
category. Incorporating the modern portfolio theory into account risk aversion means the fact
that how much additional risk capacity that can be taken by the investor for each unit gain in
investment or vice versa. As per the analyst, in the present scenario the investor while putting its
funds in non riskier market funds and being a risk averse is in fact taking the risk of wiping of
the funds and attaining returns at a lower rate.
Solution 3
i- vi)
Name RIO Returns Price Index AORD
Date Close Close Returns
02/01/201
6 26.1 -0.07676 Average -0.03
4947.89990
2 -0.03958 Beta 0.17
03/01/201
6 28.27 -0.16013
Varianc
e 0.01
5151.79980
5 -0.03089
04/01/201
6 33.66
0.20042
8 Std dev 0.10 5316 -0.02419
05/01/201
6 28.04 -0.10415
5447.79980
5
0.02587
4
06/01/201
6 31.3 -0.04631
5310.39990
2 -0.05911
07/01/201 32.82 0.08783 5644 0.02072
⊘ This is a preview!⊘
Do you want full access?
Subscribe today to unlock all pages.

Trusted by 1+ million students worldwide

6 6 6
08/01/201
6 30.17 -0.09671
5529.39990
2 0.00076
09/01/201
6 33.4 -0.04161
5525.20019
5
0.02273
1
10/01/201
6 34.85 -0.08072
5402.39990
2 -0.01817
11/01/201
6 37.91 -0.0143
5502.39990
2 -0.03789
12/01/201
6 38.46
5719.10009
8
Name - CBA Price Index - AORD
Close Returns Close Returns
70.14 -0.0638 Average -0.01 4947.899902 -0.03958 Beta 1.08
74.92 0.01394
Varianc
e 0.00 5151.799805 -0.03089
73.89 -0.04572 Std dev 0.04 5316 -0.02419
77.43 0.041146 5447.799805 0.025874
74.37 -0.03853 5310.399902 -0.05911
77.35 0.077148 5644 0.020726
71.81 -0.00815 5529.399902 0.00076
72.4 -0.01349 5525.200195 0.022731
73.39 -0.06688 5402.399902 -0.01817
78.65 -0.04563 5502.399902 -0.03789
82.41 5719.100098
Return of
RIO
Return of
CBA
-5.56% -6.38% RIO CBA
-7.68% 1.39% Average -0.0353 -0.015
-16.01% -4.57% Variance 0.0091 0.002
20.04% 4.11% Std dev 0.0952 0.0448
-10.42% -3.85%
-4.63% 7.71%
8.78% -0.81%
-9.67% -1.35%
-4.16% -6.69%
-8.07% -4.56%
Paraphrase This Document
Need a fresh take? Get an instant paraphrase of this document with our AI Paraphraser

RIO CBA
-0.04
-0.035
-0.03
-0.025
-0.02
-0.015
-0.01
-0.005
0
Variance
Average
Portfolio
Portfolio Composition
RIO 40.0000%
CBA 60.0000%
Total 100%
Date
Return of
RIO
Return of
CBA
Portfolio
returns
Index
return Beta
02/01/201
6 -5.56% -6.38% -6.05% -3.96%
1.40975
5
03/01/201
6 -7.68% 1.39% -2.24% -3.09%
04/01/201
6 -16.01% -4.57% -9.15% -2.42%
05/01/201
6 20.04% 4.11% 10.48% 2.59%
06/01/201
6 -10.42% -3.85% -6.48% -5.91%
07/01/201
6 -4.63% 7.71% 2.77% 2.07%
08/01/201
6 8.78% -0.81% 3.03% 0.08%
09/01/201
6 -9.67% -1.35% -4.68% 2.27%
10/01/201
6 -4.16% -6.69% -5.68% -1.82%

11/01/201
6 -8.07% -4.56% -5.96% -3.79%
No. Name
Averag
e Variance Std dev Beta
1 RIO -3.32% 0.01 0.10 0.17
2 CBA -1.50% 0.00 0.04 1.08
Portfolio -2.40%
0.00326
3
0.05712
2
1.40975
5
02/01/2016
03/01/2016
04/01/2016
05/01/2016
06/01/2016
07/01/2016
08/01/2016
09/01/2016
10/01/2016
11/01/2016
-20.00%
-15.00%
-10.00%
-5.00%
0.00%
5.00%
10.00%
15.00%
20.00%
25.00%
Return of RIO
Return of CBA
Portfolio returns
v) Expected returns for CBA
ra = rrf + Ba (rm-rrf)
= 3.25 + 1.1 (7.00 – 3.25)
= 7.375
Expected returns for RIO
ra = rrf + Ba (rm-rrf)
⊘ This is a preview!⊘
Do you want full access?
Subscribe today to unlock all pages.

Trusted by 1+ million students worldwide

= 3.25 + 0.95 * (7.00 – 3.25)
= 6.8125
vii) Based on referring the return of the shares of the RIO, CBA and the overall portfolio returns
it is recommended to not to invest in either of the three due to negative returns. Though if either
of the stock is compulsorily needed to be picked then the CBA is the better option with lower
average negative return witnessed in the year 2016
1 out of 7
Related Documents

Your All-in-One AI-Powered Toolkit for Academic Success.
+13062052269
info@desklib.com
Available 24*7 on WhatsApp / Email
Unlock your academic potential
Copyright © 2020–2025 A2Z Services. All Rights Reserved. Developed and managed by ZUCOL.