Financial Management: Cash Budget, NPV, and Payback Analysis

Verified

Added on  2022/08/21

|7
|878
|14
Homework Assignment
AI Summary
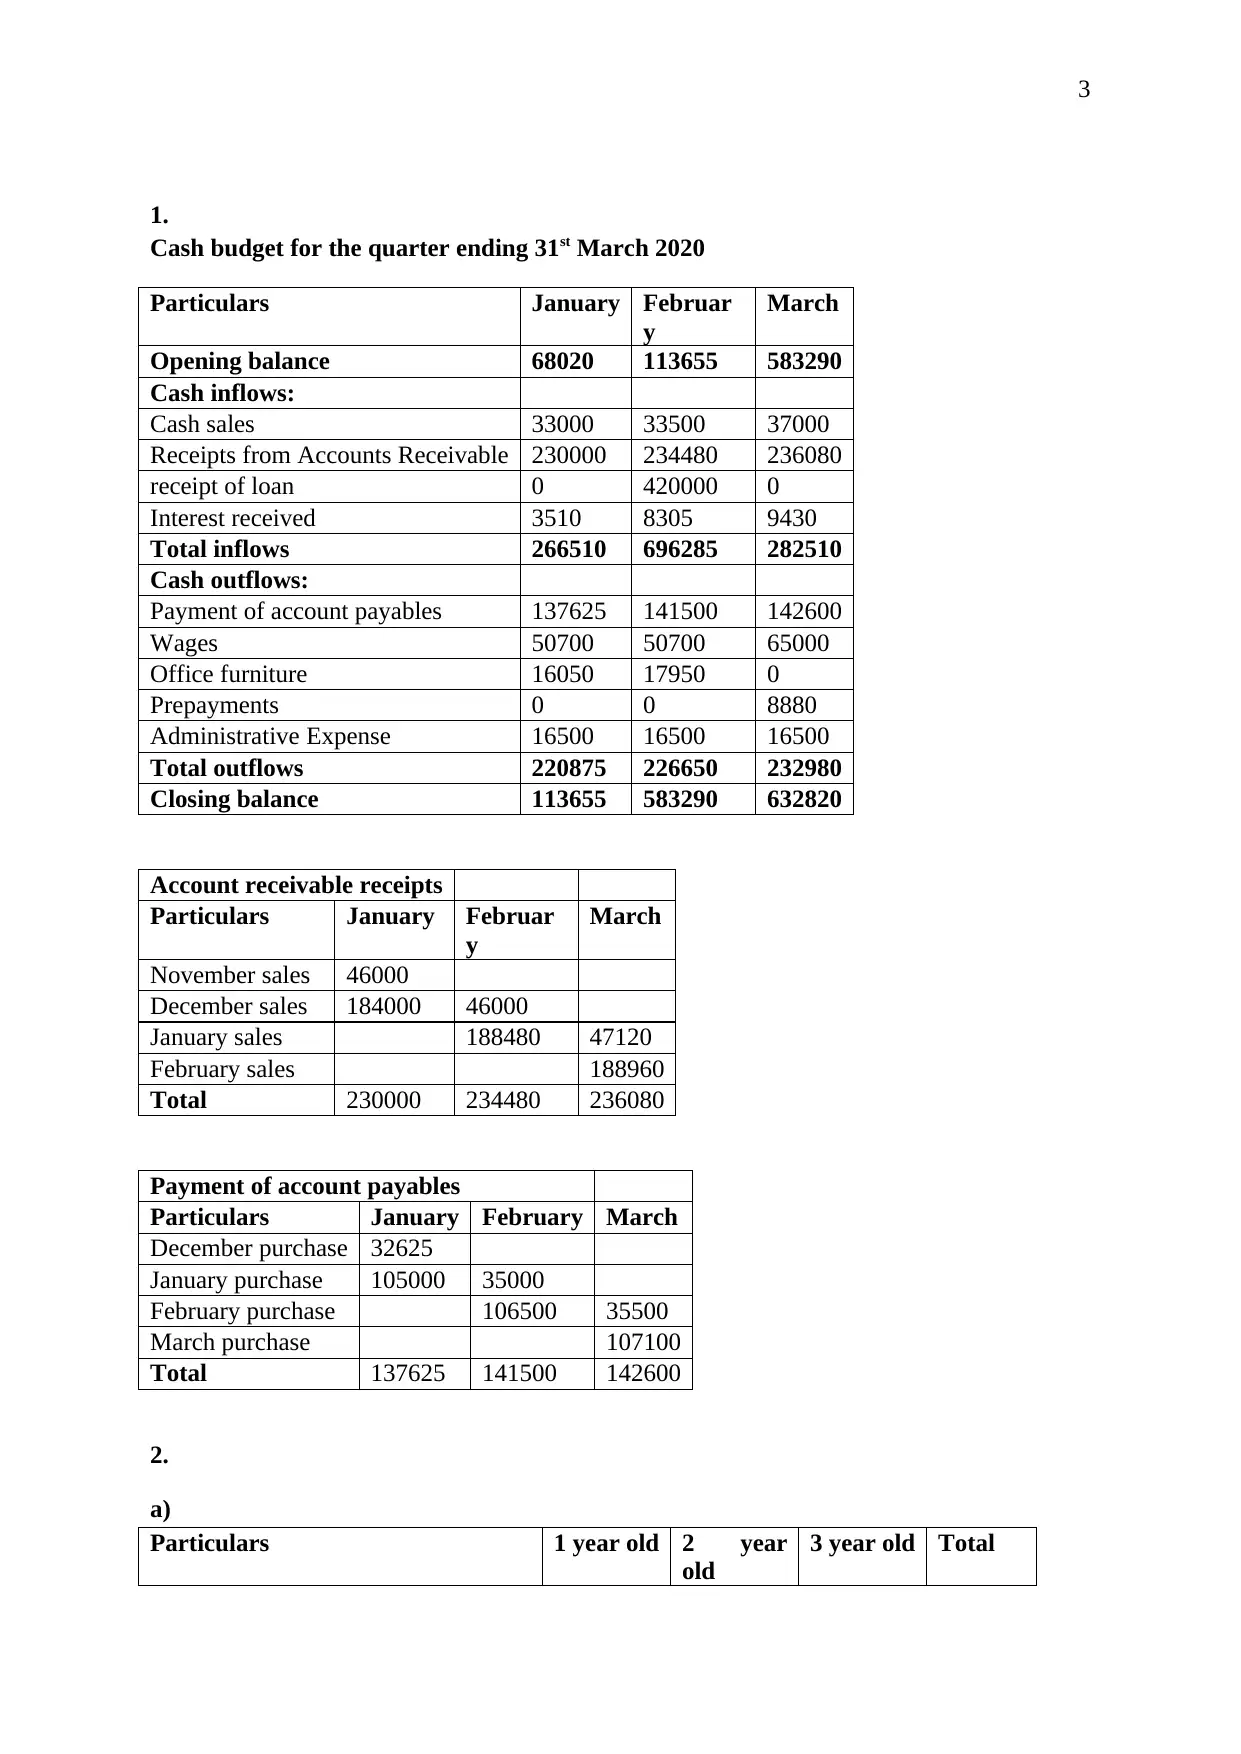
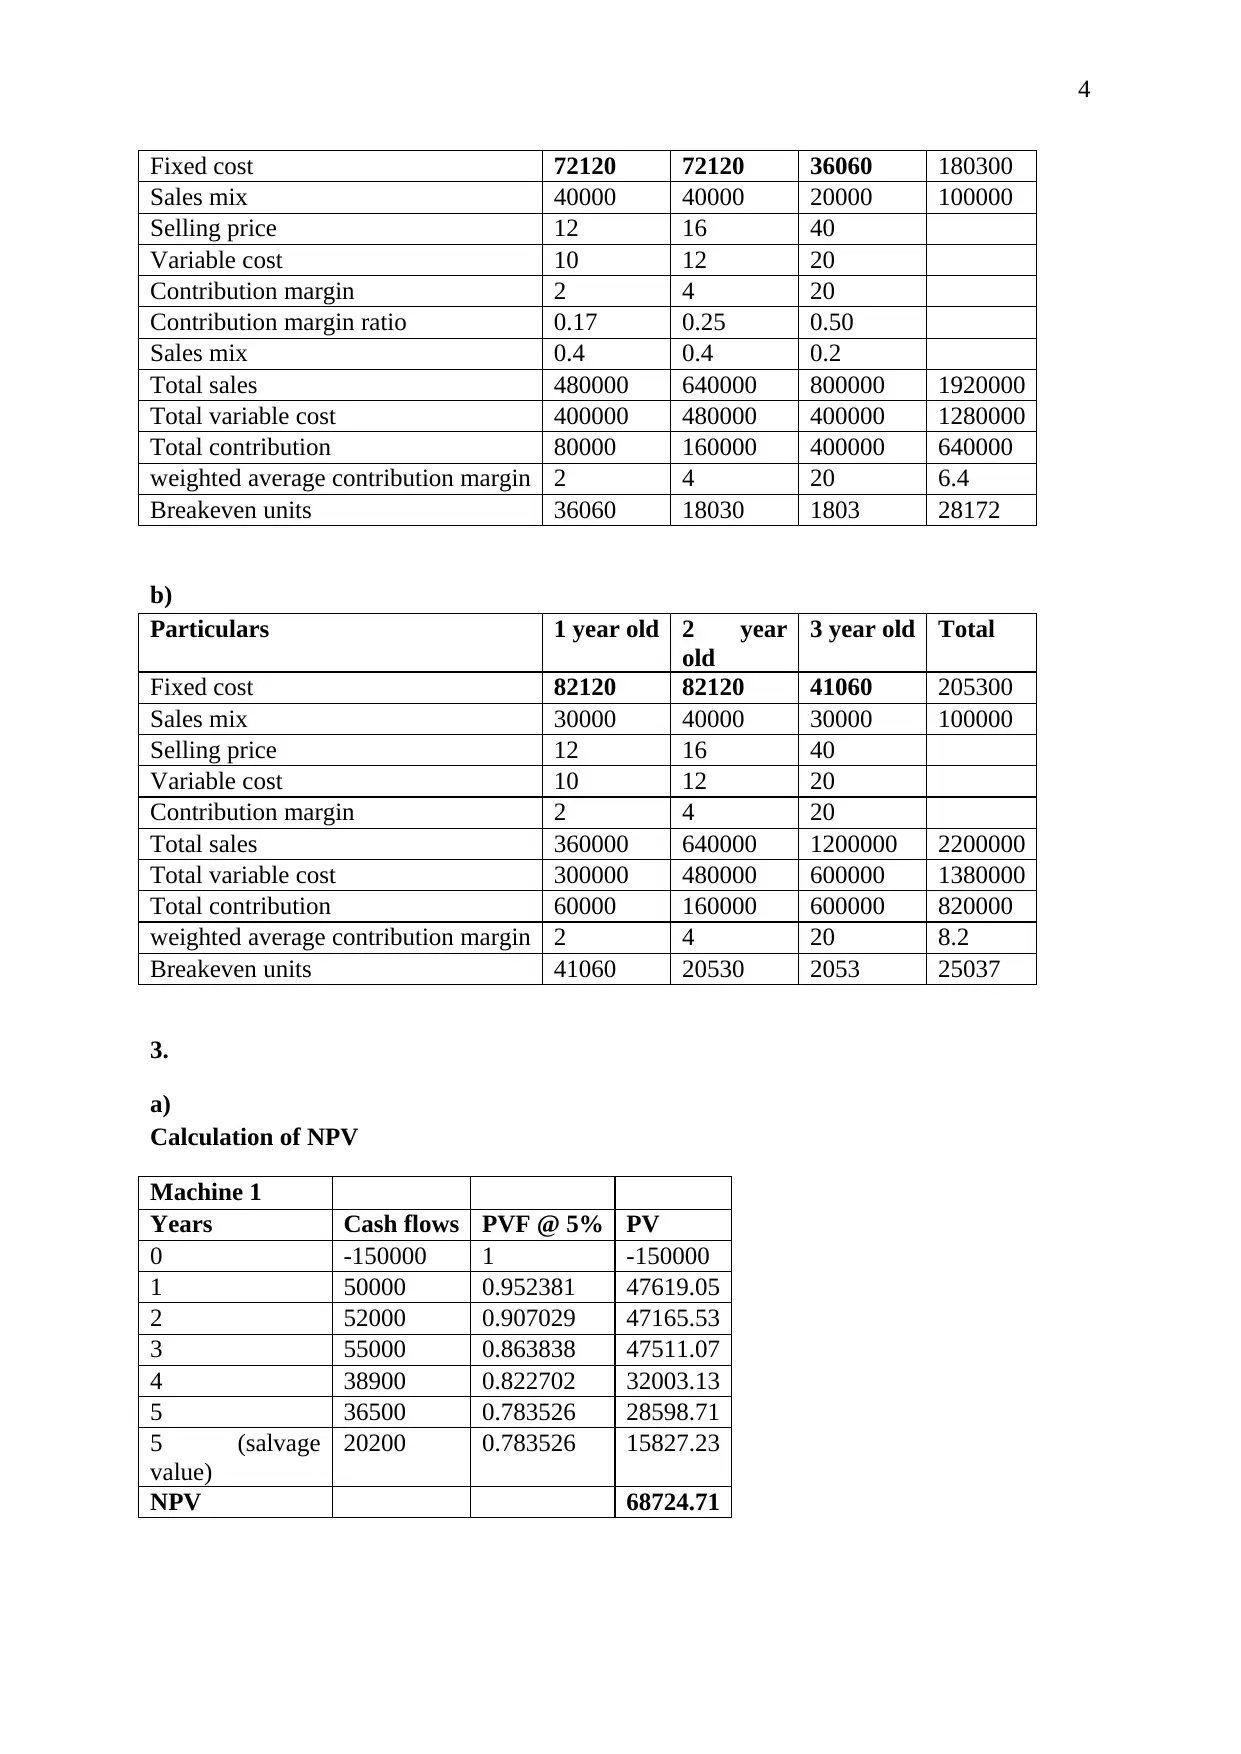
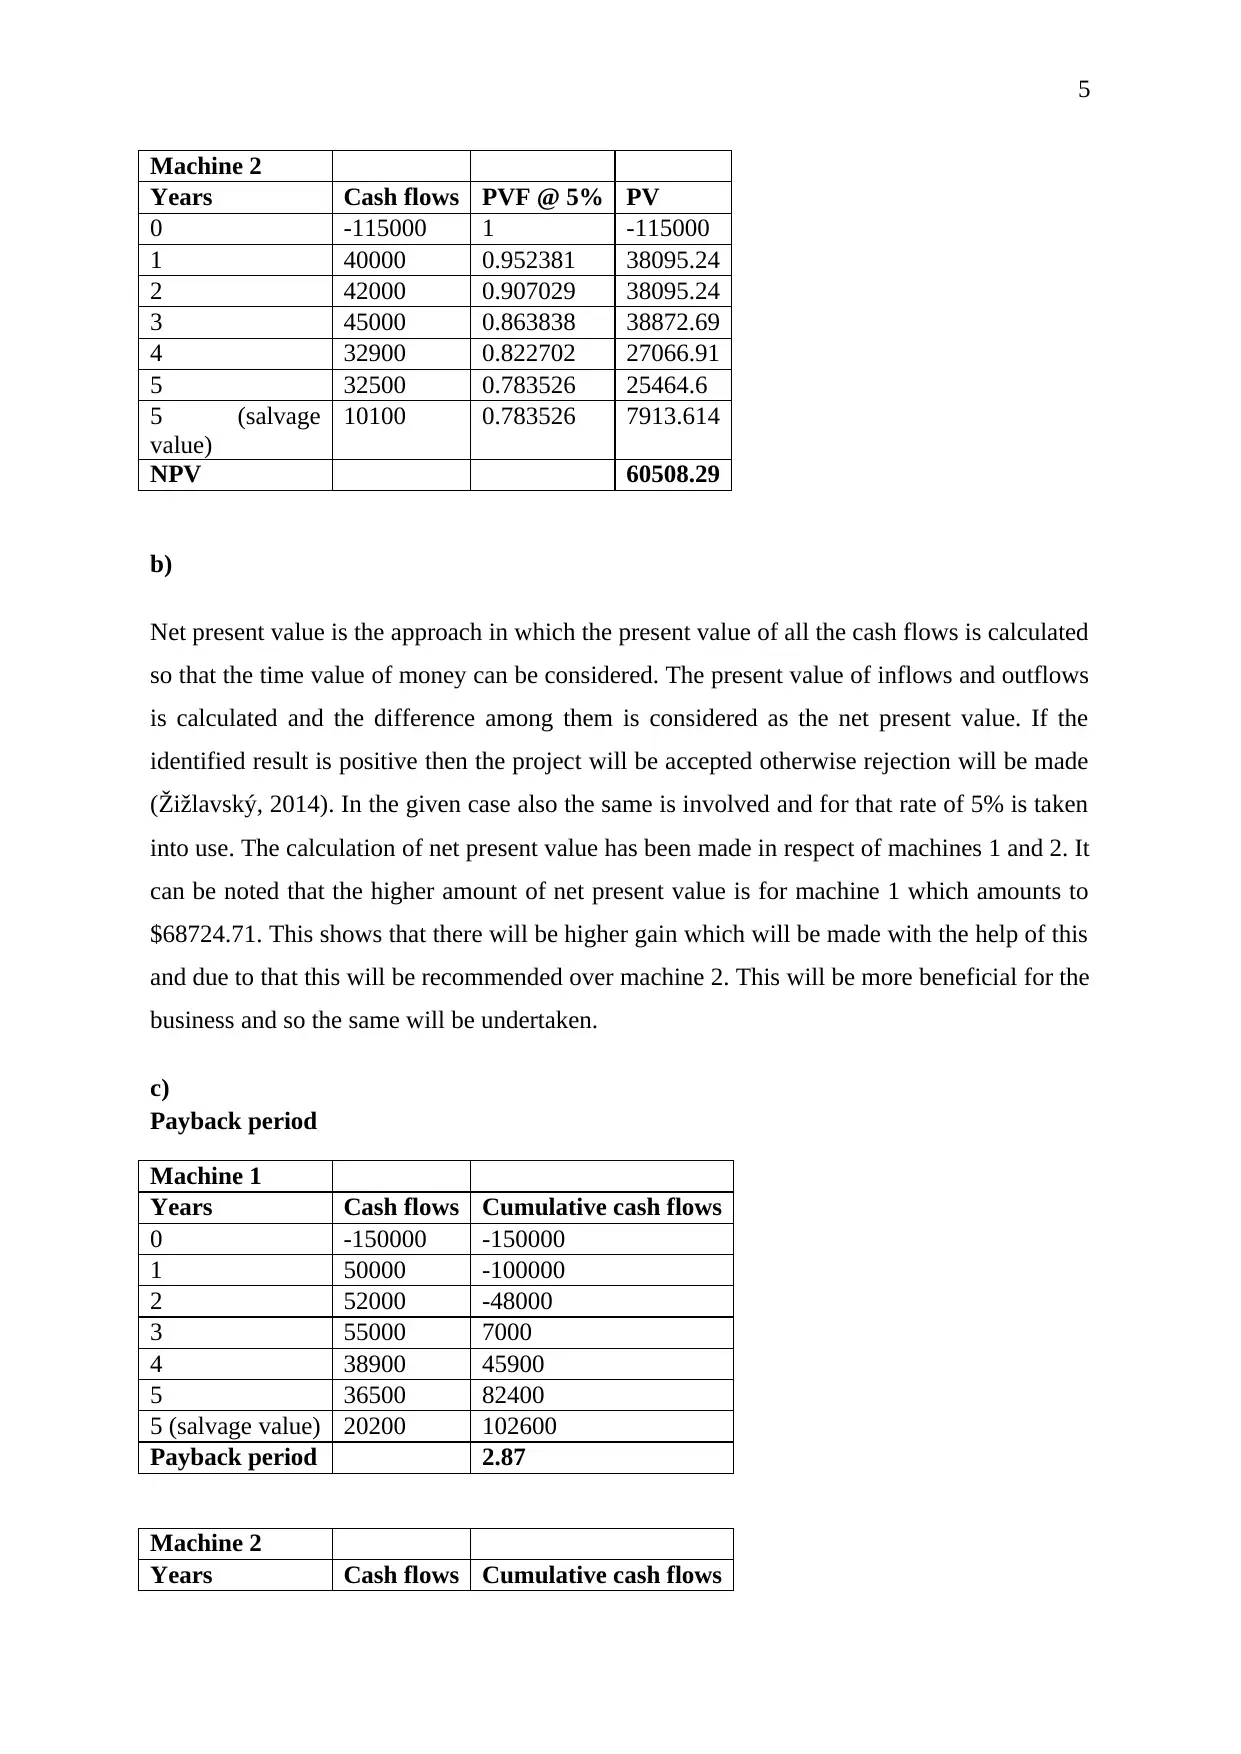
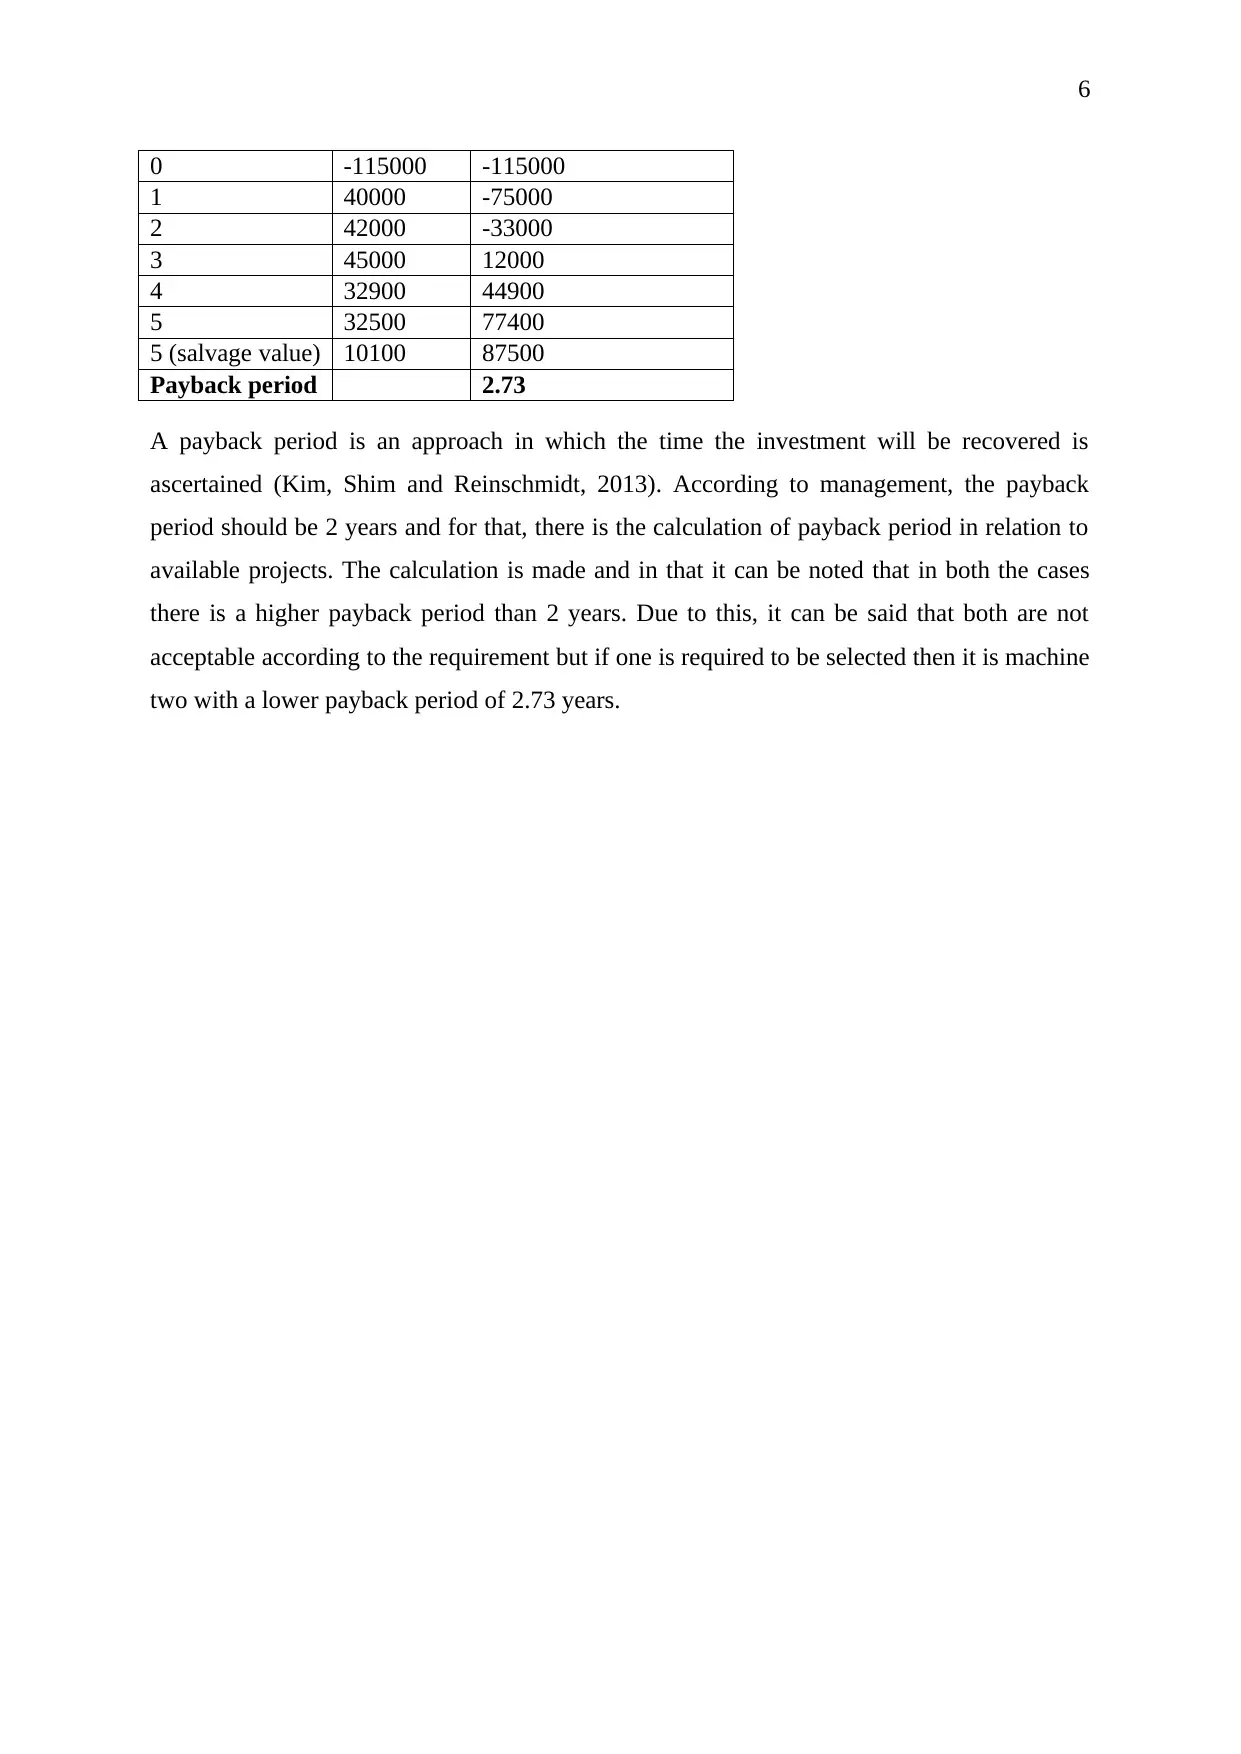
This document provides a comprehensive solution to a financial management assignment, demonstrating key concepts such as cash flow analysis, net present value (NPV), and payback period calculations. The assignment includes a detailed cash budget for the quarter ending March 31st, 2020, outlining cash inflows (cash sales, receipts from accounts receivable, receipt of loan, and interest received) and cash outflows (payment of accounts payables, wages, office furniture, prepayments, and administrative expenses). The document also analyzes the payment of accounts payables and account receivable receipts. Furthermore, the assignment explores breakeven analysis for different product scenarios, calculating fixed costs, sales mix, selling prices, variable costs, contribution margins, and breakeven units. Finally, the solution delves into investment appraisal, calculating the NPV and payback periods for two machines, considering cash flows, present values, and cumulative cash flows, and providing a recommendation based on the financial metrics. References to relevant academic sources are included.
Document Page
1
Accounting & Financial Management
tabler-icon-diamond-filled.svg

Paraphrase This Document

Need a fresh take? Get an instant paraphrase of this document with our AI Paraphraser
Document Page
2
Table of Contents
1..................................................................................................................................................3
2..................................................................................................................................................3
a).............................................................................................................................................3
b)............................................................................................................................................4
3..................................................................................................................................................4
a).............................................................................................................................................4
b)............................................................................................................................................5
c).............................................................................................................................................5
References..................................................................................................................................7
Document Page
3
1.
Cash budget for the quarter ending 31st March 2020
Particulars January Februar
y
March
Opening balance 68020 113655 583290
Cash inflows:
Cash sales 33000 33500 37000
Receipts from Accounts Receivable 230000 234480 236080
receipt of loan 0 420000 0
Interest received 3510 8305 9430
Total inflows 266510 696285 282510
Cash outflows:
Payment of account payables 137625 141500 142600
Wages 50700 50700 65000
Office furniture 16050 17950 0
Prepayments 0 0 8880
Administrative Expense 16500 16500 16500
Total outflows 220875 226650 232980
Closing balance 113655 583290 632820
Account receivable receipts
Particulars January Februar
y
March
November sales 46000
December sales 184000 46000
January sales 188480 47120
February sales 188960
Total 230000 234480 236080
Payment of account payables
Particulars January February March
December purchase 32625
January purchase 105000 35000
February purchase 106500 35500
March purchase 107100
Total 137625 141500 142600
2.
a)
Particulars 1 year old 2 year
old
3 year old Total
Document Page
4
Fixed cost 72120 72120 36060 180300
Sales mix 40000 40000 20000 100000
Selling price 12 16 40
Variable cost 10 12 20
Contribution margin 2 4 20
Contribution margin ratio 0.17 0.25 0.50
Sales mix 0.4 0.4 0.2
Total sales 480000 640000 800000 1920000
Total variable cost 400000 480000 400000 1280000
Total contribution 80000 160000 400000 640000
weighted average contribution margin 2 4 20 6.4
Breakeven units 36060 18030 1803 28172
b)
Particulars 1 year old 2 year
old
3 year old Total
Fixed cost 82120 82120 41060 205300
Sales mix 30000 40000 30000 100000
Selling price 12 16 40
Variable cost 10 12 20
Contribution margin 2 4 20
Total sales 360000 640000 1200000 2200000
Total variable cost 300000 480000 600000 1380000
Total contribution 60000 160000 600000 820000
weighted average contribution margin 2 4 20 8.2
Breakeven units 41060 20530 2053 25037
3.
a)
Calculation of NPV
Machine 1
Years Cash flows PVF @ 5% PV
0 -150000 1 -150000
1 50000 0.952381 47619.05
2 52000 0.907029 47165.53
3 55000 0.863838 47511.07
4 38900 0.822702 32003.13
5 36500 0.783526 28598.71
5 (salvage
value)
20200 0.783526 15827.23
NPV 68724.71
tabler-icon-diamond-filled.svg

Paraphrase This Document

Need a fresh take? Get an instant paraphrase of this document with our AI Paraphraser
Document Page
5
Machine 2
Years Cash flows PVF @ 5% PV
0 -115000 1 -115000
1 40000 0.952381 38095.24
2 42000 0.907029 38095.24
3 45000 0.863838 38872.69
4 32900 0.822702 27066.91
5 32500 0.783526 25464.6
5 (salvage
value)
10100 0.783526 7913.614
NPV 60508.29
b)
Net present value is the approach in which the present value of all the cash flows is calculated
so that the time value of money can be considered. The present value of inflows and outflows
is calculated and the difference among them is considered as the net present value. If the
identified result is positive then the project will be accepted otherwise rejection will be made
(Žižlavský, 2014). In the given case also the same is involved and for that rate of 5% is taken
into use. The calculation of net present value has been made in respect of machines 1 and 2. It
can be noted that the higher amount of net present value is for machine 1 which amounts to
$68724.71. This shows that there will be higher gain which will be made with the help of this
and due to that this will be recommended over machine 2. This will be more beneficial for the
business and so the same will be undertaken.
c)
Payback period
Machine 1
Years Cash flows Cumulative cash flows
0 -150000 -150000
1 50000 -100000
2 52000 -48000
3 55000 7000
4 38900 45900
5 36500 82400
5 (salvage value) 20200 102600
Payback period 2.87
Machine 2
Years Cash flows Cumulative cash flows
Document Page
6
0 -115000 -115000
1 40000 -75000
2 42000 -33000
3 45000 12000
4 32900 44900
5 32500 77400
5 (salvage value) 10100 87500
Payback period 2.73
A payback period is an approach in which the time the investment will be recovered is
ascertained (Kim, Shim and Reinschmidt, 2013). According to management, the payback
period should be 2 years and for that, there is the calculation of payback period in relation to
available projects. The calculation is made and in that it can be noted that in both the cases
there is a higher payback period than 2 years. Due to this, it can be said that both are not
acceptable according to the requirement but if one is required to be selected then it is machine
two with a lower payback period of 2.73 years.
Document Page
7
References
Kim, B.C., Shim, E. and Reinschmidt, K.F. (2013) Probability distribution of the project
payback period using the equivalent cash flow decomposition. The Engineering
Economist, 58(2), pp.112-136.
Žižlavský, O. (2014) Net present value approach: a method for an economic assessment of
innovation projects. Procedia-Social and Behavioral Sciences, 156(26), pp.506-512.
chevron_up_icon
1 out of 7
circle_padding
hide_on_mobile
zoom_out_icon
[object Object]