Financial Management and Decision Making, Semester 1, 2024
VerifiedAdded on 2023/06/08
|11
|1747
|274
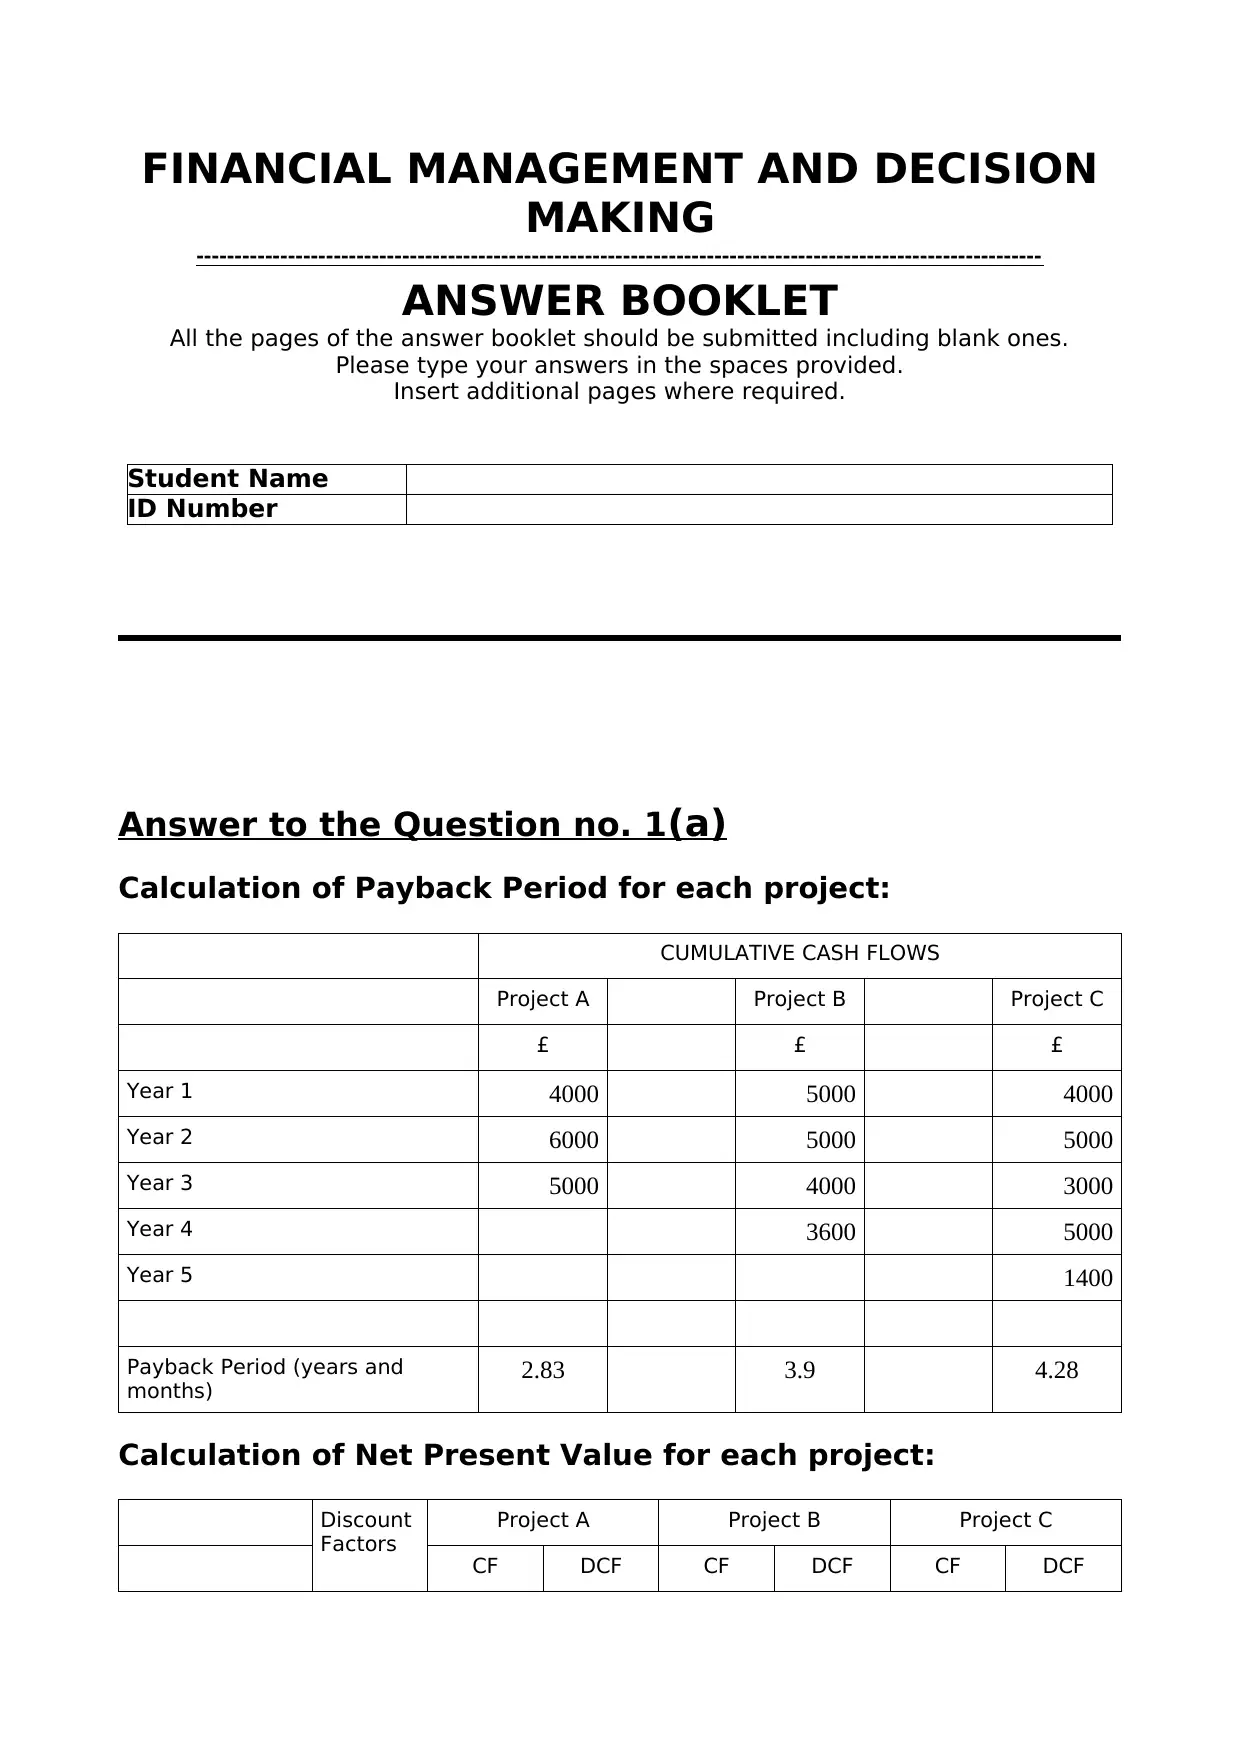
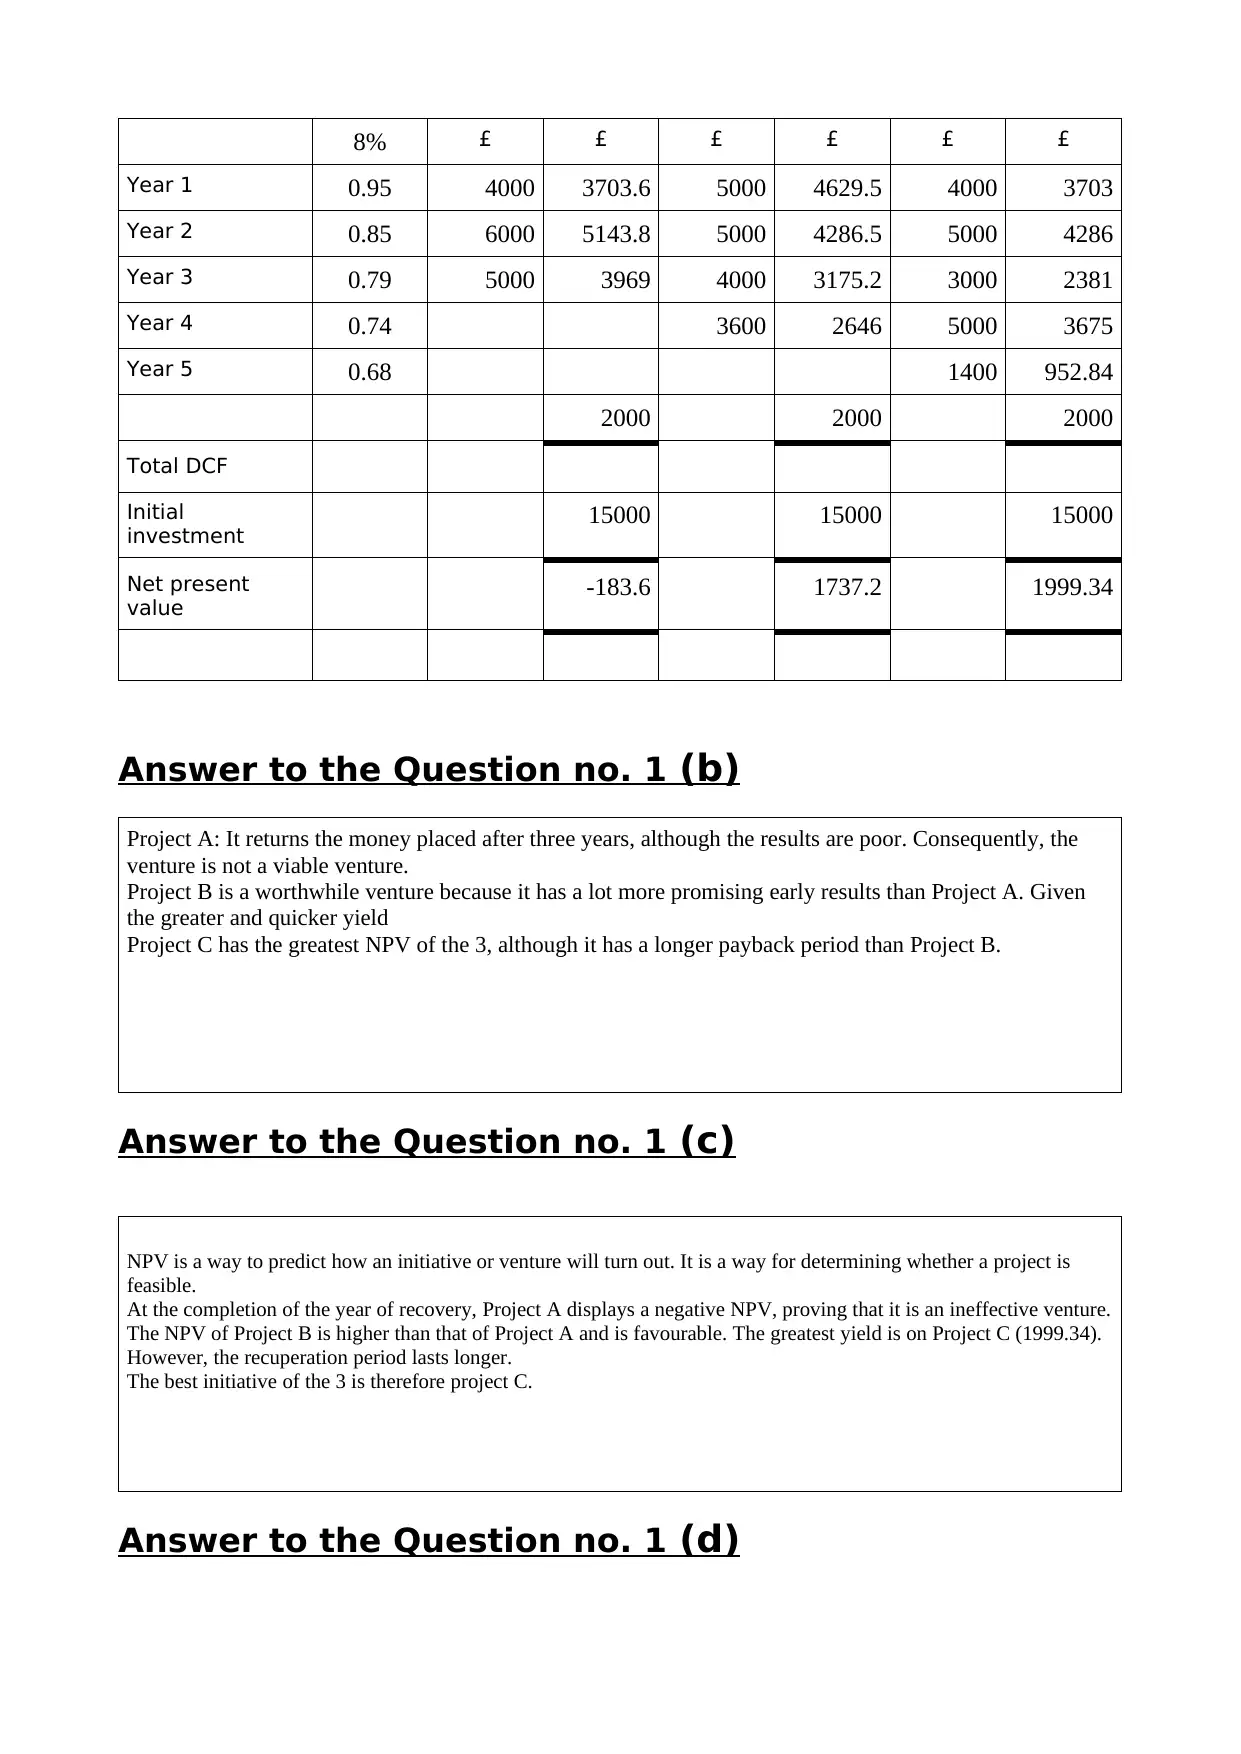
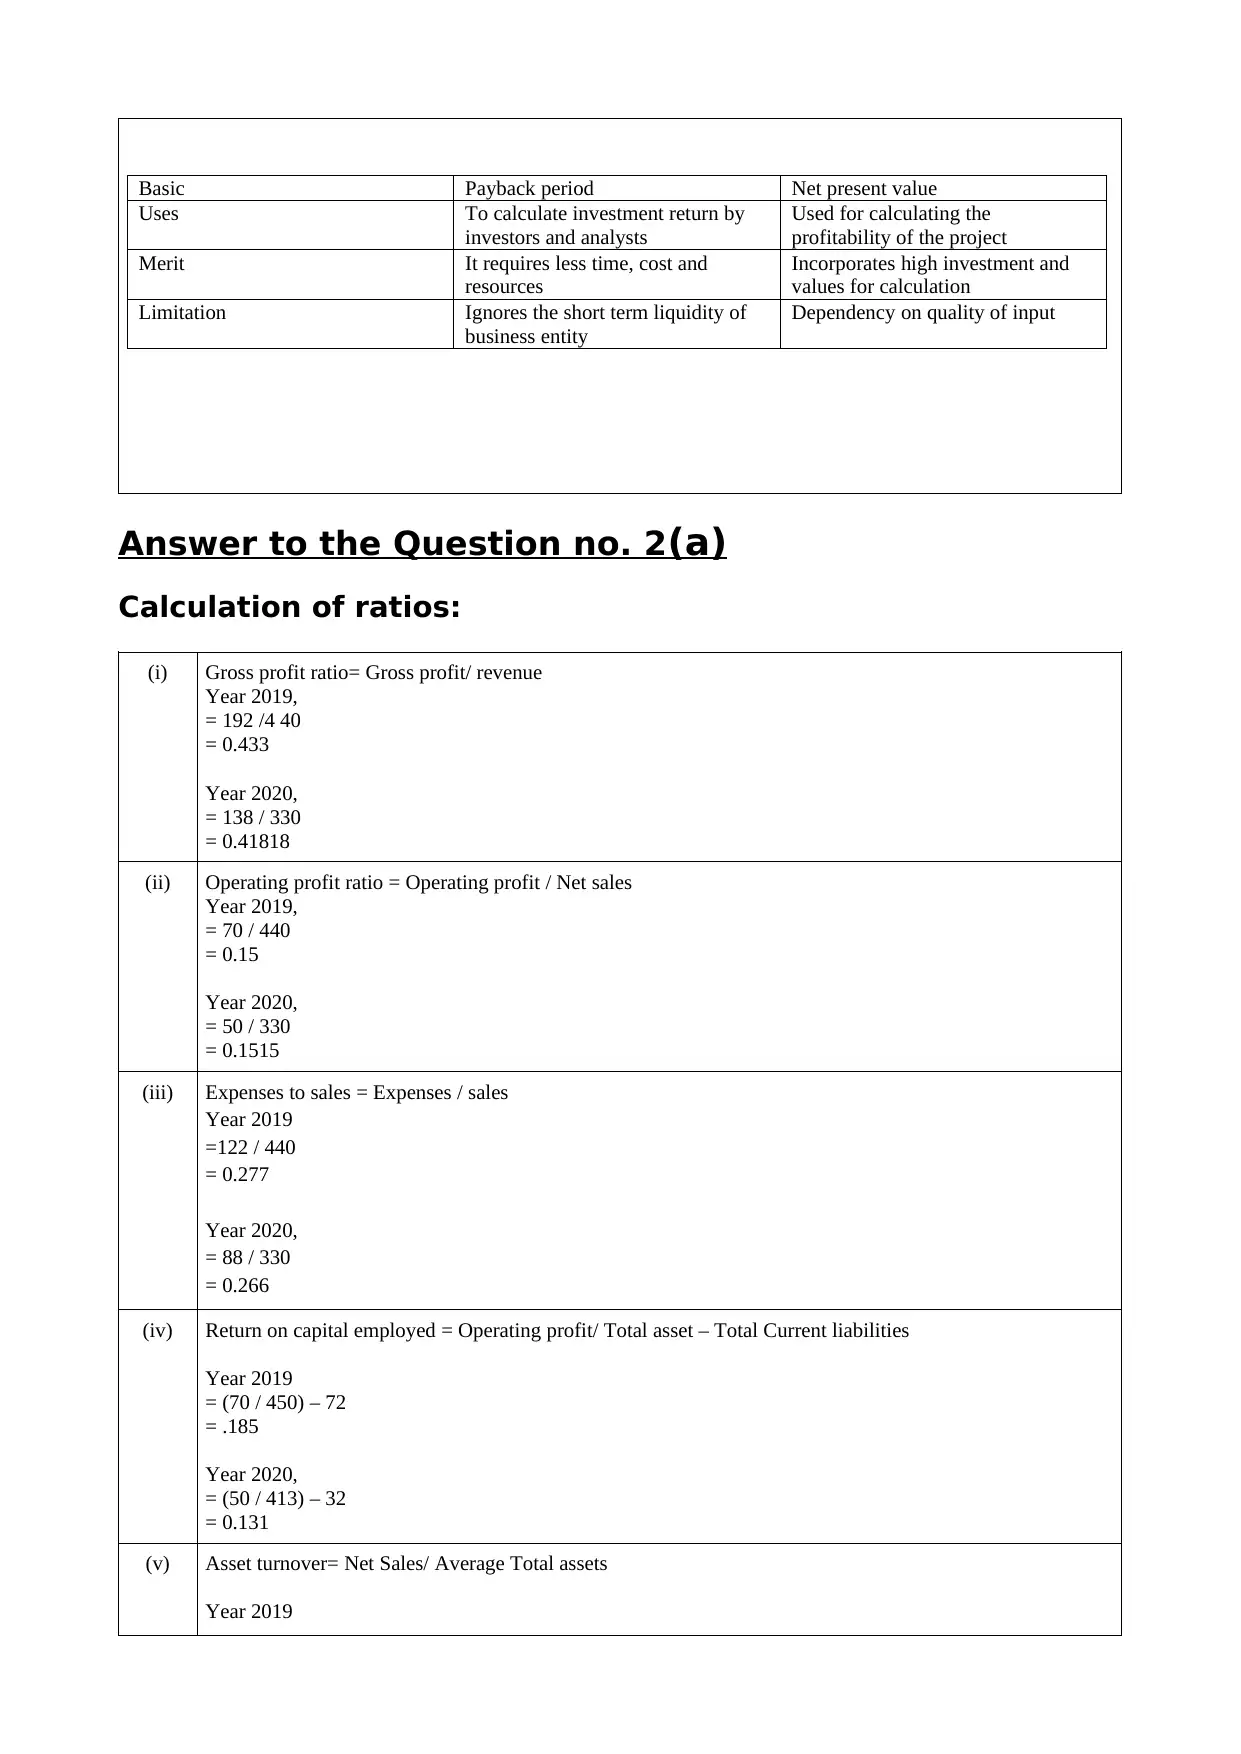
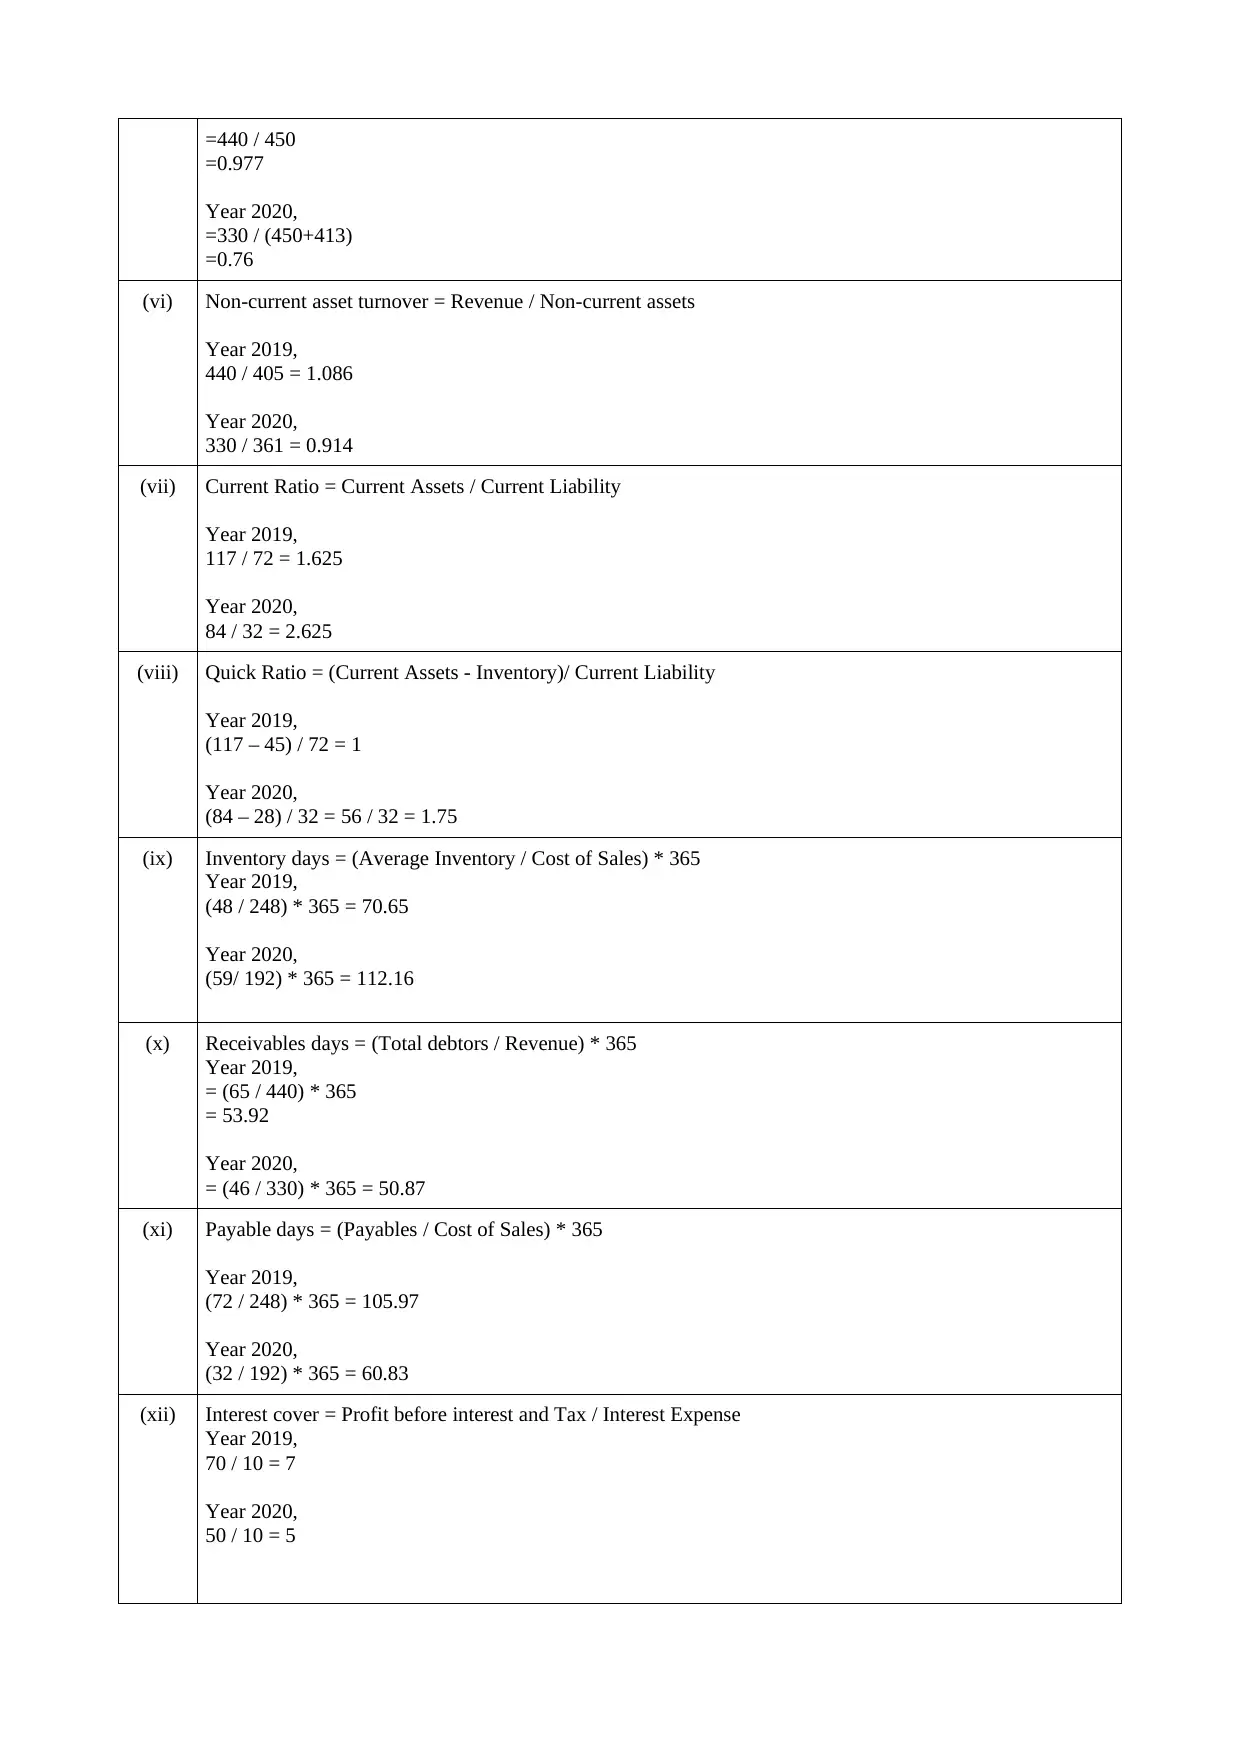
Homework Assignment
AI Summary
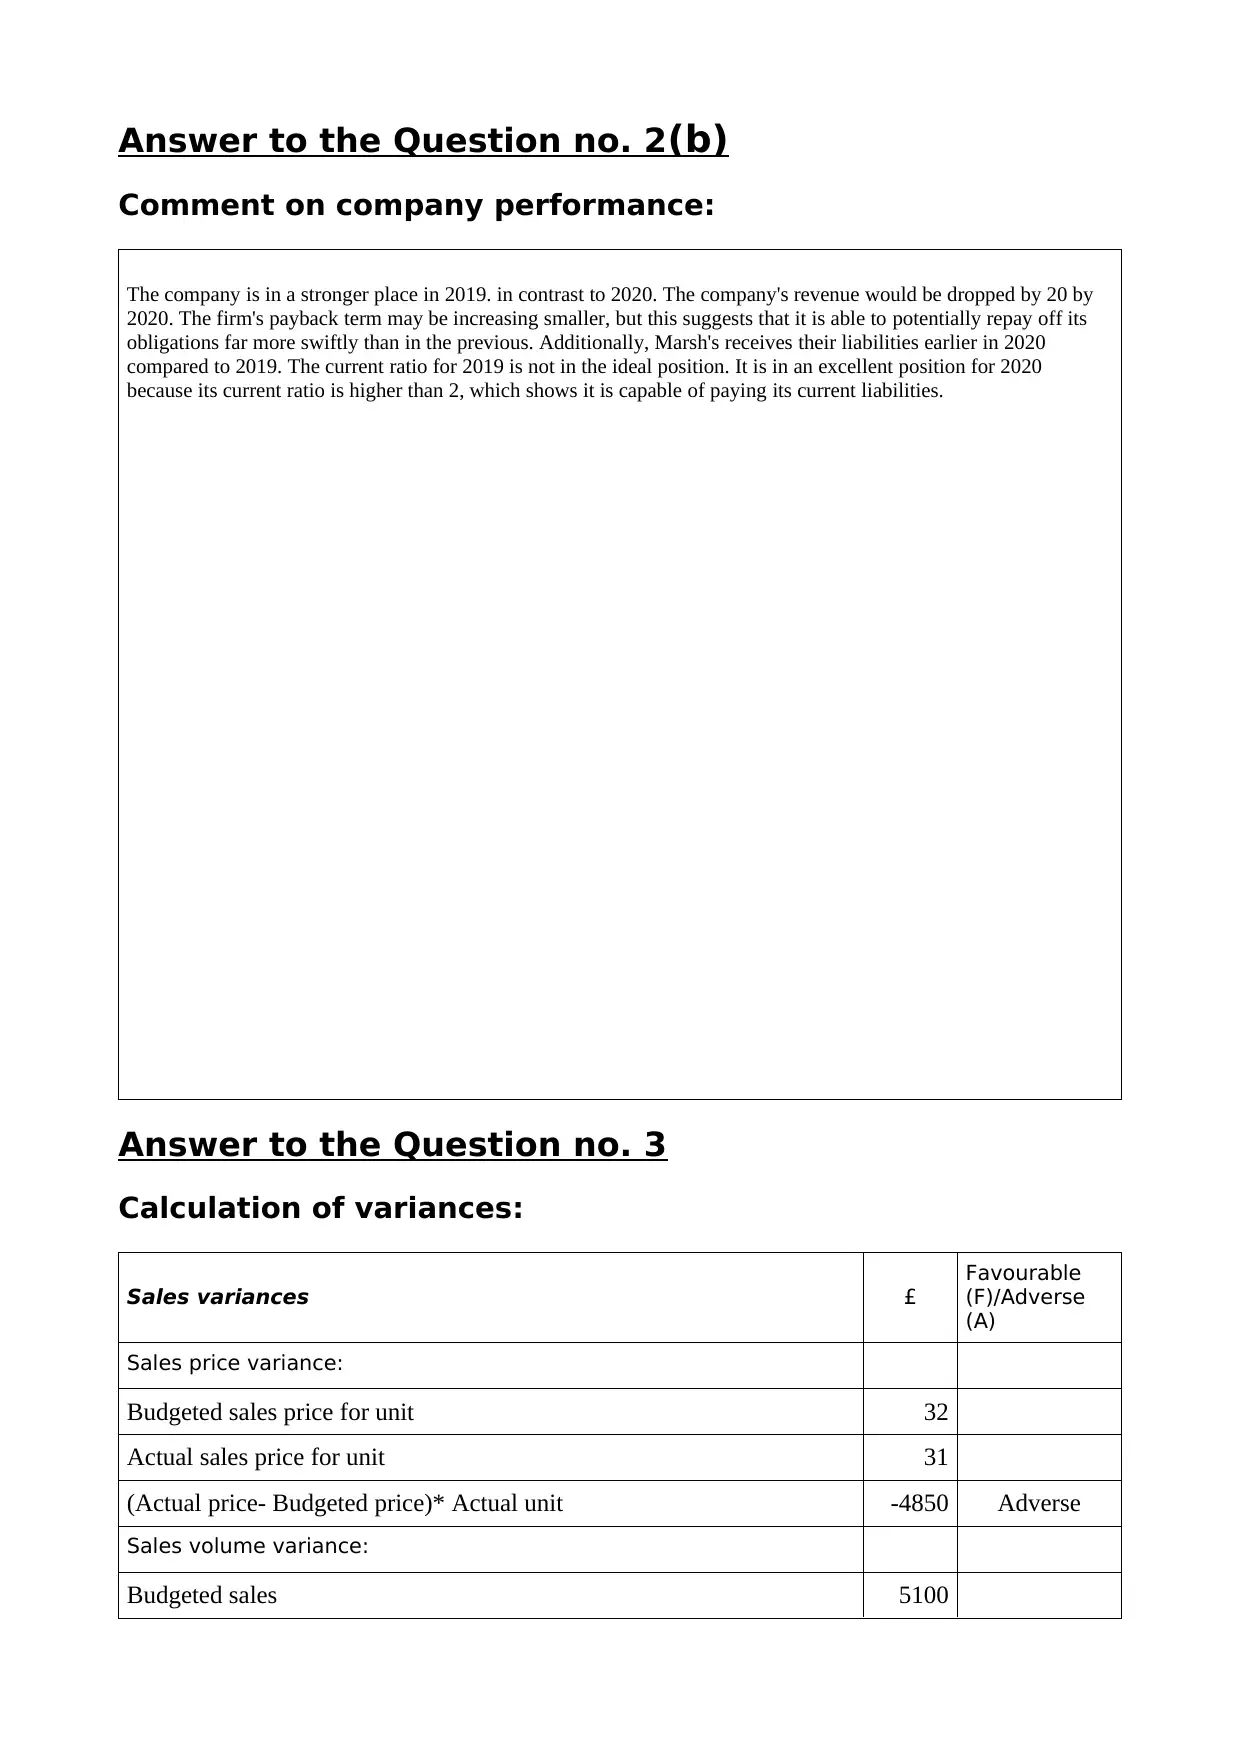
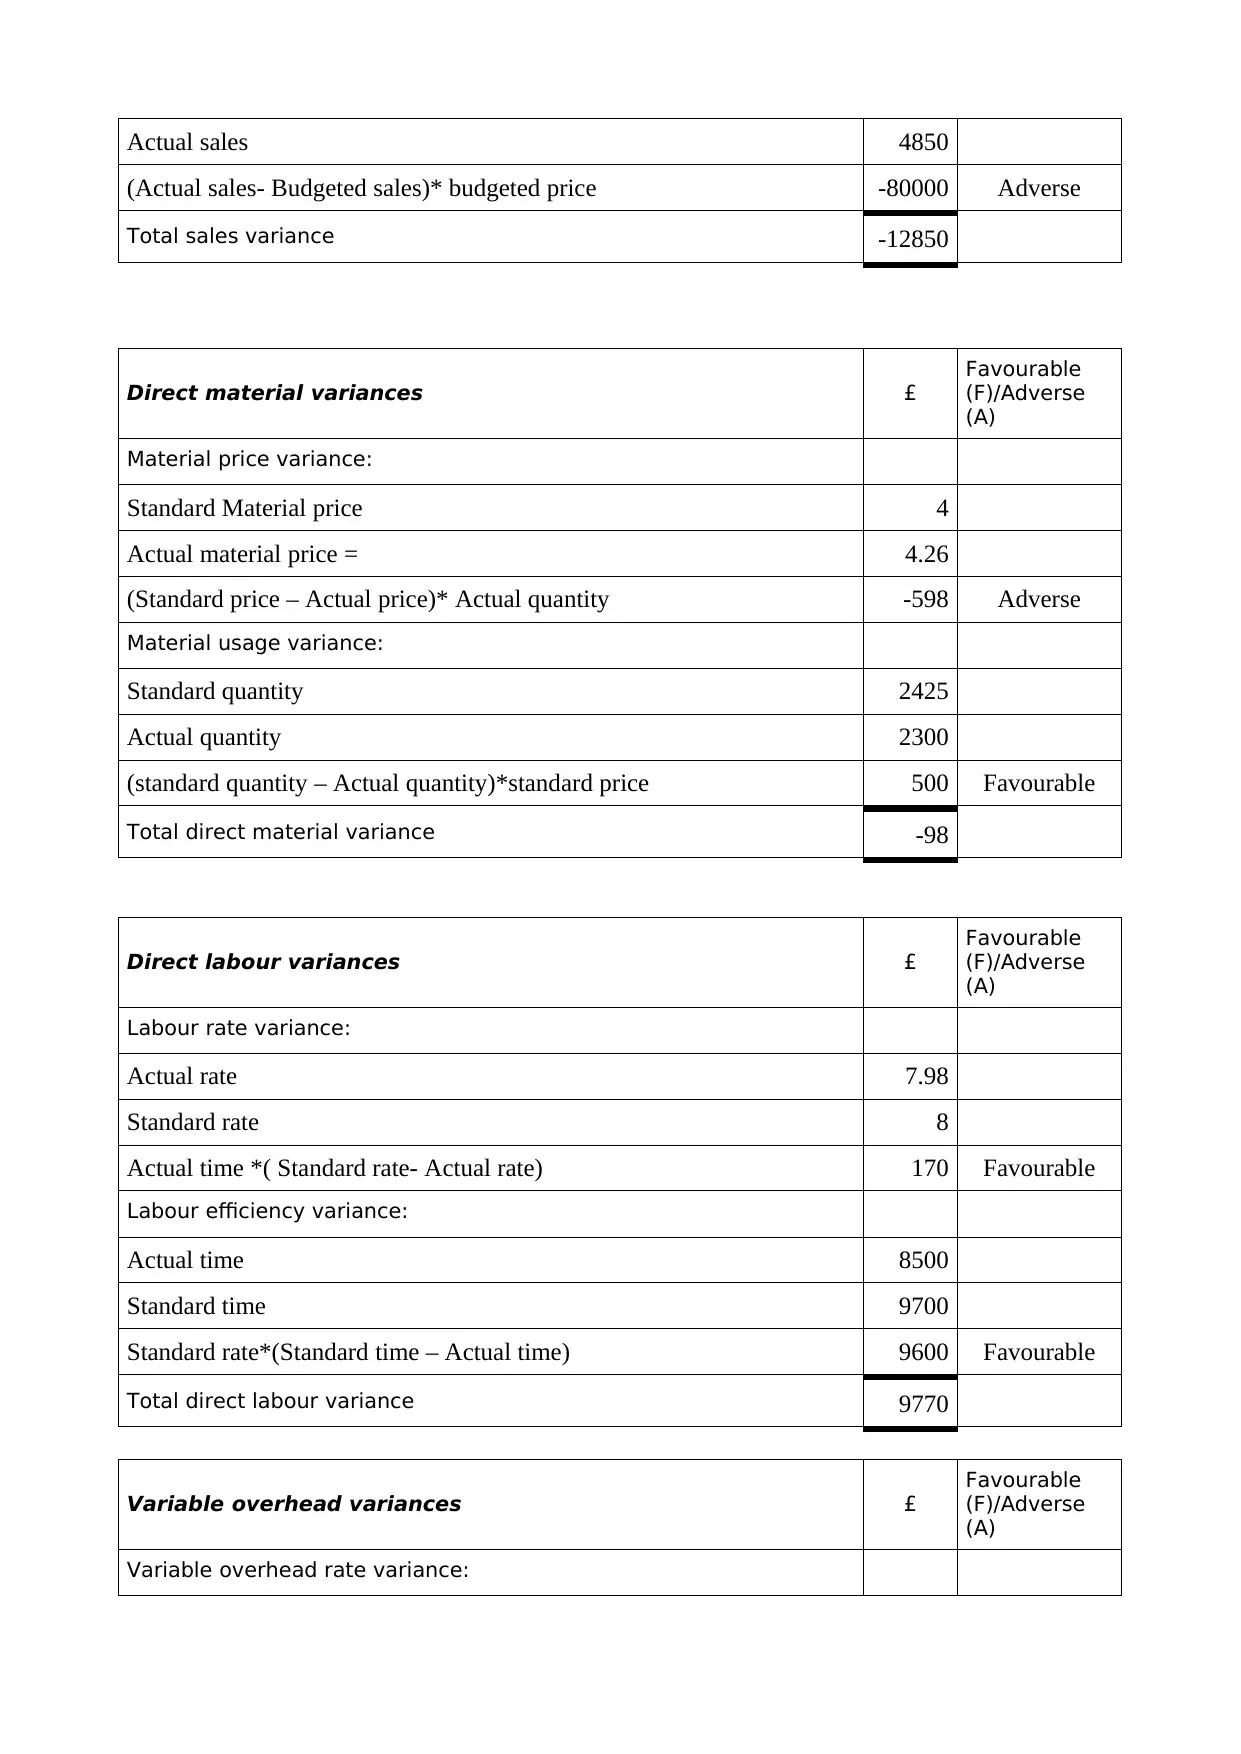
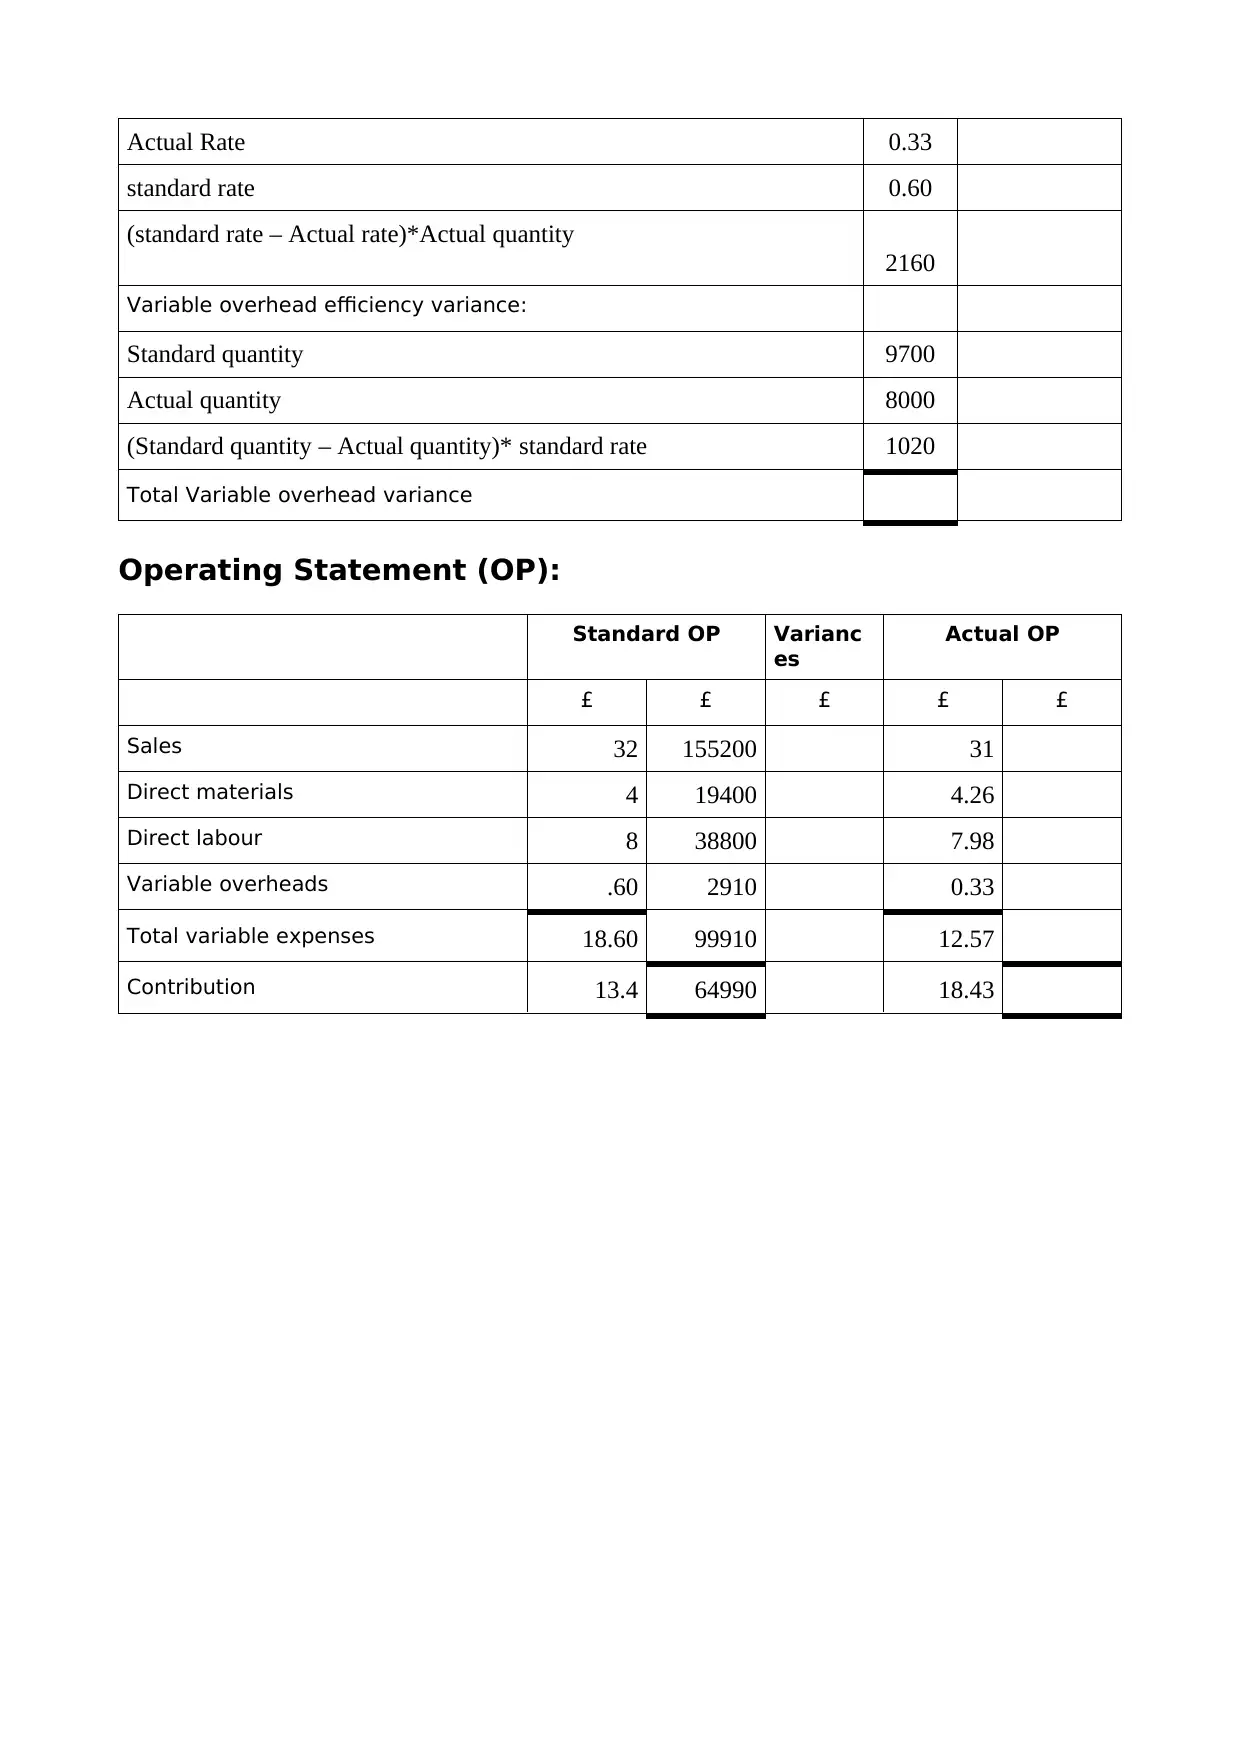
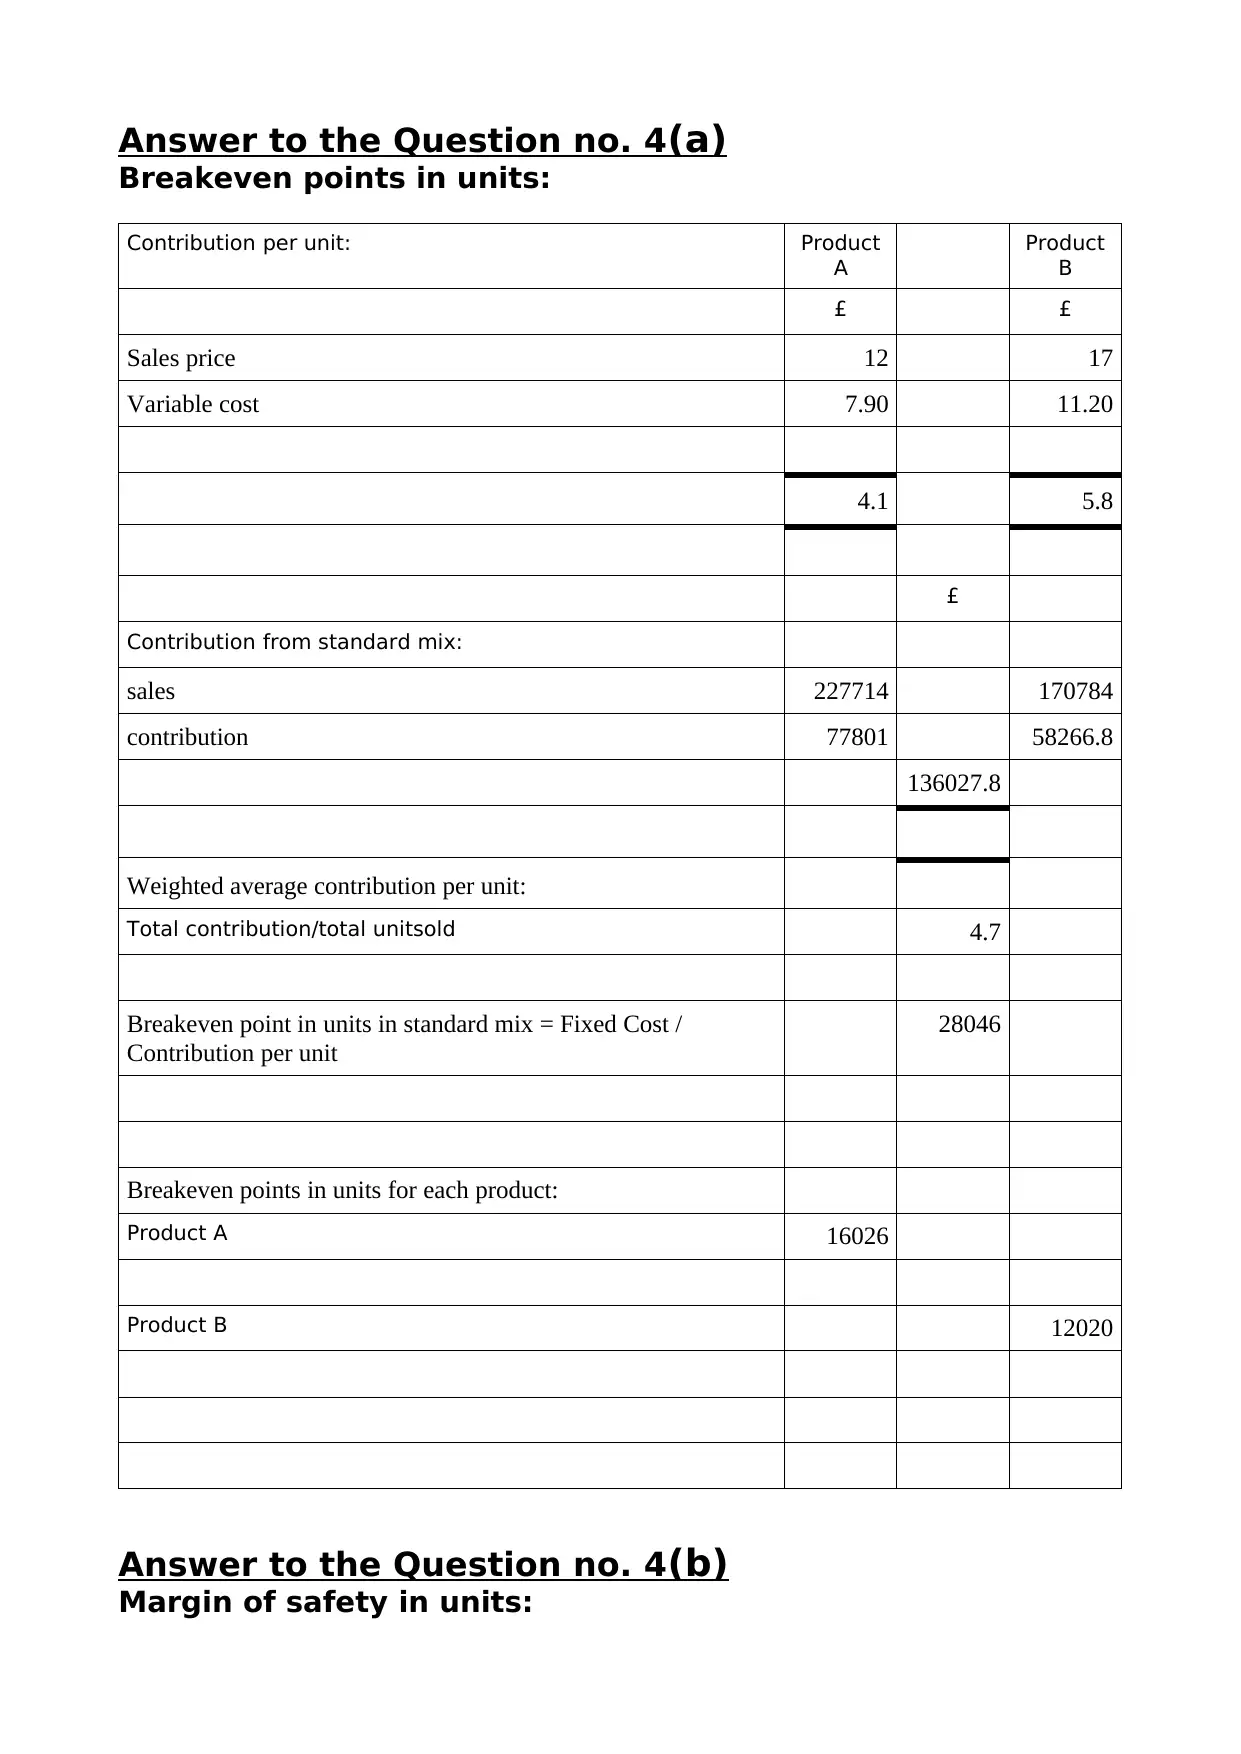
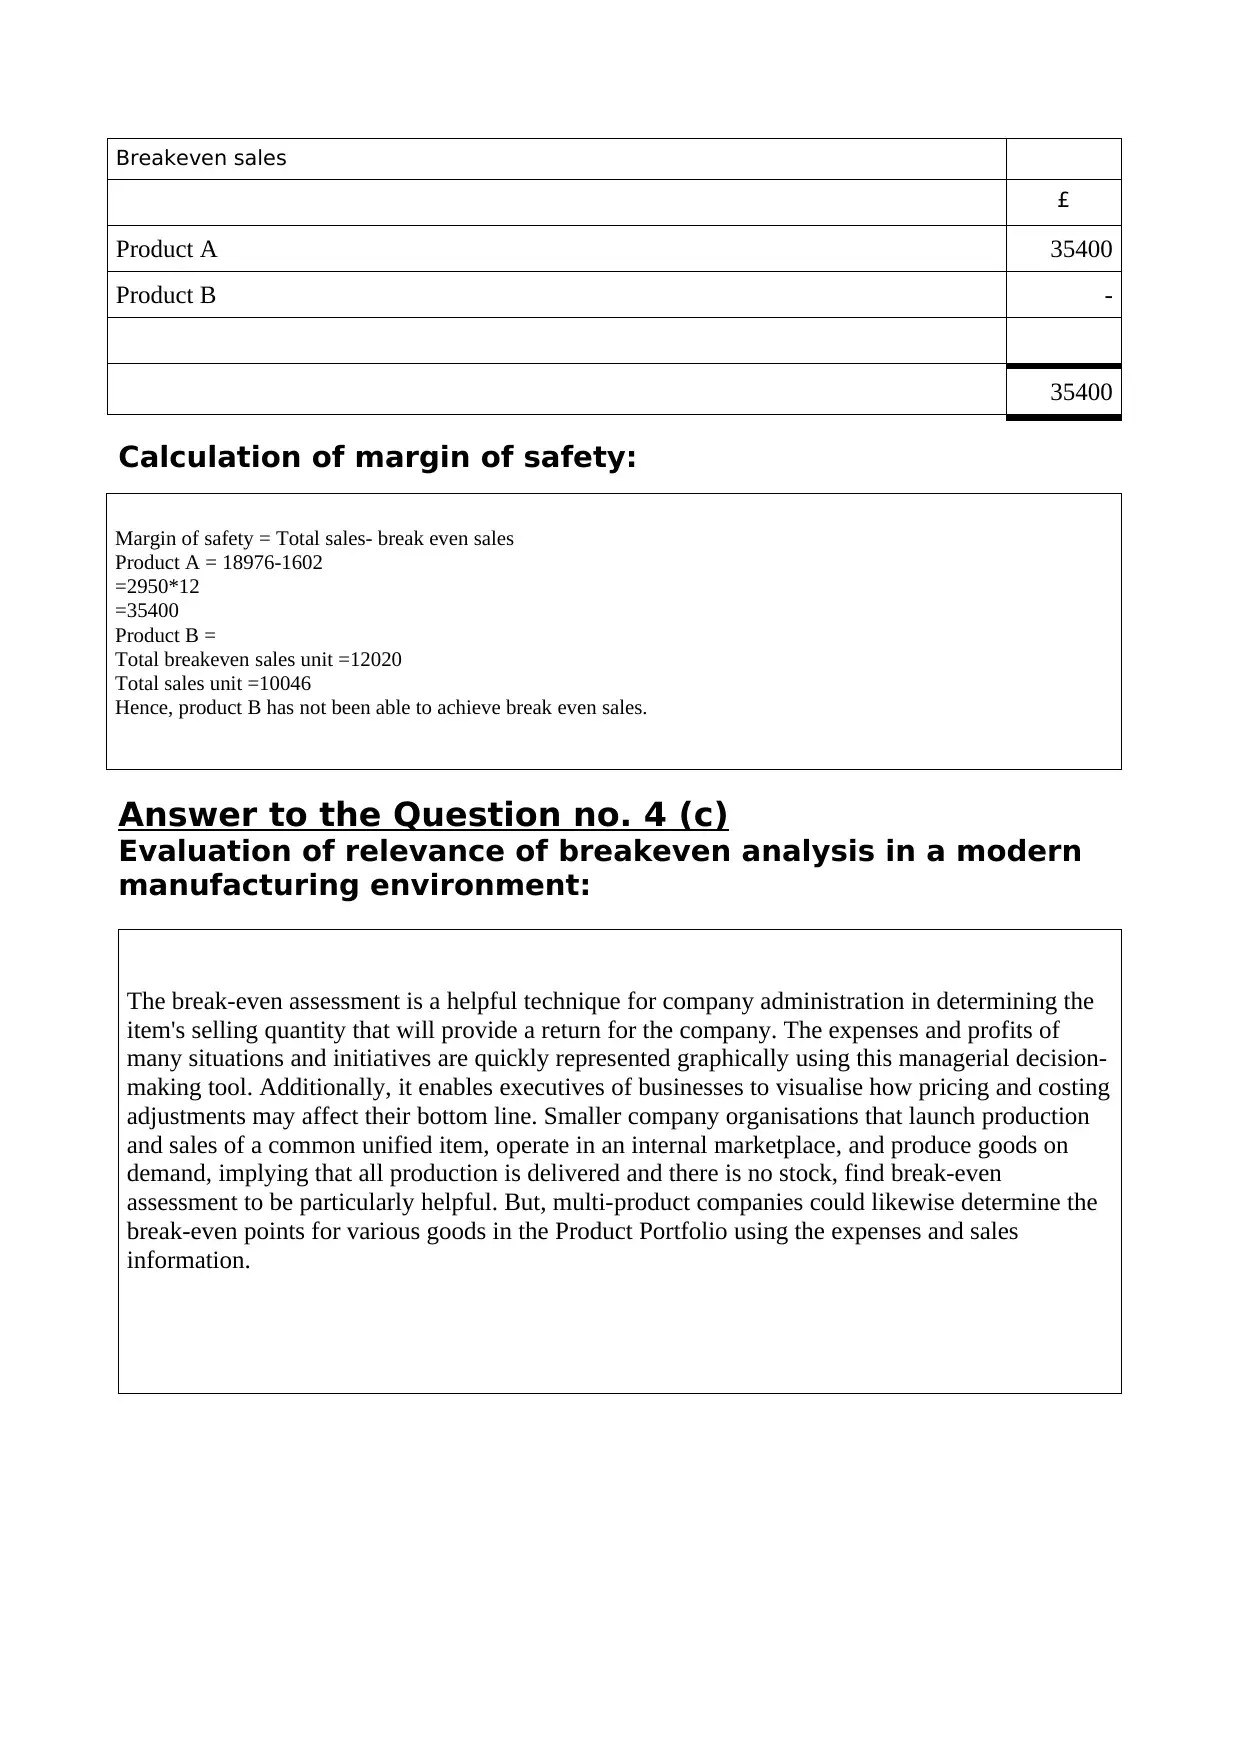
This assignment solution covers key aspects of financial management and decision-making. It begins with the calculation of payback periods and net present values (NPV) for different projects, analyzing their viability and comparing their profitability. The solution then delves into ratio analysis, calculating and interpreting various financial ratios like gross profit margin, operating profit margin, return on capital employed, and liquidity ratios, to assess a company's performance over two years. Variance analysis is also performed, including sales, direct material, direct labor, and variable overhead variances, to evaluate the differences between budgeted and actual performance. Breakeven analysis is applied to determine breakeven points and margin of safety for product lines, along with an evaluation of its relevance in modern manufacturing. Finally, the assignment outlines the steps involved in setting a financial and cost controlling budget within a large organization. The assignment demonstrates a solid understanding of financial principles and their practical application.

1 out of 11
Related Documents


Your All-in-One AI-Powered Toolkit for Academic Success.
+13062052269
info@desklib.com
Available 24*7 on WhatsApp / Email
![[object Object]](/_next/static/media/star-bottom.7253800d.svg)
Copyright © 2020–2026 A2Z Services. All Rights Reserved. Developed and managed by ZUCOL.