Finance Assignment: Cost of Capital, Capital Budgeting, Risk & Return

Verified

Added on  2021/04/21

|13
|2405
|434
Homework Assignment
AI Summary
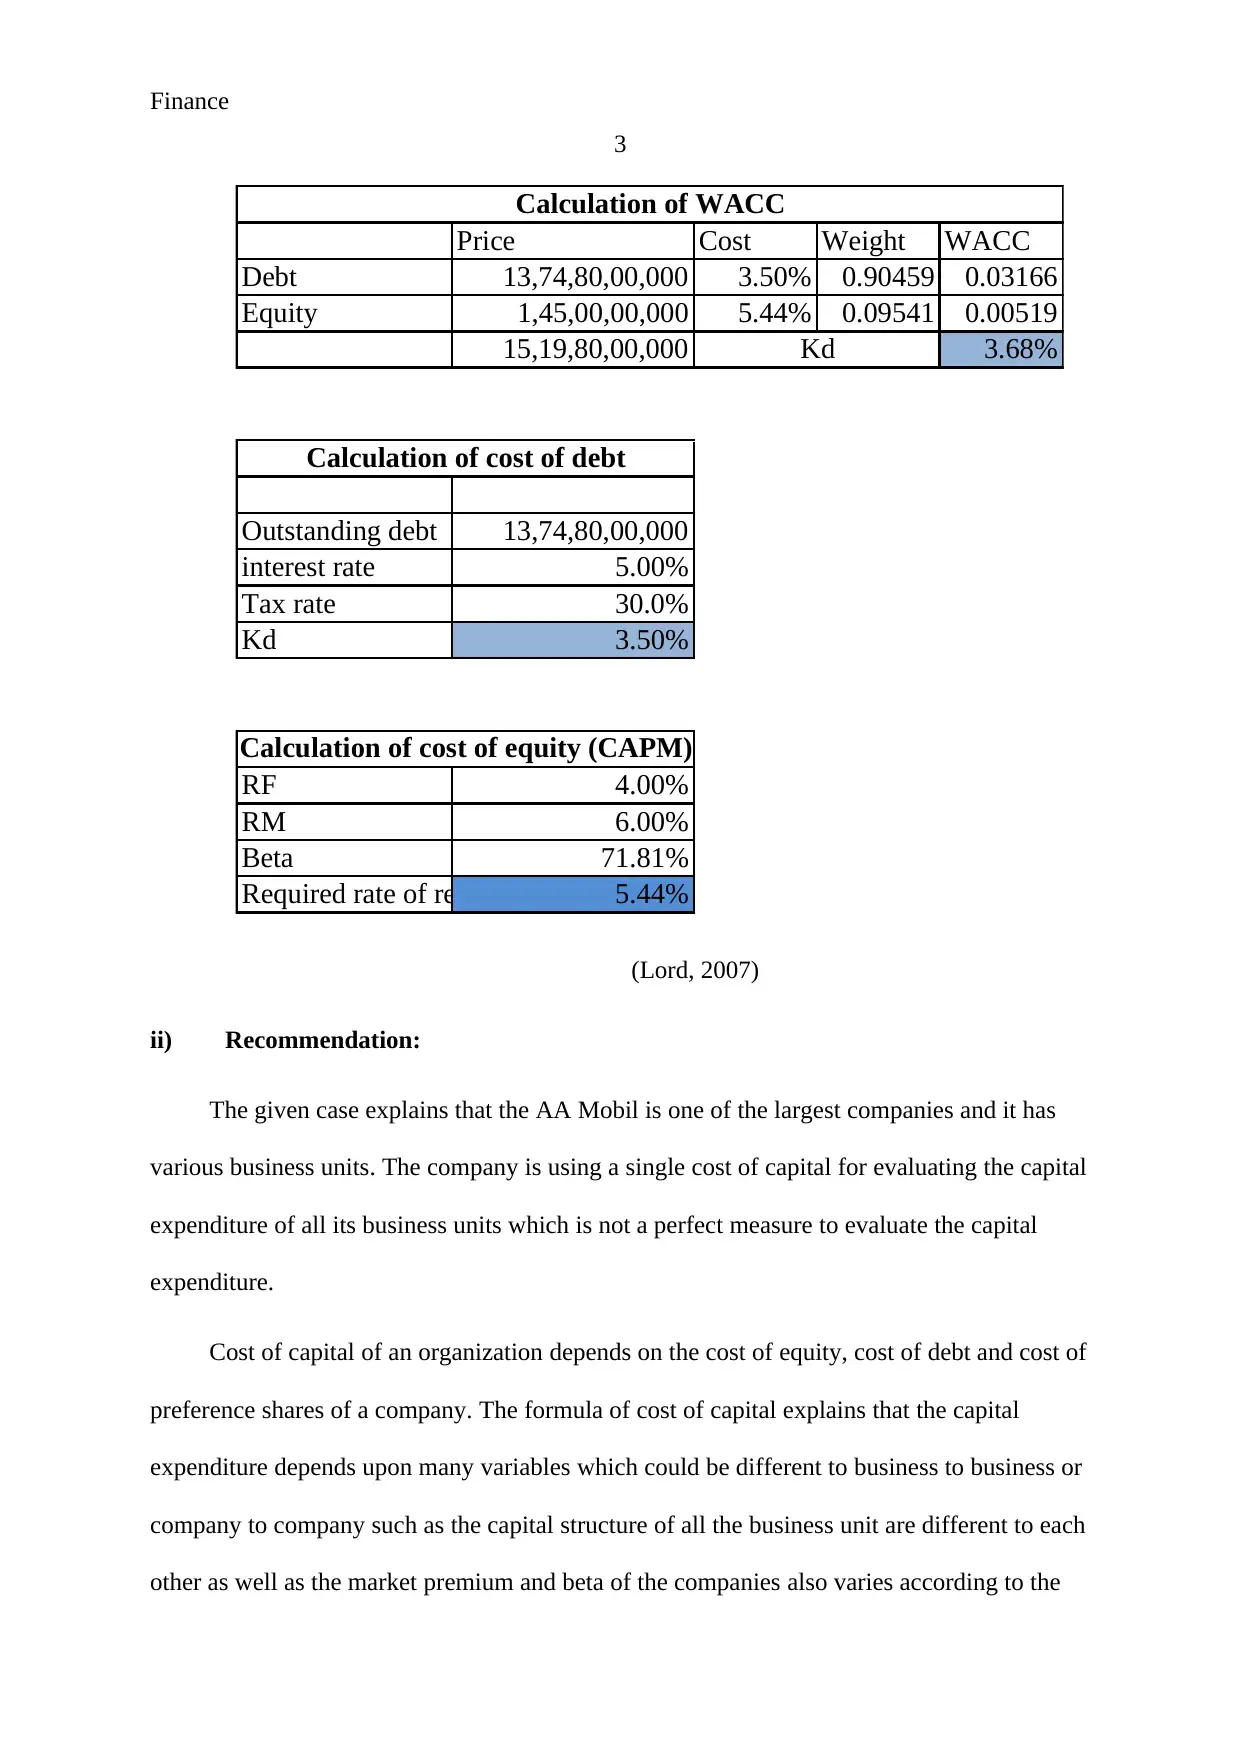
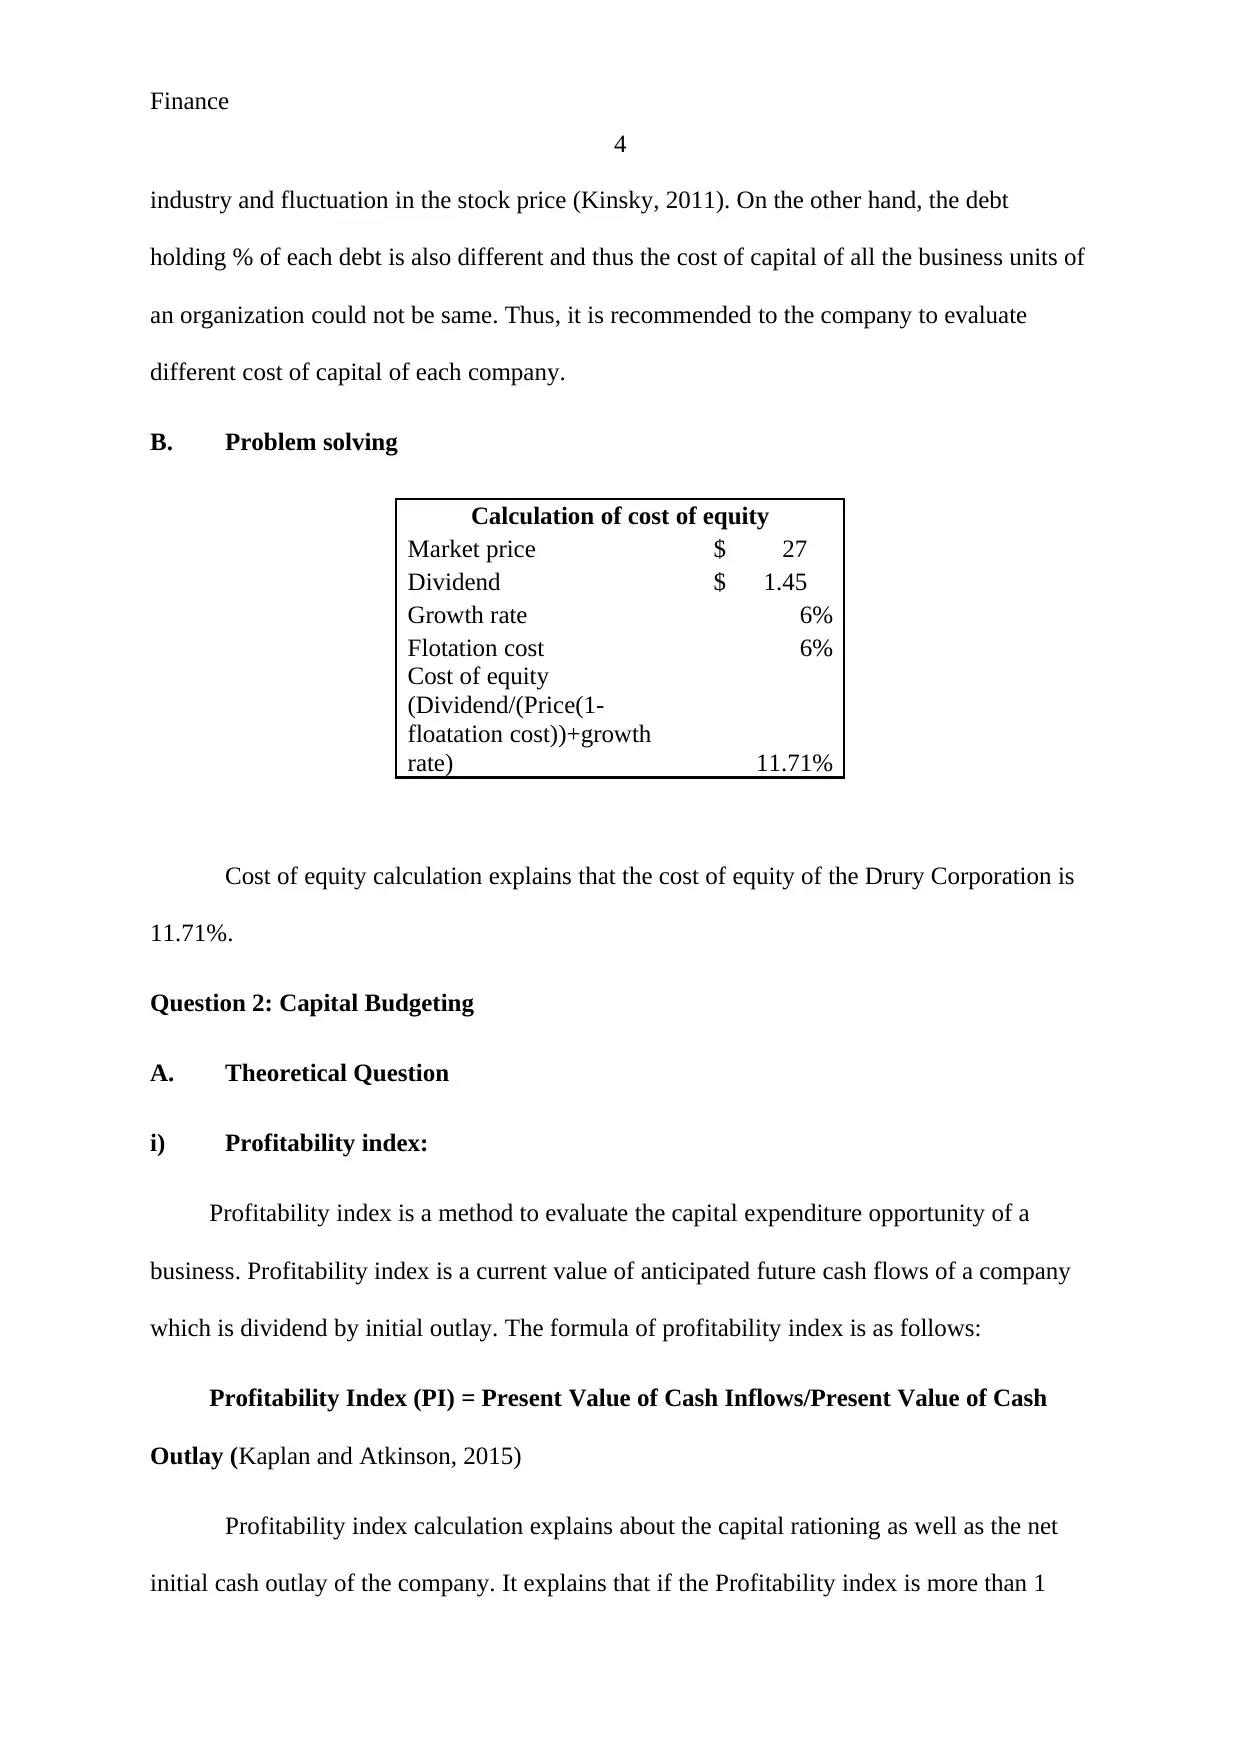
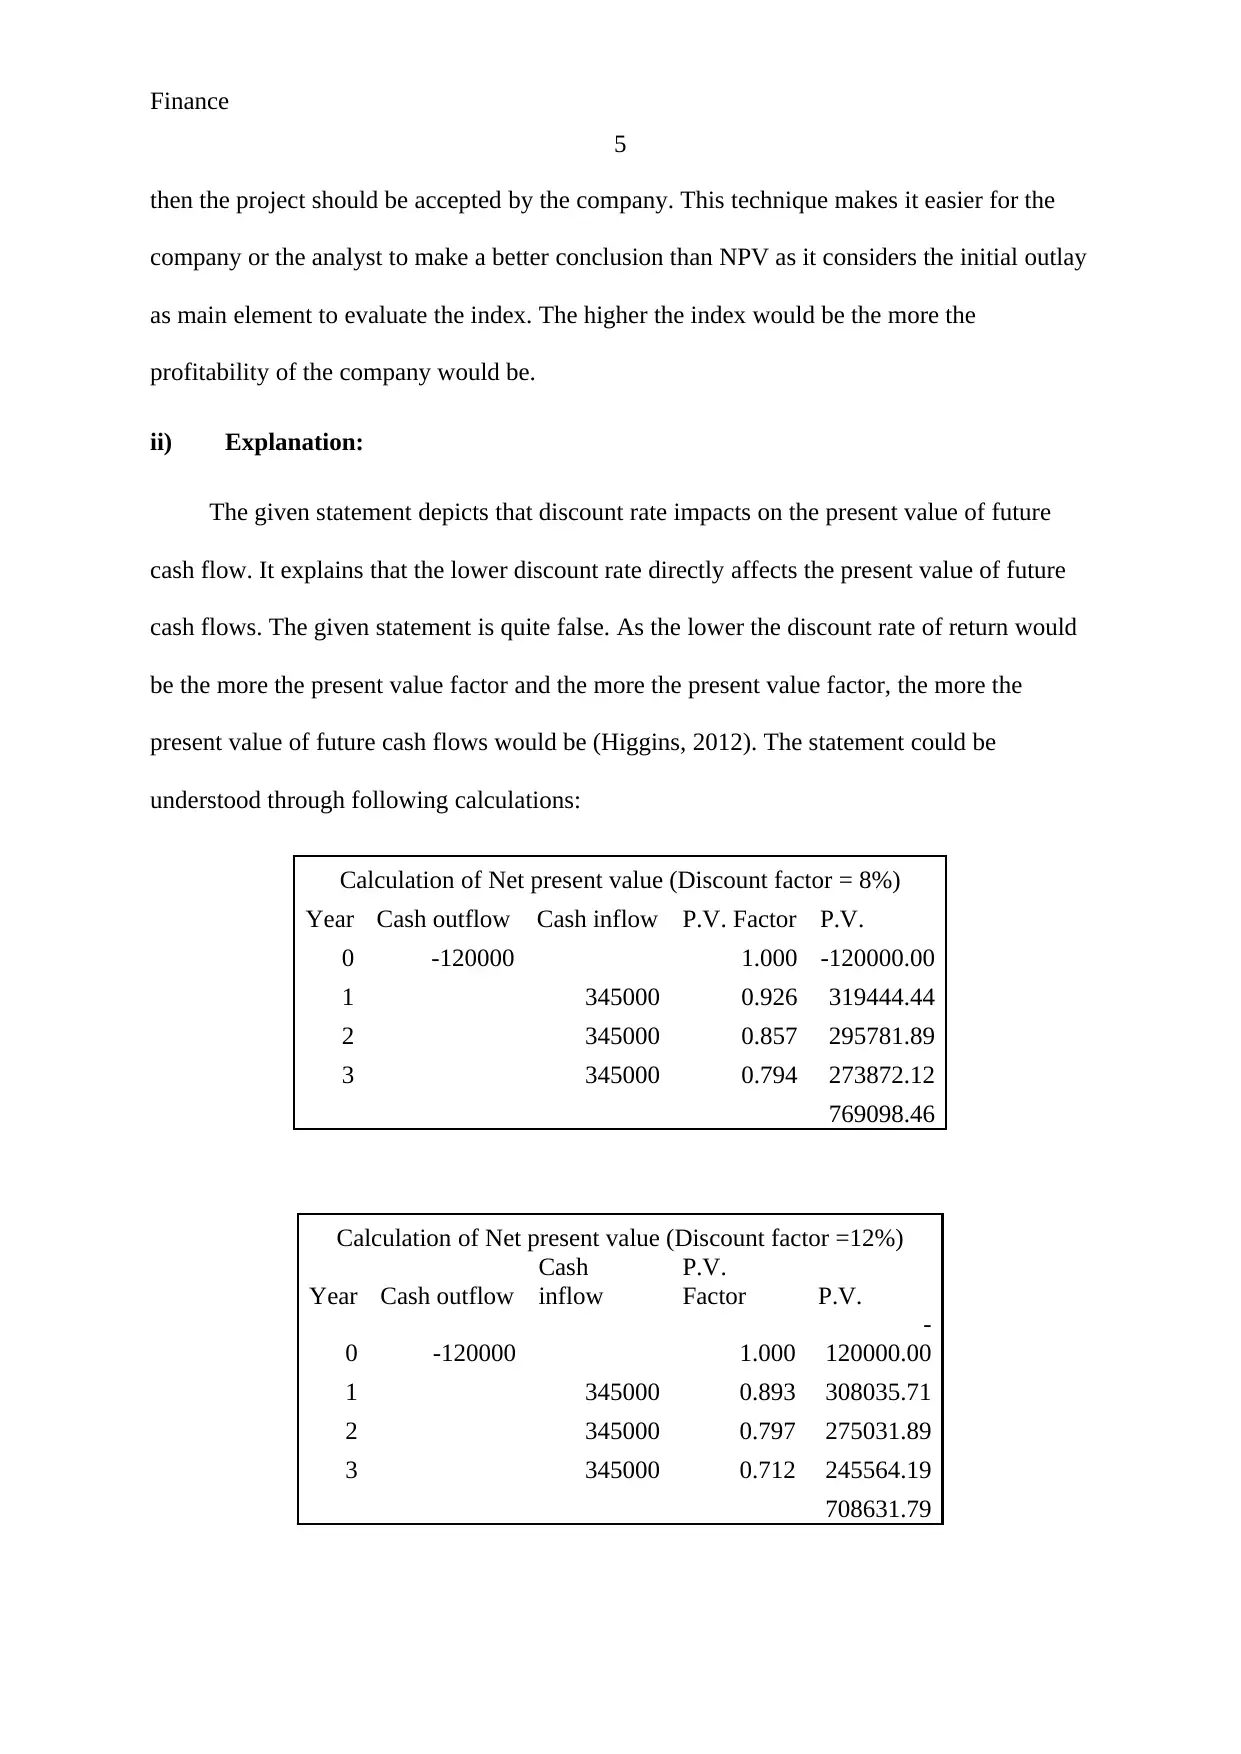
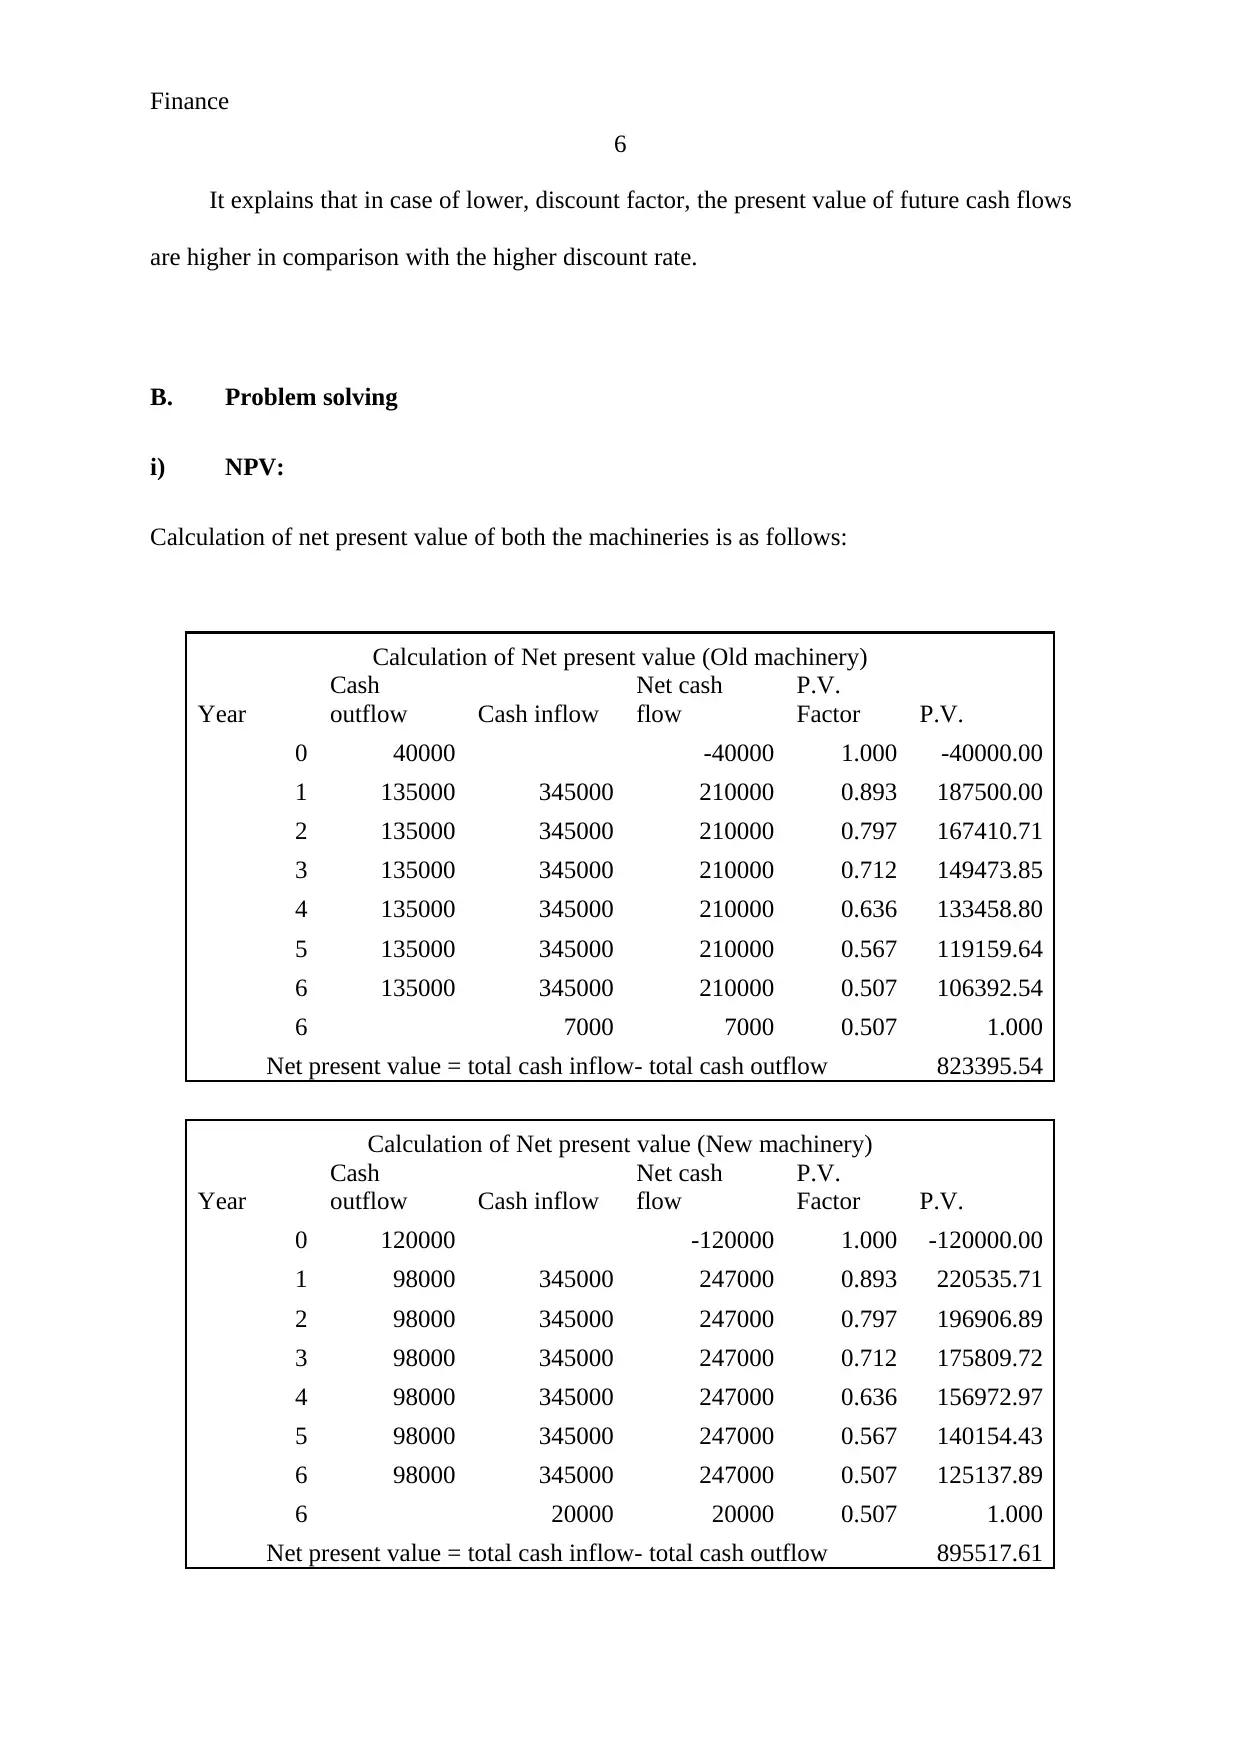
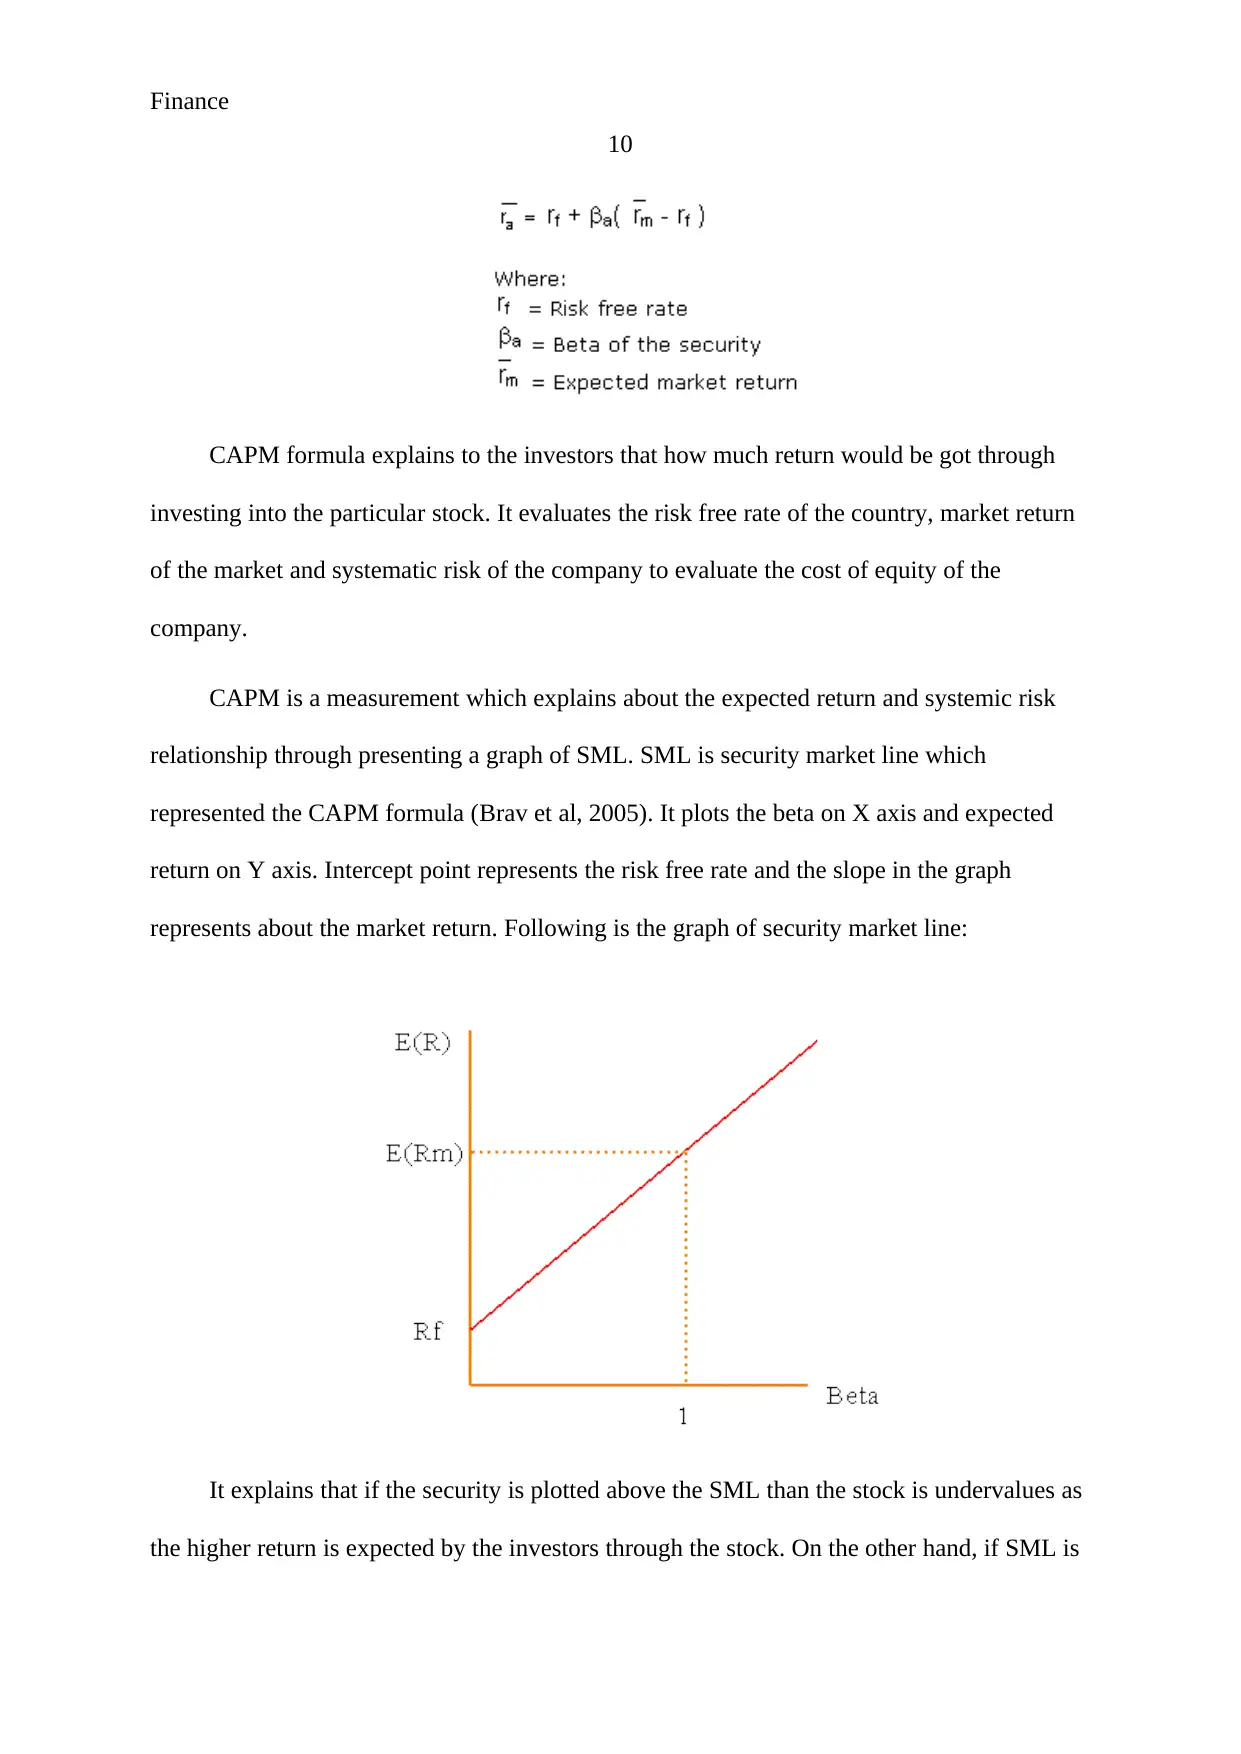
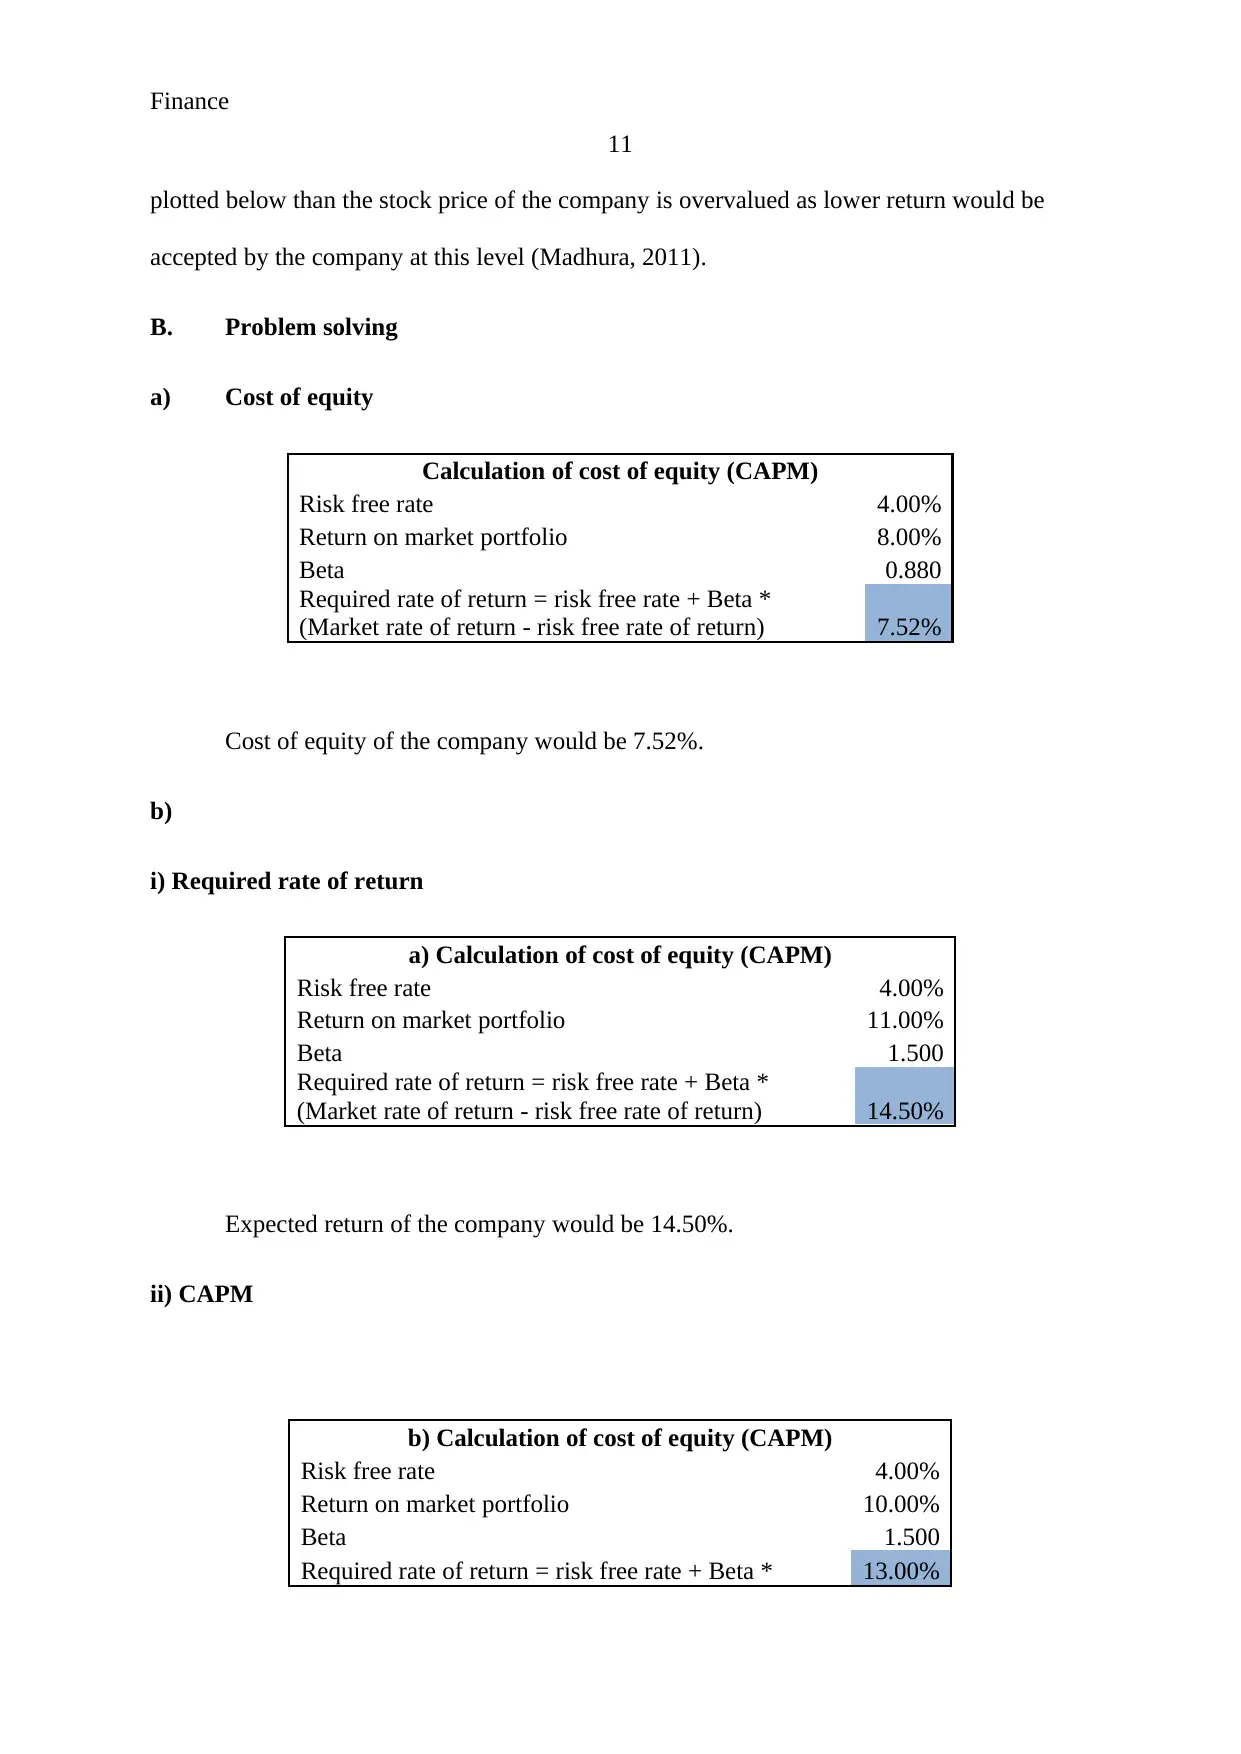
This assignment solution addresses key concepts in finance, including the cost of capital, capital budgeting, and risk and return analysis. The first section delves into capital structure, target capital structure, and the importance of evaluating the weighted average cost of capital (WACC) for different business units. It also provides a calculation of the cost of equity. The second section focuses on capital budgeting techniques, specifically the profitability index and net present value (NPV), with calculations for both. It analyzes how discount rates impact present values and discusses qualitative factors in machinery replacement decisions. The third section explores risk and return, differentiating between systematic and unsystematic risk and explaining the Capital Asset Pricing Model (CAPM). It includes calculations for the cost of equity using CAPM and provides investment recommendations based on expected returns. The assignment utilizes formulas, calculations, and theoretical explanations to provide a thorough understanding of financial management principles.
Document Page
Running Head: Finance
1
tabler-icon-diamond-filled.svg

Paraphrase This Document

Need a fresh take? Get an instant paraphrase of this document with our AI Paraphraser
Document Page
Finance
2
Question 1: Cost of capital
A. Theoretical Question
i) Capital structure:
Capital structure is the combination of different sources of finance which has been used
by the company to run its operations effectively. On the other hand, target capital structure is
the future prediction of the sources. Capital structure and target capital structure of an
organization is quite helpful for the analyst and the management of the company to evaluate
the weighted average cost of capital. Capital structure is a process which evaluates the total
weight of the funds of the company and the total cost of equity and debt that finally leads to
the cost of capital of the company (Oliver and Schoff, 2017).
Without evaluating the capital structure and target capital structure, it is not possible
for an organization to identify the total cost as before evaluating the total cost, it is required
for the organization to identify the total sources which have been used by the company to
raise the funds which could be evaluated through analyzing the capital structure of the
company. Following formula could make it easier to understand that why capital structure is
quite significant to evaluate the total WACC of the company:
Document Page
Finance
3
Price Cost Weight WACC
Debt 13,74,80,00,000 3.50% 0.90459 0.03166
Equity 1,45,00,00,000 5.44% 0.09541 0.00519
15,19,80,00,000 3.68%
Outstanding debt 13,74,80,00,000
interest rate 5.00%
Tax rate 30.0%
Kd 3.50%
RF 4.00%
RM 6.00%
Beta 71.81%
Required rate of return 5.44%
Calculation of WACC
Kd
Calculation of cost of debt
Calculation of cost of equity (CAPM)
(Lord, 2007)
ii) Recommendation:
The given case explains that the AA Mobil is one of the largest companies and it has
various business units. The company is using a single cost of capital for evaluating the capital
expenditure of all its business units which is not a perfect measure to evaluate the capital
expenditure.
Cost of capital of an organization depends on the cost of equity, cost of debt and cost of
preference shares of a company. The formula of cost of capital explains that the capital
expenditure depends upon many variables which could be different to business to business or
company to company such as the capital structure of all the business unit are different to each
other as well as the market premium and beta of the companies also varies according to the
Document Page
Finance
4
industry and fluctuation in the stock price (Kinsky, 2011). On the other hand, the debt
holding % of each debt is also different and thus the cost of capital of all the business units of
an organization could not be same. Thus, it is recommended to the company to evaluate
different cost of capital of each company.
B. Problem solving
Calculation of cost of equity
Market price $ 27
Dividend $ 1.45
Growth rate 6%
Flotation cost 6%
Cost of equity
(Dividend/(Price(1-
floatation cost))+growth
rate) 11.71%
Cost of equity calculation explains that the cost of equity of the Drury Corporation is
11.71%.
Question 2: Capital Budgeting
A. Theoretical Question
i) Profitability index:
Profitability index is a method to evaluate the capital expenditure opportunity of a
business. Profitability index is a current value of anticipated future cash flows of a company
which is dividend by initial outlay. The formula of profitability index is as follows:
Profitability Index (PI) = Present Value of Cash Inflows/Present Value of Cash
Outlay (Kaplan and Atkinson, 2015)
Profitability index calculation explains about the capital rationing as well as the net
initial cash outlay of the company. It explains that if the Profitability index is more than 1
tabler-icon-diamond-filled.svg

Paraphrase This Document

Need a fresh take? Get an instant paraphrase of this document with our AI Paraphraser
Document Page
Finance
5
then the project should be accepted by the company. This technique makes it easier for the
company or the analyst to make a better conclusion than NPV as it considers the initial outlay
as main element to evaluate the index. The higher the index would be the more the
profitability of the company would be.
ii) Explanation:
The given statement depicts that discount rate impacts on the present value of future
cash flow. It explains that the lower discount rate directly affects the present value of future
cash flows. The given statement is quite false. As the lower the discount rate of return would
be the more the present value factor and the more the present value factor, the more the
present value of future cash flows would be (Higgins, 2012). The statement could be
understood through following calculations:
Calculation of Net present value (Discount factor = 8%)
Year Cash outflow Cash inflow P.V. Factor P.V.
0 -120000 1.000 -120000.00
1 345000 0.926 319444.44
2 345000 0.857 295781.89
3 345000 0.794 273872.12
769098.46
Calculation of Net present value (Discount factor =12%)
Year Cash outflow
Cash
inflow
P.V.
Factor P.V.
0 -120000 1.000
-
120000.00
1 345000 0.893 308035.71
2 345000 0.797 275031.89
3 345000 0.712 245564.19
708631.79
Document Page
Finance
6
It explains that in case of lower, discount factor, the present value of future cash flows
are higher in comparison with the higher discount rate.
B. Problem solving
i) NPV:
Calculation of net present value of both the machineries is as follows:
Calculation of Net present value (Old machinery)
Year
Cash
outflow Cash inflow
Net cash
flow
P.V.
Factor P.V.
0 40000 -40000 1.000 -40000.00
1 135000 345000 210000 0.893 187500.00
2 135000 345000 210000 0.797 167410.71
3 135000 345000 210000 0.712 149473.85
4 135000 345000 210000 0.636 133458.80
5 135000 345000 210000 0.567 119159.64
6 135000 345000 210000 0.507 106392.54
6 7000 7000 0.507 1.000
Net present value = total cash inflow- total cash outflow 823395.54
Calculation of Net present value (New machinery)
Year
Cash
outflow Cash inflow
Net cash
flow
P.V.
Factor P.V.
0 120000 -120000 1.000 -120000.00
1 98000 345000 247000 0.893 220535.71
2 98000 345000 247000 0.797 196906.89
3 98000 345000 247000 0.712 175809.72
4 98000 345000 247000 0.636 156972.97
5 98000 345000 247000 0.567 140154.43
6 98000 345000 247000 0.507 125137.89
6 20000 20000 0.507 1.000
Net present value = total cash inflow- total cash outflow 895517.61
Document Page
Finance
7
The above calculation briefs that the net present value of old machinery would be $
8,23,395.54 and net present value of new machinery would be $ 8,95,517.61. It explains that
the new machinery would offer huge return to the company in context with the old machinery
and thus, it is recommended to the company to buy new machinery for efficient and effective
use.
ii) Qualitative differences:
If there are few qualitative difference among both the machineries than the
management is required to consider and evaluate the following factors before making any
decision about the replacement:
Mass production
Flexibility
Fixed cost
Machine intelligence
Labour friendly
Safety purpose
Production speed
Scrap level etc (Hillier, Grinblatt and Titman, 2011)
These factors are required to be considered by the management of the company and
must make the decision about the machineries accordingly.
Question 3: Risk and return
tabler-icon-diamond-filled.svg

Paraphrase This Document

Need a fresh take? Get an instant paraphrase of this document with our AI Paraphraser
Document Page
Finance
8
A. Theoretical Question
i) Systematic risk and unsystematic risk:
Systematic risk and unsystematic risk part of investment risk in an organization.
Systematic risk consist the fluctuation in the stock price on daily basis. Systematic risk is an
outcome of uncontrollable and external variables that are not related to industry or a specific
market and it affects the entire stock of the company.
On the other hand, unsystematic risk depicts the risk that emerges out of known and
controlled variables which are specifically related to the industry and the market.
Unsystematic risk could be eliminated from the market whereas the systematic risk could not
be eliminated.
Basis for comparison Systematic risk Unsystematic risk
Meaning It is refers to the hazard that
is linked with the market
segment or market as a
whole.
It refers to the associated risk
with a particular industry,
company or security.
Nature Uncontrollable Controllable
Protection Asset allocation Portfolio diversification
Factors External factors Internal factors
Further, an investor should not expect any extra return from unsystematic risk as if
investors would get extra return to bear the unsystematic risk that the portfolios which are
Document Page
Finance
9
made up of many stocks along with huge unsystematic risk would provide large returns to the
investors equally with the risk portfolios with lesser unsystematic risk (Brown, Beekes and
Verhoeven, 2011). Unsystematic risk depicts the risk that emerges out of known and
controlled variables which are specifically related to the industry and the market. The process
of unsystematic risk explains that if bearing the unsystematic risk would offer huge return to
the investors than they would never bear the systemic risk and would always invest into the
portfolios.
It has been found that the investors who are bearing systematic risk are only liable for
the extra return and that return also based upon the stock price and the performance of the
company.
ii) CAPM:
CAPM is capital asset pricing model which describes about the systematic risk and
expected return relation among the expected return and systemic risk of particular stock and
assets. Capital asset pricing model is widely used by the analyst, investors and management
of the company to evaluate the cost of equity of the company. Following is the formula of
capital asset pricing model:
Document Page
Finance
10
CAPM formula explains to the investors that how much return would be got through
investing into the particular stock. It evaluates the risk free rate of the country, market return
of the market and systematic risk of the company to evaluate the cost of equity of the
company.
CAPM is a measurement which explains about the expected return and systemic risk
relationship through presenting a graph of SML. SML is security market line which
represented the CAPM formula (Brav et al, 2005). It plots the beta on X axis and expected
return on Y axis. Intercept point represents the risk free rate and the slope in the graph
represents about the market return. Following is the graph of security market line:
It explains that if the security is plotted above the SML than the stock is undervalues as
the higher return is expected by the investors through the stock. On the other hand, if SML is
tabler-icon-diamond-filled.svg

Paraphrase This Document

Need a fresh take? Get an instant paraphrase of this document with our AI Paraphraser
Document Page
Finance
11
plotted below than the stock price of the company is overvalued as lower return would be
accepted by the company at this level (Madhura, 2011).
B. Problem solving
a) Cost of equity
Calculation of cost of equity (CAPM)
Risk free rate 4.00%
Return on market portfolio 8.00%
Beta 0.880
Required rate of return = risk free rate + Beta *
(Market rate of return - risk free rate of return) 7.52%
Cost of equity of the company would be 7.52%.
b)
i) Required rate of return
a) Calculation of cost of equity (CAPM)
Risk free rate 4.00%
Return on market portfolio 11.00%
Beta 1.500
Required rate of return = risk free rate + Beta *
(Market rate of return - risk free rate of return) 14.50%
Expected return of the company would be 14.50%.
ii) CAPM
b) Calculation of cost of equity (CAPM)
Risk free rate 4.00%
Return on market portfolio 10.00%
Beta 1.500
Required rate of return = risk free rate + Beta * 13.00%
Document Page
Finance
12
(Market rate of return - risk free rate of return)
Expected return of the company would be 13%.
iii) Recommendation
The above calculation express that the expected return of the stock is 13% and the
expected return of the investor is 11% which explains that the investor should invest into the
stock as this stock would offer higher return than the expected return by the investors.
chevron_up_icon
1 out of 13
circle_padding
hide_on_mobile
zoom_out_icon
[object Object]