Financial Analysis and Management Report: Balfour Beatty PLC
VerifiedAdded on 2023/03/17
|23
|6145
|73
Report
AI Summary
This report provides a comprehensive financial analysis of Balfour Beatty PLC, a UK-based infrastructure company. The report begins with an introduction to the company, including its business model, market position, and recent events. Part A covers the company's history, business operations, and major competitors. Part B delves into a critical review of Balfour Beatty's financial performance over a five-year period, calculating and evaluating key financial ratios such as liquidity, profitability, gearing, and efficiency. The analysis includes comparisons to competitors and sector averages. The report also offers recommendations for improving the company's financial management. Finally, Part C addresses investment appraisal techniques to evaluate two hypothetical projects. The report utilizes data from the company's annual reports and provides a detailed assessment of its financial health and strategic position in the market.

FINANCIAL MANAGEMENT1
Financial management
By (Name)
Course
Instructor’s Name
Institutional Affiliation
The City and State
The Date
Financial management
By (Name)
Course
Instructor’s Name
Institutional Affiliation
The City and State
The Date
Paraphrase This Document
Need a fresh take? Get an instant paraphrase of this document with our AI Paraphraser
FINANCIAL MANAGEMENT2
Introduction
Part A
Balfour Beatty PLC is a world-wide infrastructural company. The company is
headquartered in the UK. The company engages in the provision of construction services,
support services as well infrastructural investments. The company is involved in works across
the UK, the United States, Ireland, south and east Asia as well as Canada. Balfour Beatty was
incorporated in the 1909. It was started with a total capital of £50,000.00 (Schündeln, 2012).
George Balfour the engineer and his friend Andrew Beatty the accountant spear headed the
formation of the company (Halstead, 2012). The initial focus of the company was to deal with
tramways where their first contract included the construction of the Dunfermline and District
Tramways (Prior, 2017). Balfour Beatty played major part in the initiation, planning and
advancement of Scotland’s hydroelectric power, the construction of dams, power stations as well
creation of transmission lines (King, 2015). Balfour Beatty has attained tremendous success over
the years to the extent that by the end of September 2018, the company had grown to a rank of
the biggest construction company in the UK (Brodie, 2008). The company operates a business
model where its services are divided into three segments. The segments include the construction
service segment, the support service segment and the infrastructure development segment
(O’sullivan and Sheffrin, 2003). The construction service segment involves the physical
constructions of assets, while the support service segments engages in the provision of support to
the existing functions of assets (Roth, 2012). Some of these support services include asset
maintenance as well as renovation. In terms of the segment for Infrastructural Investments, it
engages in the procurement as well as disposal of the infrastructural assets (Huston, 2015).
These usually include the roads, the hospitals, military housings, waste as well as well as
FINANCIAL MANAGEMENT3
biomass among other investments. The Infrastructure Investments segments also entails the
division for housing development (Menary, 2018). The business has been involved in the
management of construction business in both the UK and the USA. The company’s long-
standing strategy is to engage in the development of its business operations through foreign
expansion, acquisitions as well as disposals (Rob, 2009). The company’s fundamental aim is to
be a market leader through the development of both short and long term customer relationships
through sufficiently developed supply chains (Bill, 2008).
Balfour Beatty has investments across various markets. These are diversified through
both industry and geography (Obaidat and Al-Hajaia, 2013). Such a broad perspective alongside
focused industrial expertise as well as knowledge for every single market served ensures that
there is extra values in terms of the company and client relationships (Diaz, 2012). The company
operates within the UK, the USA, Canada, Ireland, Scotland, south and Middle East Asia and in
other oversee countries. Balfour Beatty has a number of competitors and some of the major ones
include Katerra. Hensel Phelps Construction, Fluor, Bechtel Corporation, Interserve and Costain
Group. Although, it has to be noted that Balfour has continued to position its self within the
market in manner that it can best defend its self against the competitive market forces and also
influence the forces in its favour( McConnell, 2009). The organisation is highly flexible and
adaptable in a way that it is able to change with the changing market environment (Slee, 2011). It
is because of such flexibility and adaptability that the company has managed to remain
sustainably competitive in spite of the enormous cut throat competitive within the market (Baron
and Michael, 2012).
Some of the major events to have taken place in the company over the past five years
include the resignation of Martin Chown, the company’s UK procurement director. There have
⊘ This is a preview!⊘
Do you want full access?
Subscribe today to unlock all pages.
Trusted by 1+ million students worldwide
FINANCIAL MANAGEMENT4
also been accusations levied against Balfour Beatty on account of a series of labour abuses of
migrant workers that the company employees on a large scale basis. In the same manner, in the
month of august of the year 2014, the corporation did rebuff three proposals provided by their
competitor within the UK. The offer included a request for the two companies to form a merger
(Clarkson, 2010). The last bid which had put Balfour Beatty at a valuation of two billion pounds
was solidly vetoed by company’s board on the 20th /8/ 2014. Another major event took place on
the 22nd/1/ 2016 where the high court did order 30 construction firms to make a disclosure of all
the emails as well as correspondences associated with blacklisting by 12th/12/ 2016. This was
after it had appeared that supervisors at Balfour Beatty had made to reference to excluded
employees as sheep. Although, the company did agree some settlements on 11/5/2016 and an
official apology by forty firms implicated was pronounced in court before closing the case.
Part B
Company’s financial performances
Balfour Beatty PLC has current assets amounting to £2.33 Billion. This amount is big
enough to cover the company’s total liabilities valued at £966 Million (Hamilton, et al. 2011).
The implication for this kind of financial position is that the company is able to meet its financial
obligations. There is therefore no need for any potential investors to worry about the company’s
debt to equity ratio (Huang and Diewert, 2011). As much as any company’s operating cash flows
are of critical importance, it is the earnings which indicate the level of profitability of the
company (Alexander, 2015). This is usually after it has accounted for its overall gains as well as
losses for none core aspects and the non-cash expenditures. Beatty PLC does earn much more
interest than it pays out. In spite of the debt-to-equity ratio of the company being greater than
40%, the company looks to be in a sound financial condition (Hoskins, 2009). This is particularly
Paraphrase This Document
Need a fresh take? Get an instant paraphrase of this document with our AI Paraphraser
FINANCIAL MANAGEMENT5
the case when the company’s earnings and current assets are compared against its interest
payments as well as overall liabilities correspondingly. The company can continue to be strong
by maintain a healthy operating cash flow. The company did experience a fall in the cash
reserves in 2018 to a tune of negative 307.0 million. Although, the company earned a cash flow
from its investment activities of 150.0 million. The implication in this case is that the company
did earn more from selling its present assets than the expenditure it incurred while purchasing
other assets (Richardson, 2006). Additionally, the company did use 130.0Millions for operations
while the cash spent for financing the operations totalled 349.0 million. Year after year there was
an increase in both earnings and dividends per share excluding extraordinary items at a rate of
33.3% and 4.0%, correspondingly. The positive trend in growth related to dividend payments is a
critical indicator because there only a handful of companies within the construction industry that
pay dividends.
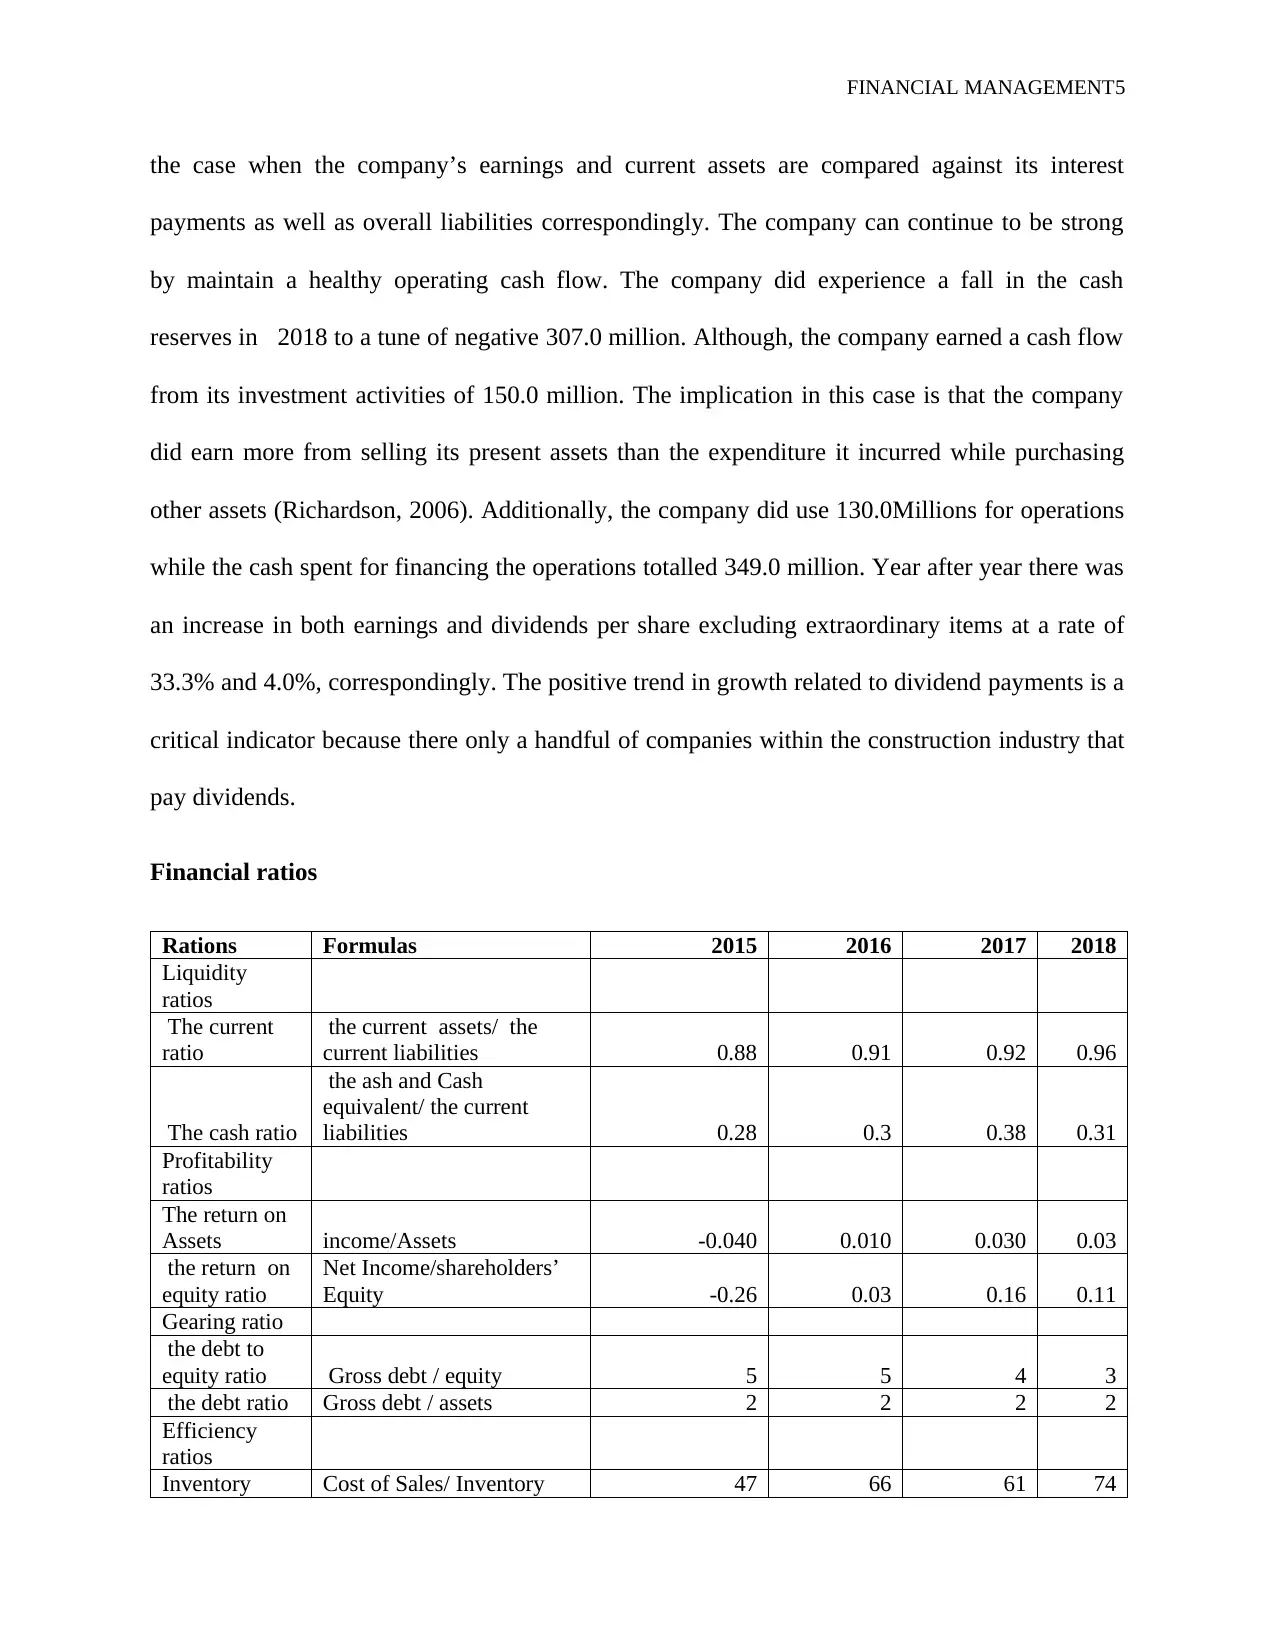
Financial ratios
Rations Formulas 2015 2016 2017 2018
Liquidity
ratios
The current
ratio
the current assets/ the
current liabilities 0.88 0.91 0.92 0.96
The cash ratio
the ash and Cash
equivalent/ the current
liabilities 0.28 0.3 0.38 0.31
Profitability
ratios
The return on
Assets income/Assets -0.040 0.010 0.030 0.03
the return on
equity ratio
Net Income/shareholders’
Equity -0.26 0.03 0.16 0.11
Gearing ratio
the debt to
equity ratio Gross debt / equity 5 5 4 3
the debt ratio Gross debt / assets 2 2 2 2
Efficiency
ratios
Inventory Cost of Sales/ Inventory 47 66 61 74
the case when the company’s earnings and current assets are compared against its interest
payments as well as overall liabilities correspondingly. The company can continue to be strong
by maintain a healthy operating cash flow. The company did experience a fall in the cash
reserves in 2018 to a tune of negative 307.0 million. Although, the company earned a cash flow
from its investment activities of 150.0 million. The implication in this case is that the company
did earn more from selling its present assets than the expenditure it incurred while purchasing
other assets (Richardson, 2006). Additionally, the company did use 130.0Millions for operations
while the cash spent for financing the operations totalled 349.0 million. Year after year there was
an increase in both earnings and dividends per share excluding extraordinary items at a rate of
33.3% and 4.0%, correspondingly. The positive trend in growth related to dividend payments is a
critical indicator because there only a handful of companies within the construction industry that
pay dividends.
Financial ratios
Rations Formulas 2015 2016 2017 2018
Liquidity
ratios
The current
ratio
the current assets/ the
current liabilities 0.88 0.91 0.92 0.96
The cash ratio
the ash and Cash
equivalent/ the current
liabilities 0.28 0.3 0.38 0.31
Profitability
ratios
The return on
Assets income/Assets -0.040 0.010 0.030 0.03
the return on
equity ratio
Net Income/shareholders’
Equity -0.26 0.03 0.16 0.11
Gearing ratio
the debt to
equity ratio Gross debt / equity 5 5 4 3
the debt ratio Gross debt / assets 2 2 2 2
Efficiency
ratios
Inventory Cost of Sales/ Inventory 47 66 61 74
FINANCIAL MANAGEMENT6
Turnover
Total Asset
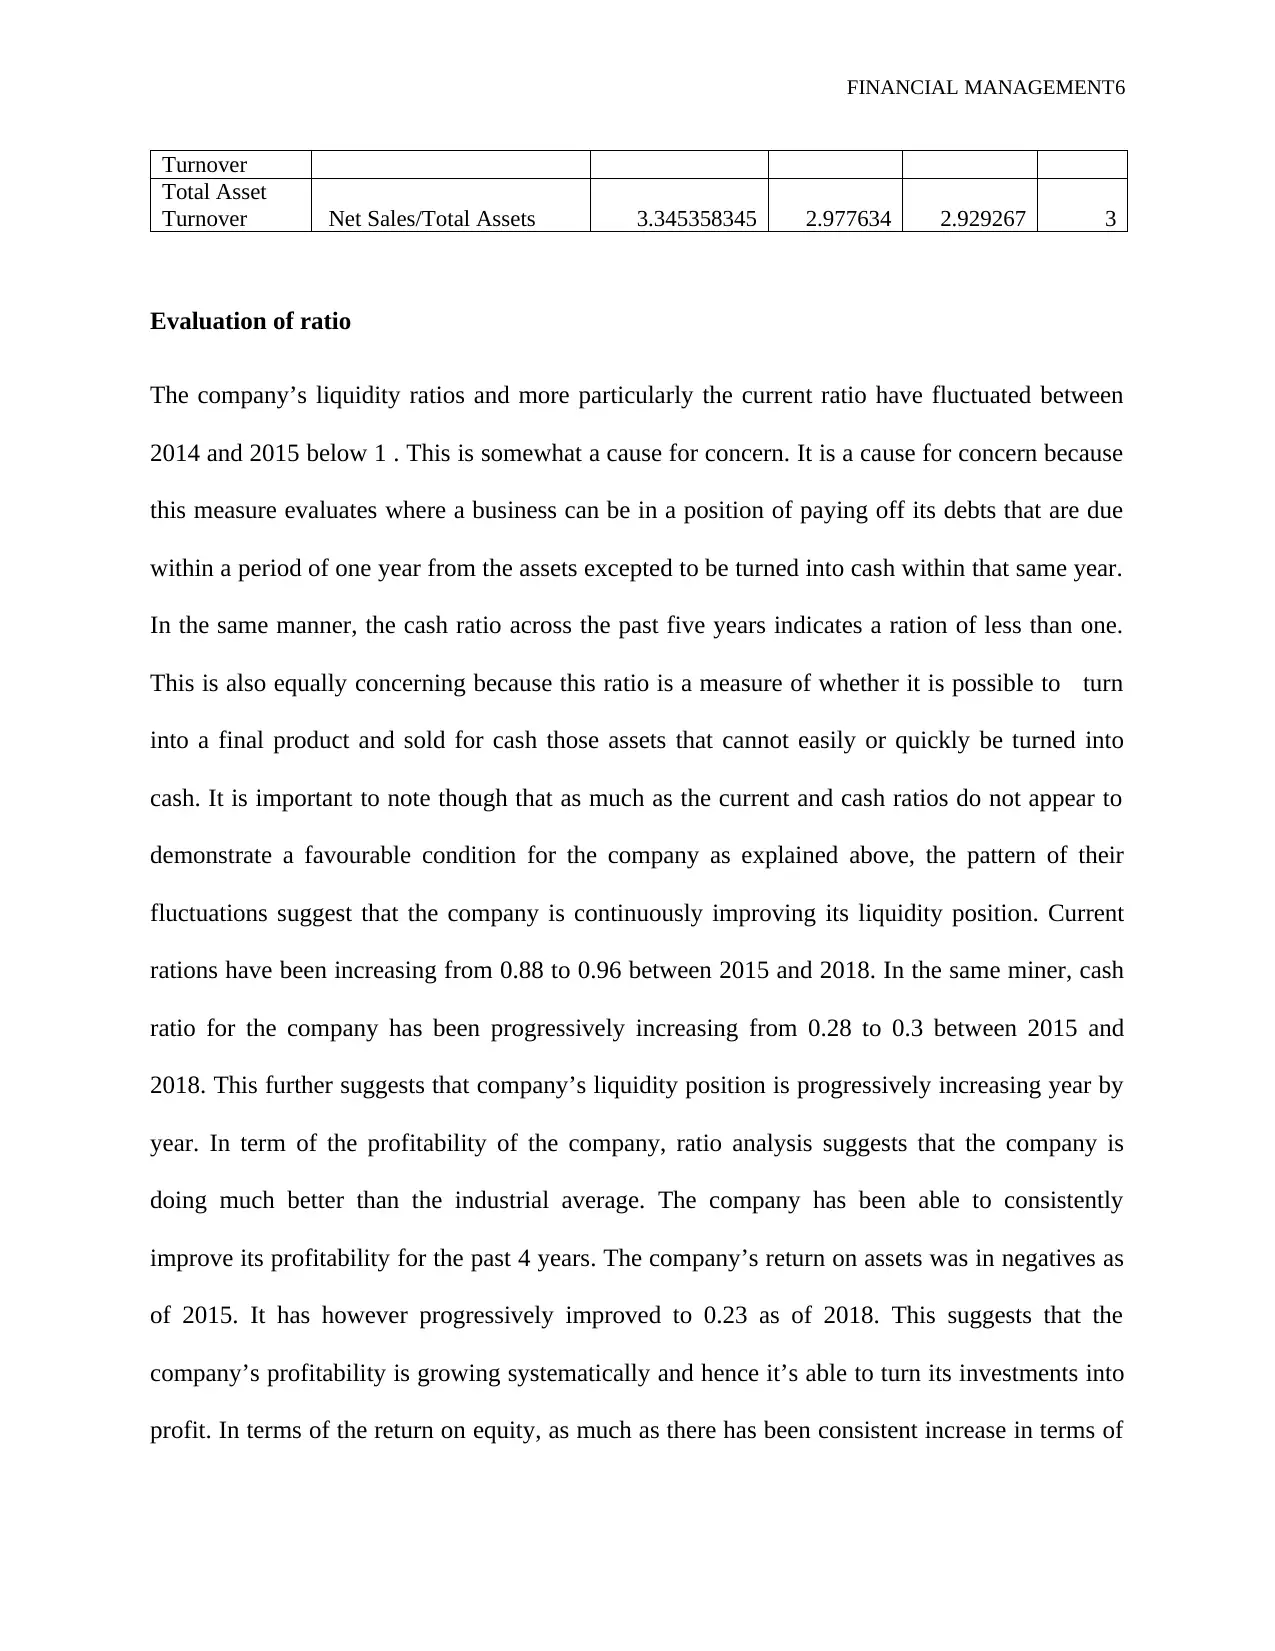
Turnover Net Sales/Total Assets 3.345358345 2.977634 2.929267 3
Evaluation of ratio
The company’s liquidity ratios and more particularly the current ratio have fluctuated between
2014 and 2015 below 1 . This is somewhat a cause for concern. It is a cause for concern because
this measure evaluates where a business can be in a position of paying off its debts that are due
within a period of one year from the assets excepted to be turned into cash within that same year.
In the same manner, the cash ratio across the past five years indicates a ration of less than one.
This is also equally concerning because this ratio is a measure of whether it is possible to turn
into a final product and sold for cash those assets that cannot easily or quickly be turned into
cash. It is important to note though that as much as the current and cash ratios do not appear to
demonstrate a favourable condition for the company as explained above, the pattern of their
fluctuations suggest that the company is continuously improving its liquidity position. Current
rations have been increasing from 0.88 to 0.96 between 2015 and 2018. In the same miner, cash
ratio for the company has been progressively increasing from 0.28 to 0.3 between 2015 and
2018. This further suggests that company’s liquidity position is progressively increasing year by
year. In term of the profitability of the company, ratio analysis suggests that the company is
doing much better than the industrial average. The company has been able to consistently
improve its profitability for the past 4 years. The company’s return on assets was in negatives as
of 2015. It has however progressively improved to 0.23 as of 2018. This suggests that the
company’s profitability is growing systematically and hence it’s able to turn its investments into
profit. In terms of the return on equity, as much as there has been consistent increase in terms of
Turnover
Total Asset
Turnover Net Sales/Total Assets 3.345358345 2.977634 2.929267 3
Evaluation of ratio
The company’s liquidity ratios and more particularly the current ratio have fluctuated between
2014 and 2015 below 1 . This is somewhat a cause for concern. It is a cause for concern because
this measure evaluates where a business can be in a position of paying off its debts that are due
within a period of one year from the assets excepted to be turned into cash within that same year.
In the same manner, the cash ratio across the past five years indicates a ration of less than one.
This is also equally concerning because this ratio is a measure of whether it is possible to turn
into a final product and sold for cash those assets that cannot easily or quickly be turned into
cash. It is important to note though that as much as the current and cash ratios do not appear to
demonstrate a favourable condition for the company as explained above, the pattern of their
fluctuations suggest that the company is continuously improving its liquidity position. Current
rations have been increasing from 0.88 to 0.96 between 2015 and 2018. In the same miner, cash
ratio for the company has been progressively increasing from 0.28 to 0.3 between 2015 and
2018. This further suggests that company’s liquidity position is progressively increasing year by
year. In term of the profitability of the company, ratio analysis suggests that the company is
doing much better than the industrial average. The company has been able to consistently
improve its profitability for the past 4 years. The company’s return on assets was in negatives as
of 2015. It has however progressively improved to 0.23 as of 2018. This suggests that the
company’s profitability is growing systematically and hence it’s able to turn its investments into
profit. In terms of the return on equity, as much as there has been consistent increase in terms of
⊘ This is a preview!⊘
Do you want full access?
Subscribe today to unlock all pages.
Trusted by 1+ million students worldwide
FINANCIAL MANAGEMENT7
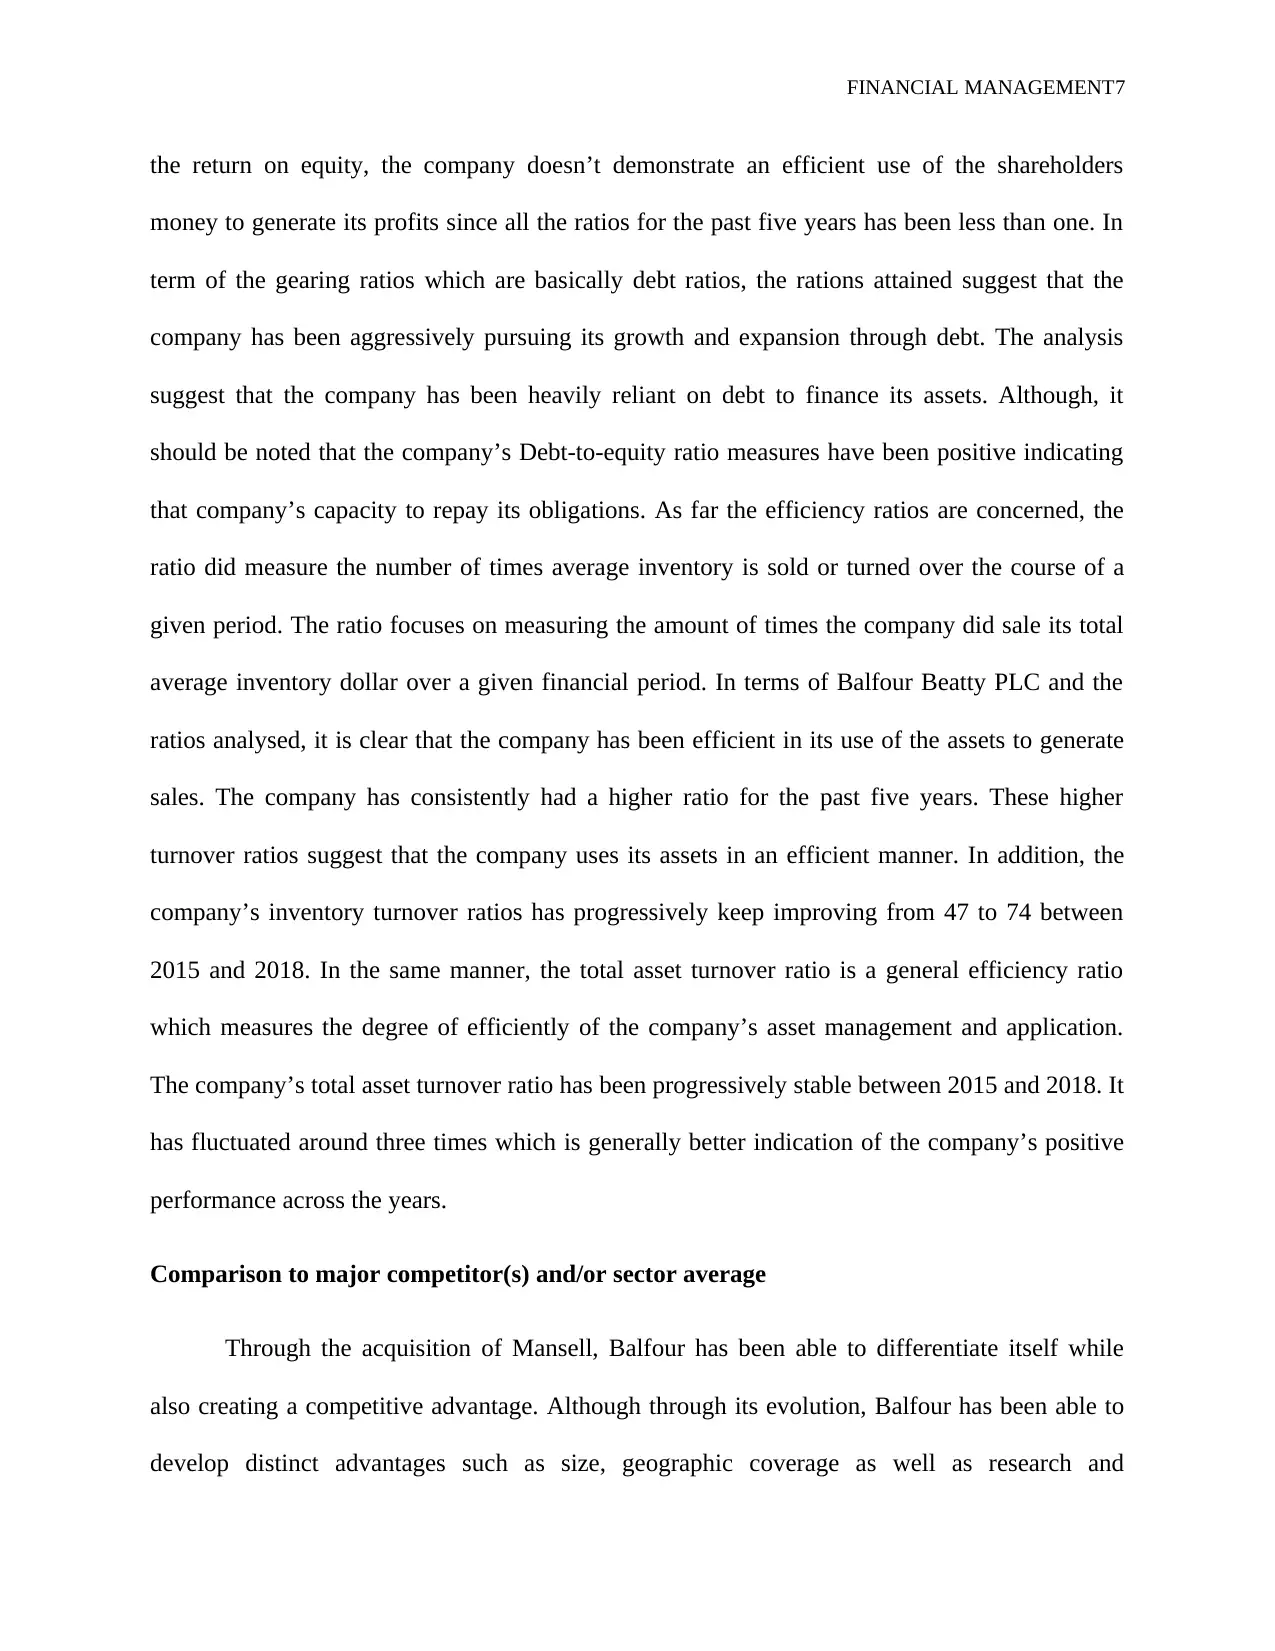
the return on equity, the company doesn’t demonstrate an efficient use of the shareholders
money to generate its profits since all the ratios for the past five years has been less than one. In
term of the gearing ratios which are basically debt ratios, the rations attained suggest that the
company has been aggressively pursuing its growth and expansion through debt. The analysis
suggest that the company has been heavily reliant on debt to finance its assets. Although, it
should be noted that the company’s Debt-to-equity ratio measures have been positive indicating
that company’s capacity to repay its obligations. As far the efficiency ratios are concerned, the
ratio did measure the number of times average inventory is sold or turned over the course of a
given period. The ratio focuses on measuring the amount of times the company did sale its total
average inventory dollar over a given financial period. In terms of Balfour Beatty PLC and the
ratios analysed, it is clear that the company has been efficient in its use of the assets to generate
sales. The company has consistently had a higher ratio for the past five years. These higher
turnover ratios suggest that the company uses its assets in an efficient manner. In addition, the
company’s inventory turnover ratios has progressively keep improving from 47 to 74 between
2015 and 2018. In the same manner, the total asset turnover ratio is a general efficiency ratio
which measures the degree of efficiently of the company’s asset management and application.
The company’s total asset turnover ratio has been progressively stable between 2015 and 2018. It
has fluctuated around three times which is generally better indication of the company’s positive
performance across the years.
Comparison to major competitor(s) and/or sector average
Through the acquisition of Mansell, Balfour has been able to differentiate itself while
also creating a competitive advantage. Although through its evolution, Balfour has been able to
develop distinct advantages such as size, geographic coverage as well as research and
Paraphrase This Document
Need a fresh take? Get an instant paraphrase of this document with our AI Paraphraser
FINANCIAL MANAGEMENT8
development competence. It has also acquired partnership arrangements which have further
reinforced is position. In addition, the company seeks to always improve and also upgrade its
products as well as service offering. It does it through reorganisation or acquires a merger. All
these make it quite hard for a new entrant to penetrate the market and threaten Balfour’s position
in any way. There are more than 80,000 companies contained within the UK building
construction industry and all of these are of variable sizes. In analysing Balfour’s major
competitors including Amec plc and Kier Group within the UK, certain aspects stand out.
Amec’s follows a strategy which is focused on making it the leading supplier for engineering of
high value, project management and consultancy services within distinct market sections in the
global energy as well as industrial development industries (Evans, 2016). To be able to
differentiate it’s self from Balfour, Amec’s engages it’s self in the production of offshore gas as
well as oil production engagements (Clarke, 2015). It has some similarities with Kier in the
sense that it also involved in metal and mineral mines which is basically a clear one stop shop
entity. The company’s major business offerings are in gas and oil (McLintock, 2009). It is also
involved in offering minerals as well as metal mining, industrial, wind energy, earth and nuclear
offerings. Unlike Balfour consequently, Amec has its focus on the non-domestic construction, as
opposed to social hosing and property development (Shiller, 2011). Just like Balfour, Amec is
predominantly prosperous within the public sector market. It has in addition embarked upon a
strategy which emphasizes growth through merging as well as acquisitions which continues to
aid its profitability.
The other company major competitor to Balfour as indicated already is Kier. Kier has a
wide network including regional contracting businesses within the UK. The company
demonstrates major project expertise and is in a position of offering a full life span of services
FINANCIAL MANAGEMENT9
for buildings, including the management of facilities (Hartcup, 2011). To put is simply, it is
construction, development as well as and service group. It is a specialist in building as well as
civil engineering, private house construction, property development as well as support services
(Trotman and Gibbins, 2009). Just like Balfour, Kier is a well-recognised business. In the same
manner like Balfour, Kier has also been able to develop its own infrastructure investment
corporation (Fernandes, 2014). Just like Balfour, Kier does embrace the social as well as
environmental facets of geared towards growth and sustainability. Unlike Balfour however, Kier
is engages in opencast mining and the administration of facilities. (Velez-Pareja, and Tham,
2008). It is also notable that Balfour as well as Kier have operations within distinctly comparable
markets and the expertise offered by both companies is more less the same (Hoskins, 2009). As
indicated through ratio analysis, it is evident that Balfour enjoyed a growth in its profitability
from 2015 to 2018(Dauchy, 2013). This growth in profitability is demonstrated by the positive
trend in terms of both the return on Assets and equity (Seow, et al.2010). The company’s return
on assets grew from -0.04 to 0.03 between 2015 and 2018. In the same manner, the company’s
return on equity equally grew from -0.26 in 2015 to 0.11 in 2018 (Labardin and Marc, 2009).
This could be attributed to lower operational costs across that span of operations and hence
enhanced profits. These performances are much better than kier which whose return on assets
and equity respectively were between -0.3 and 0.02 in the same period.
Recommendation on how to improve the financial management of the company
It is recommended that the company considers a union or an acquirement of Kier within
the near future. This would aid the provision of the added benefit of being able to consolidate its
position while also being able to create critical mass in terms of the share of the market in areas
like private house buildings as well as PFI. It is also critical that management considers hiring
⊘ This is a preview!⊘
Do you want full access?
Subscribe today to unlock all pages.
Trusted by 1+ million students worldwide
FINANCIAL MANAGEMENT10
experts and external auditors to continuously investigate the debt level of the company to keep
them as low as possible. It is also recommended that the company adopts a much more
differentiated technique for its services and products to curb against duplication by the
competitors. It’s also recommended that the company invests a lot more in enhanced marketing
to ensure that its products and services reach a much wider audience and thereby growing its
sales. It is also important that the company considers the tailoring of its services to meet the local
needs as well as requirements. In so doing, the company would be in a position of improving its
relations with its customers and thereby enhancing its sales.
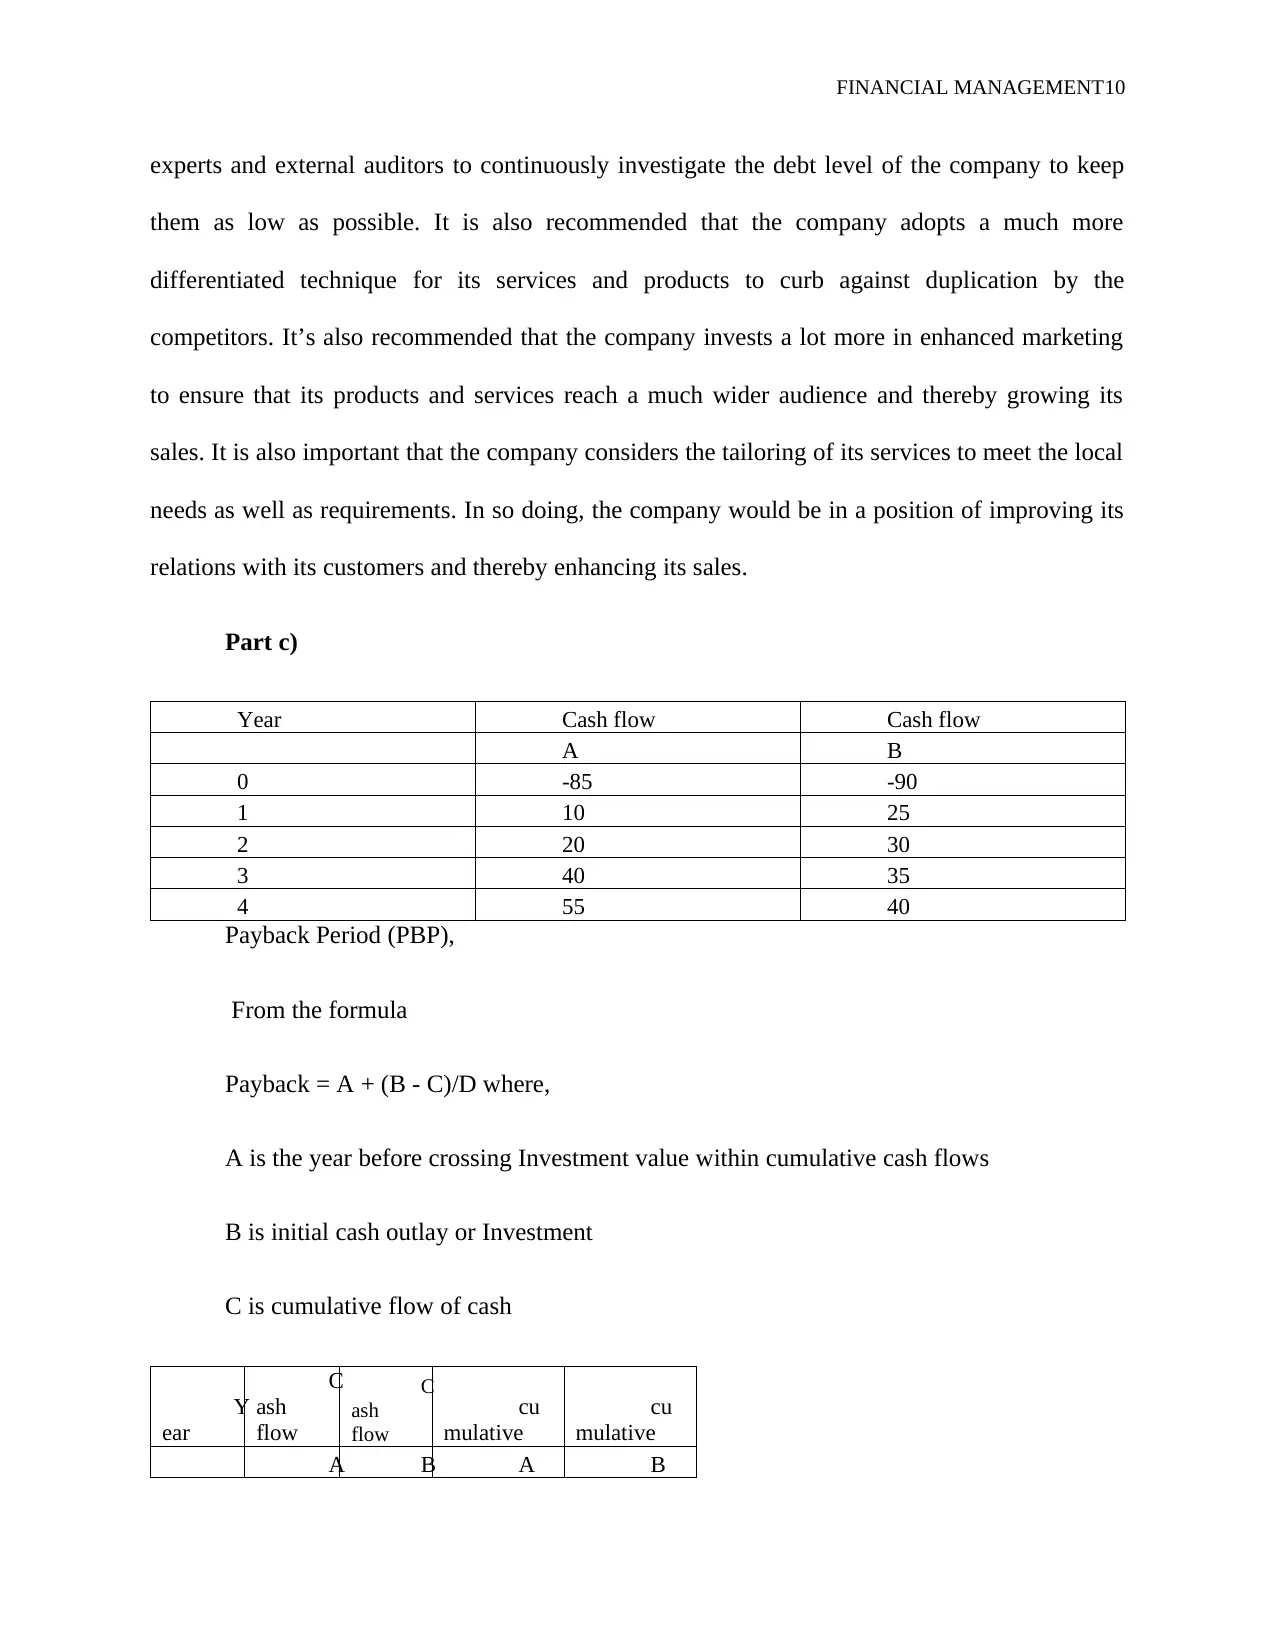
Part c)
Year Cash flow Cash flow
A B
0 -85 -90
1 10 25
2 20 30
3 40 35
4 55 40
Payback Period (PBP),
From the formula
Payback = A + (B - C)/D where,
A is the year before crossing Investment value within cumulative cash flows
B is initial cash outlay or Investment
C is cumulative flow of cash
Y
ear
C
ash
flow
C
ash
flow
cu
mulative
cu
mulative
A B A B
experts and external auditors to continuously investigate the debt level of the company to keep
them as low as possible. It is also recommended that the company adopts a much more
differentiated technique for its services and products to curb against duplication by the
competitors. It’s also recommended that the company invests a lot more in enhanced marketing
to ensure that its products and services reach a much wider audience and thereby growing its
sales. It is also important that the company considers the tailoring of its services to meet the local
needs as well as requirements. In so doing, the company would be in a position of improving its
relations with its customers and thereby enhancing its sales.
Part c)
Year Cash flow Cash flow
A B
0 -85 -90
1 10 25
2 20 30
3 40 35
4 55 40
Payback Period (PBP),
From the formula
Payback = A + (B - C)/D where,
A is the year before crossing Investment value within cumulative cash flows
B is initial cash outlay or Investment
C is cumulative flow of cash
Y
ear
C
ash
flow
C
ash
flow
cu
mulative
cu
mulative
A B A B
Paraphrase This Document
Need a fresh take? Get an instant paraphrase of this document with our AI Paraphraser
FINANCIAL MANAGEMENT11
0
-
85
-
90 -85 -90
1
1
0
2
5 -75 -70
2
2
0
3
0 -55 -40
3
4
0
3
5 -15 -5
4
5
5
4
0 40 35
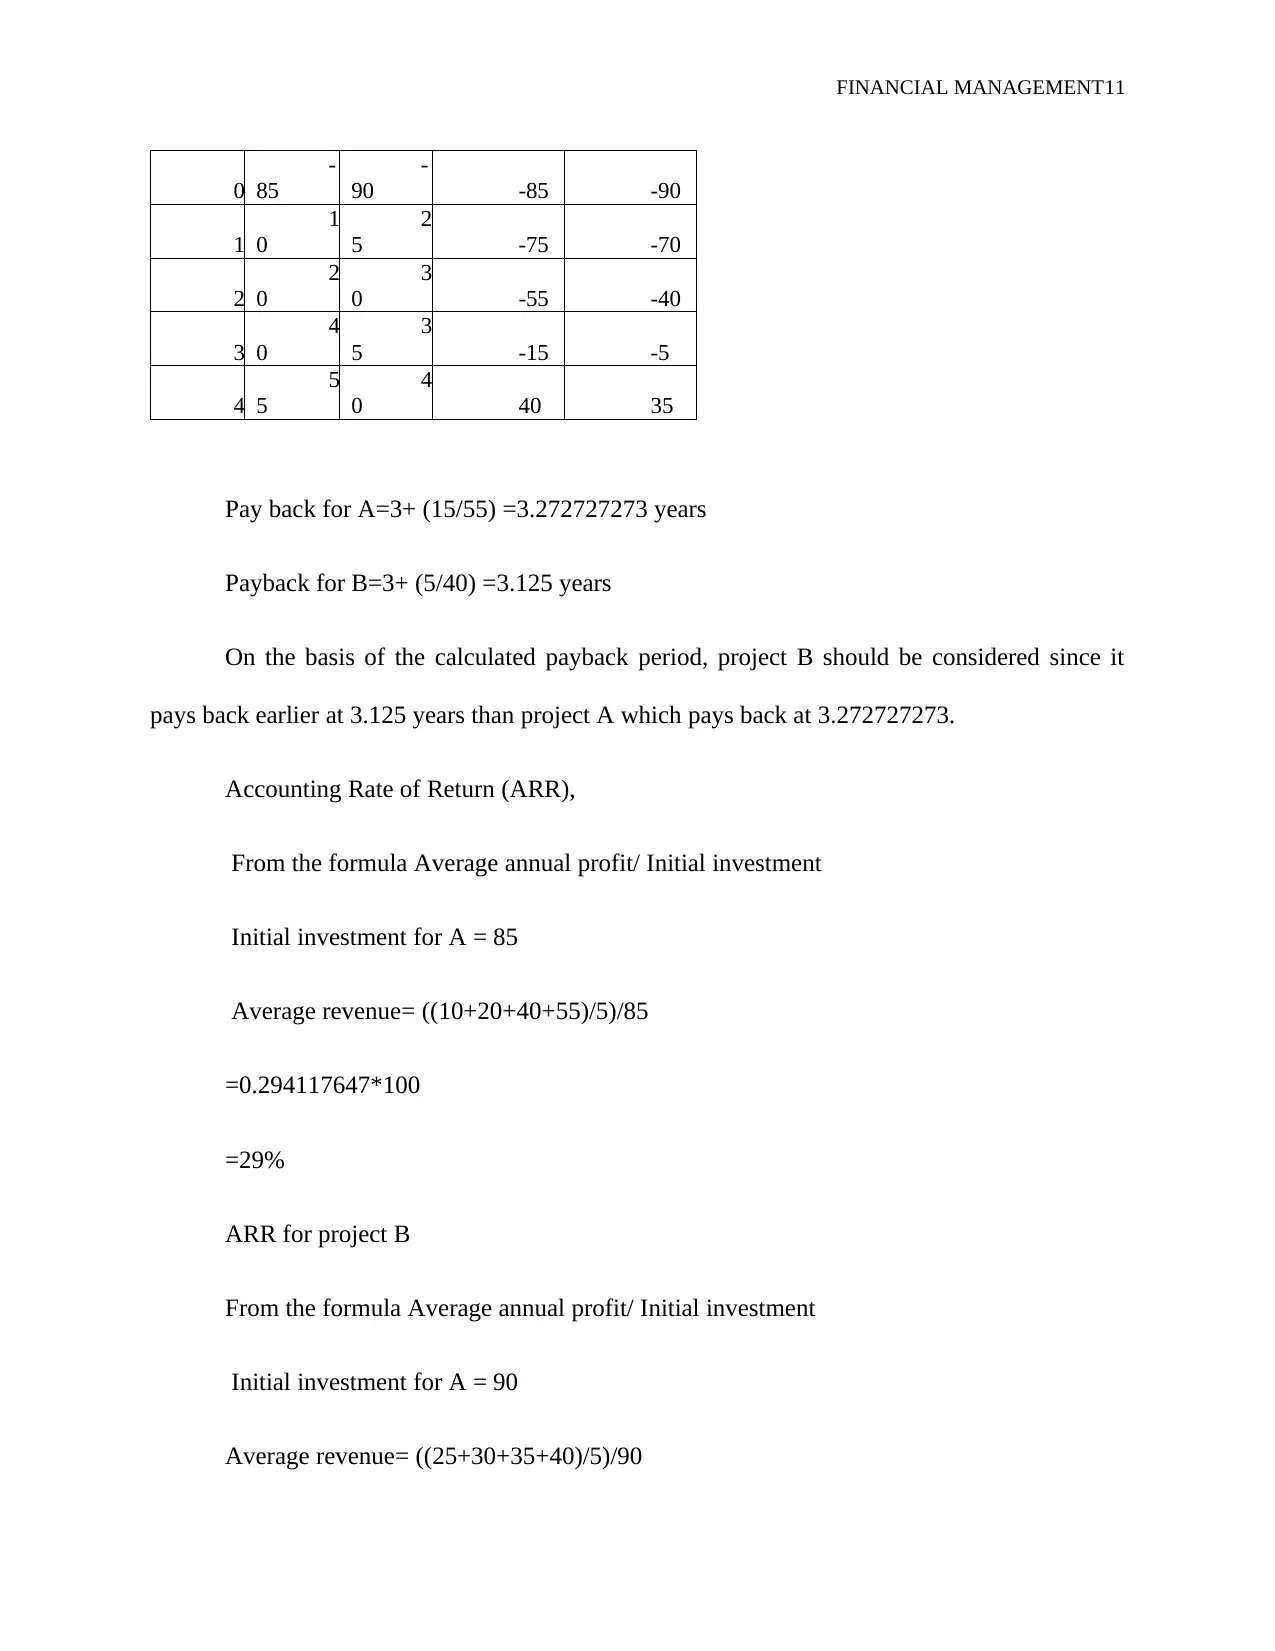
Pay back for A=3+ (15/55) =3.272727273 years
Payback for B=3+ (5/40) =3.125 years
On the basis of the calculated payback period, project B should be considered since it
pays back earlier at 3.125 years than project A which pays back at 3.272727273.
Accounting Rate of Return (ARR),
From the formula Average annual profit/ Initial investment
Initial investment for A = 85
Average revenue= ((10+20+40+55)/5)/85
=0.294117647*100
=29%
ARR for project B
From the formula Average annual profit/ Initial investment
Initial investment for A = 90
Average revenue= ((25+30+35+40)/5)/90
0
-
85
-
90 -85 -90
1
1
0
2
5 -75 -70
2
2
0
3
0 -55 -40
3
4
0
3
5 -15 -5
4
5
5
4
0 40 35
Pay back for A=3+ (15/55) =3.272727273 years
Payback for B=3+ (5/40) =3.125 years
On the basis of the calculated payback period, project B should be considered since it
pays back earlier at 3.125 years than project A which pays back at 3.272727273.
Accounting Rate of Return (ARR),
From the formula Average annual profit/ Initial investment
Initial investment for A = 85
Average revenue= ((10+20+40+55)/5)/85
=0.294117647*100
=29%
ARR for project B
From the formula Average annual profit/ Initial investment
Initial investment for A = 90
Average revenue= ((25+30+35+40)/5)/90
FINANCIAL MANAGEMENT12
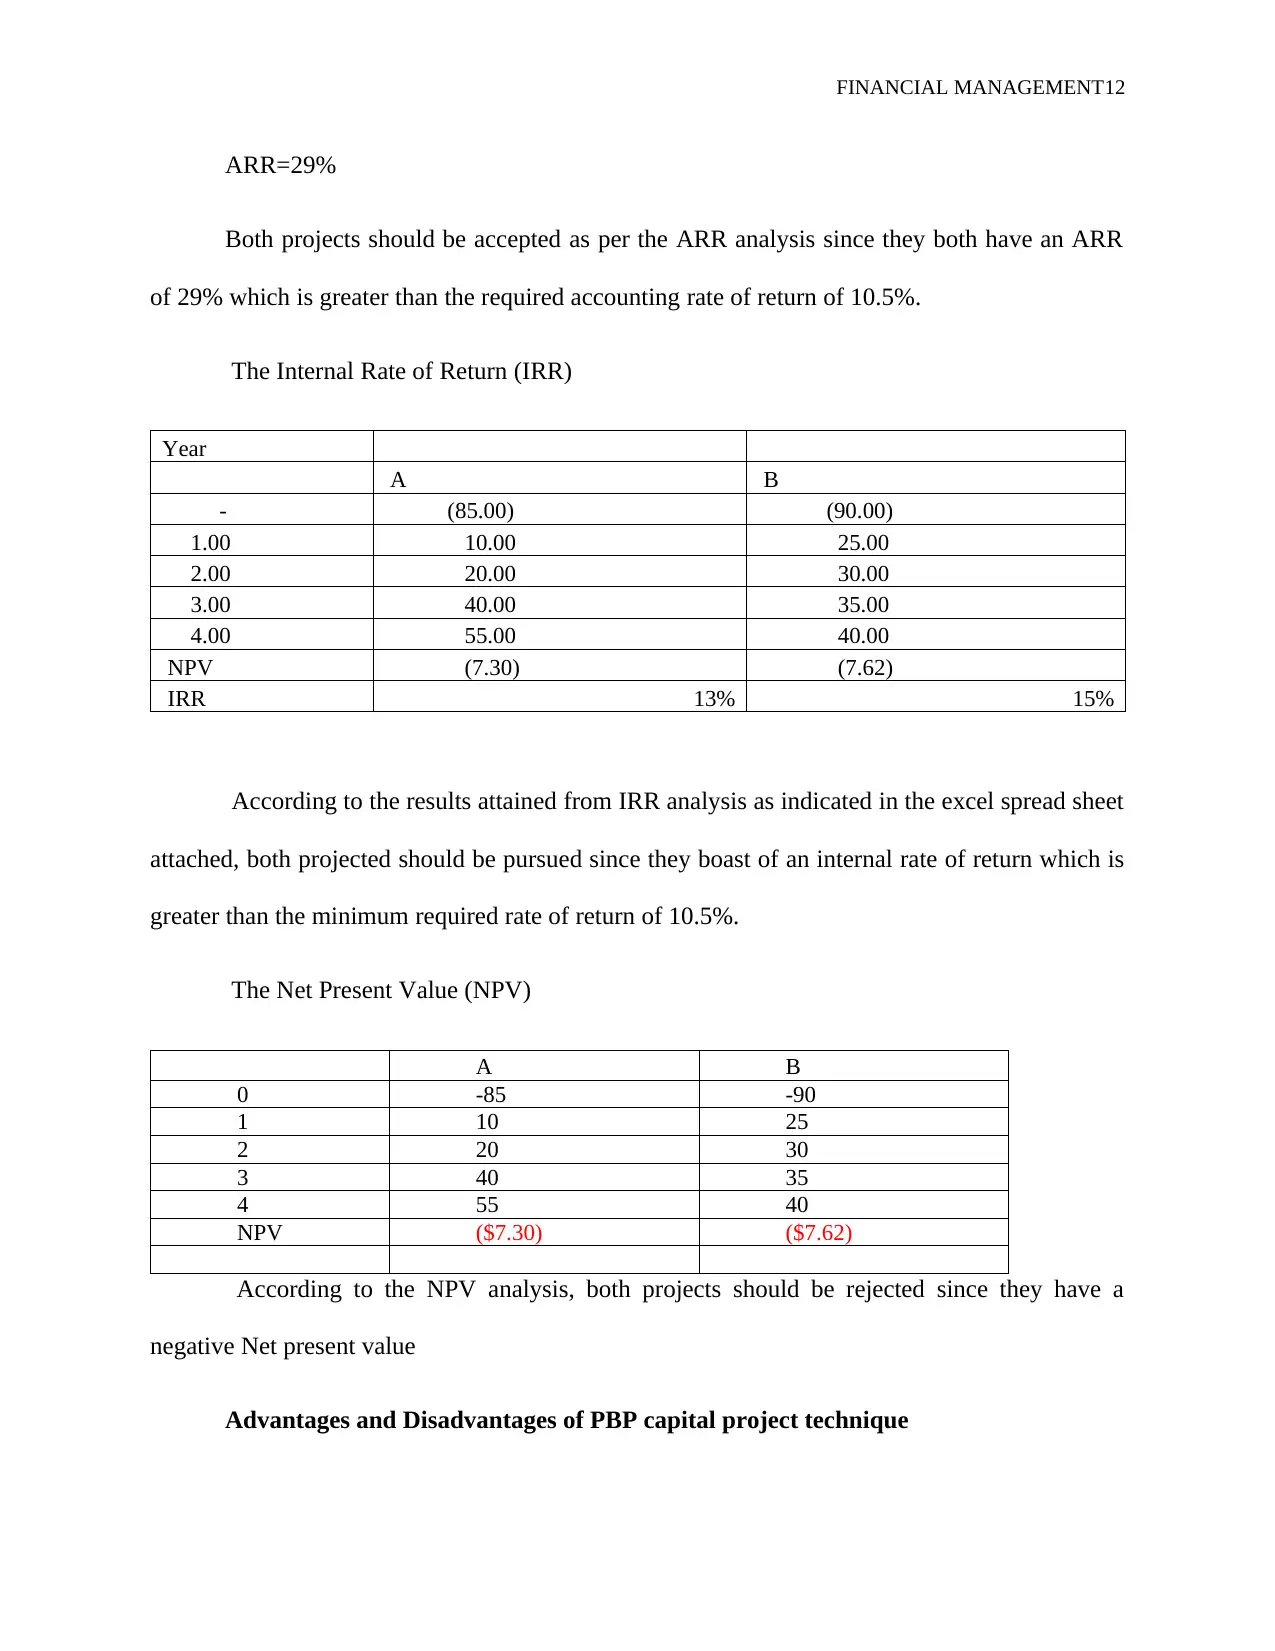
ARR=29%
Both projects should be accepted as per the ARR analysis since they both have an ARR
of 29% which is greater than the required accounting rate of return of 10.5%.
The Internal Rate of Return (IRR)
Year
A B
- (85.00) (90.00)
1.00 10.00 25.00
2.00 20.00 30.00
3.00 40.00 35.00
4.00 55.00 40.00
NPV (7.30) (7.62)
IRR 13% 15%
According to the results attained from IRR analysis as indicated in the excel spread sheet
attached, both projected should be pursued since they boast of an internal rate of return which is
greater than the minimum required rate of return of 10.5%.
The Net Present Value (NPV)
A B
0 -85 -90
1 10 25
2 20 30
3 40 35
4 55 40
NPV ($7.30) ($7.62)
According to the NPV analysis, both projects should be rejected since they have a
negative Net present value
Advantages and Disadvantages of PBP capital project technique
⊘ This is a preview!⊘
Do you want full access?
Subscribe today to unlock all pages.
Trusted by 1+ million students worldwide
1 out of 23
Related Documents


Your All-in-One AI-Powered Toolkit for Academic Success.
+13062052269
info@desklib.com
Available 24*7 on WhatsApp / Email
![[object Object]](/_next/static/media/star-bottom.7253800d.svg)
Unlock your academic potential
Copyright © 2020–2026 A2Z Services. All Rights Reserved. Developed and managed by ZUCOL.