Accounting and Financial Management: Bjam Plc and Toyland Ltd Analysis
VerifiedAdded on 2020/10/23
|18
|4725
|447
Report
AI Summary
This report provides a comprehensive analysis of the financial performance of Bjam Plc, a London-based furniture manufacturing company. The analysis includes the calculation and interpretation of various accounting ratios such as profitability, liquidity, gearing, and asset utilization ratios for the years 2016 and 2017. The report assesses the company's financial health, operational efficiency, and ability to meet its short-term and long-term obligations. Furthermore, it examines the working capital cycle of Bjam Plc and evaluates its efficiency in managing its current assets and liabilities. Finally, the report briefly touches upon investment appraisal techniques, providing a holistic view of the company's financial management practices. The report also briefly touches upon the financial aspects of Toyland Ltd.

Accounting and
Financial Management
Financial Management
Paraphrase This Document
Need a fresh take? Get an instant paraphrase of this document with our AI Paraphraser
Table of Contents
INTRODUCTION...........................................................................................................................1
PART A...........................................................................................................................................1
1. Calculation of relevant ratios to analyse organisation's performance................................1
2. Calculation of working capital cycle for Bjam Plc............................................................6
PART B............................................................................................................................................8
1. Various investment appraisal techniques:..........................................................................8
PART C..........................................................................................................................................14
1 Budget and relationship of budget with strategic objectives & plans:..............................14
2. Evaluation of Budgeting Process by interlinking various budgets used within a business :14
CONCLUSION..............................................................................................................................15
REFERENCES..............................................................................................................................16
INTRODUCTION
Accounting and financial management is a complete set of activities related to
finalisation of annual financial reports and analysing financial performance and efficiency of
organisation. For better accomplishment of such activities key managerial personnel of the
company are responsible for safeguarding of financial and accounting information that are
relevant for users of financial data (Ward, 2012). To achieve the predetermined performance or
objective, various accounting techniques such as ratio analysis, capital budgeting and cost of
capital assists management. This project report exhibits different aspects of accounting and
financial management in the context of two different companies i.e. Bjam Plc and Toyland Ltd.
In this project report analysis of these companies are done through accounting ratios, working
capital cycle and capital budgeting based on data provided in case studies.
PART A
Overview of company:
Bjam Plc is London based company which is engaged in manufacturing furniture items
and doing its business activities successfully in London. Directors of the business entity wants to
analysis the financial performance of the company because they have analysed significant
changes in the financial statements of Bjam Plc. For this, board of directors asked to the
management accountant to prepare a report on the financial statements of two years of the
organisation (Banerjee, 2012).
1. Calculation of relevant ratios to analyse organisation's performance
Ratio analysis: It can be defined as a quantitative analysis of organisation's performance
with the help of various information which is recorded in financial statements of the company.
Ratio analysis is used to evaluate various aspects of a company’s operating and financial
performance such as its efficiency, liquidity, profitability and solvency. The directors of Bjam
Plc is required these ratios to evaluate the changes in financial statements of two years and for
this ratios are calculated by management accountant. (Blankespoor and et.al., 2013). There are
various types of ratios which are calculated by management accountant from the financial
statements of two years of this organisation which are as follows:
Profitability ratios:
1
⊘ This is a preview!⊘
Do you want full access?
Subscribe today to unlock all pages.
Trusted by 1+ million students worldwide
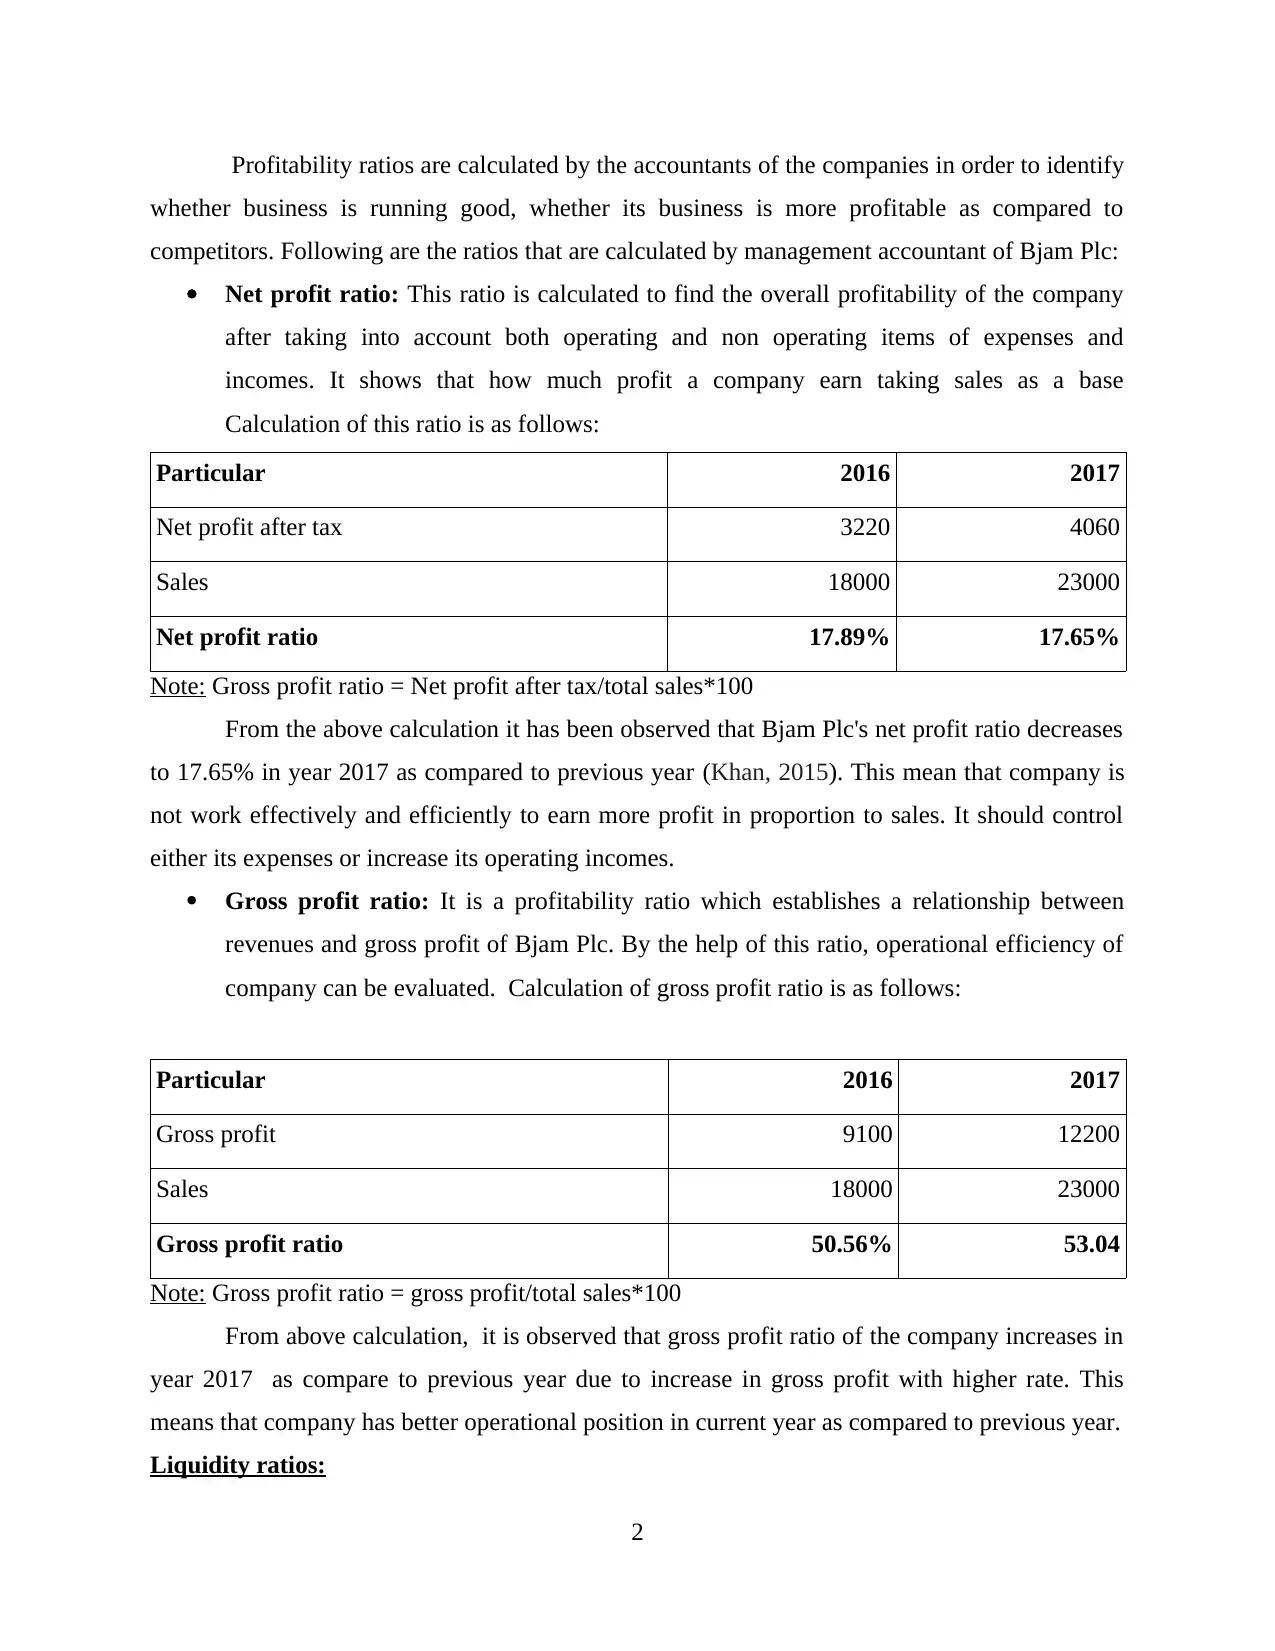
Profitability ratios are calculated by the accountants of the companies in order to identify
whether business is running good, whether its business is more profitable as compared to
competitors. Following are the ratios that are calculated by management accountant of Bjam Plc:
Net profit ratio: This ratio is calculated to find the overall profitability of the company
after taking into account both operating and non operating items of expenses and
incomes. It shows that how much profit a company earn taking sales as a base
Calculation of this ratio is as follows:
Particular 2016 2017
Net profit after tax 3220 4060
Sales 18000 23000
Net profit ratio 17.89% 17.65%
Note: Gross profit ratio = Net profit after tax/total sales*100
From the above calculation it has been observed that Bjam Plc's net profit ratio decreases
to 17.65% in year 2017 as compared to previous year (Khan, 2015). This mean that company is
not work effectively and efficiently to earn more profit in proportion to sales. It should control
either its expenses or increase its operating incomes.
Gross profit ratio: It is a profitability ratio which establishes a relationship between
revenues and gross profit of Bjam Plc. By the help of this ratio, operational efficiency of
company can be evaluated. Calculation of gross profit ratio is as follows:
Particular 2016 2017
Gross profit 9100 12200
Sales 18000 23000
Gross profit ratio 50.56% 53.04
Note: Gross profit ratio = gross profit/total sales*100
From above calculation, it is observed that gross profit ratio of the company increases in
year 2017 as compare to previous year due to increase in gross profit with higher rate. This
means that company has better operational position in current year as compared to previous year.
Liquidity ratios:
2
Paraphrase This Document
Need a fresh take? Get an instant paraphrase of this document with our AI Paraphraser
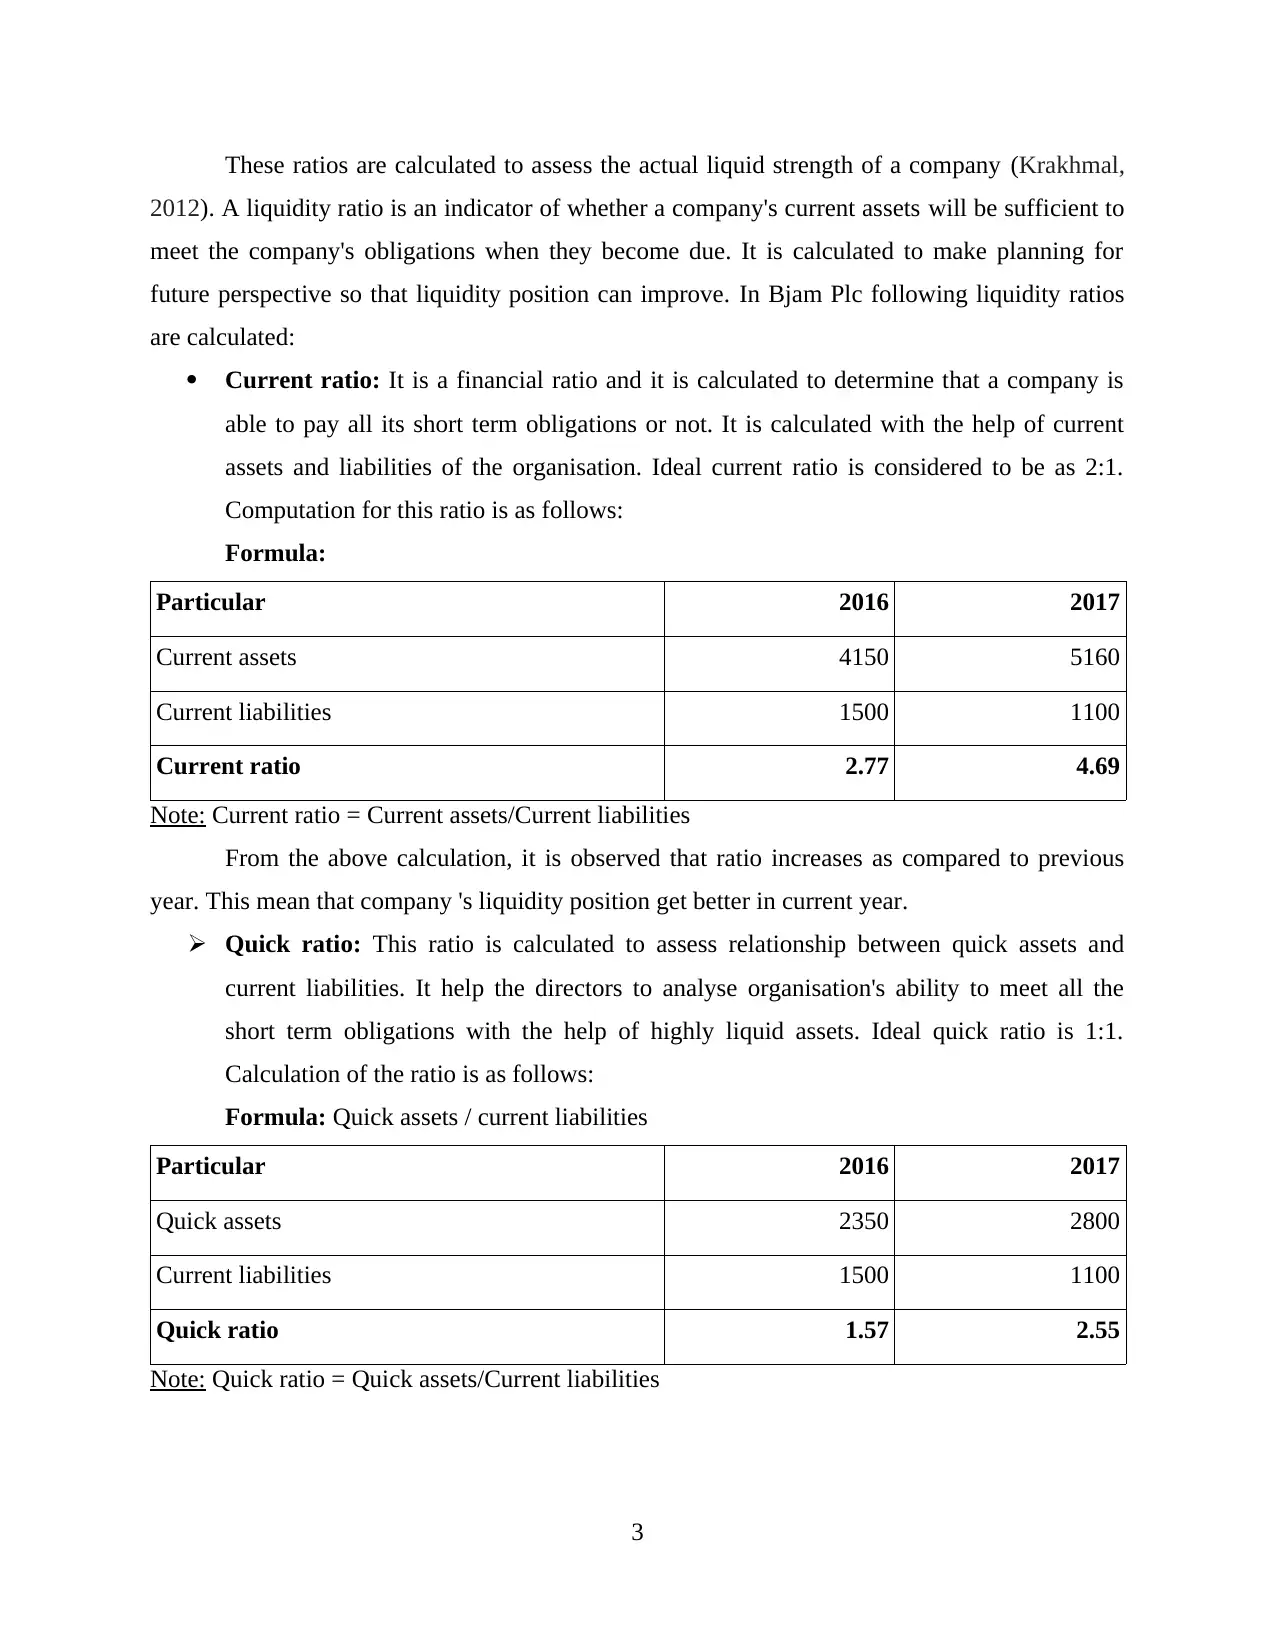
These ratios are calculated to assess the actual liquid strength of a company (Krakhmal,
2012). A liquidity ratio is an indicator of whether a company's current assets will be sufficient to
meet the company's obligations when they become due. It is calculated to make planning for
future perspective so that liquidity position can improve. In Bjam Plc following liquidity ratios
are calculated:
Current ratio: It is a financial ratio and it is calculated to determine that a company is
able to pay all its short term obligations or not. It is calculated with the help of current
assets and liabilities of the organisation. Ideal current ratio is considered to be as 2:1.
Computation for this ratio is as follows:
Formula:
Particular 2016 2017
Current assets 4150 5160
Current liabilities 1500 1100
Current ratio 2.77 4.69
Note: Current ratio = Current assets/Current liabilities
From the above calculation, it is observed that ratio increases as compared to previous
year. This mean that company 's liquidity position get better in current year.
Quick ratio: This ratio is calculated to assess relationship between quick assets and
current liabilities. It help the directors to analyse organisation's ability to meet all the
short term obligations with the help of highly liquid assets. Ideal quick ratio is 1:1.
Calculation of the ratio is as follows:
Formula: Quick assets / current liabilities
Particular 2016 2017
Quick assets 2350 2800
Current liabilities 1500 1100
Quick ratio 1.57 2.55
Note: Quick ratio = Quick assets/Current liabilities
3
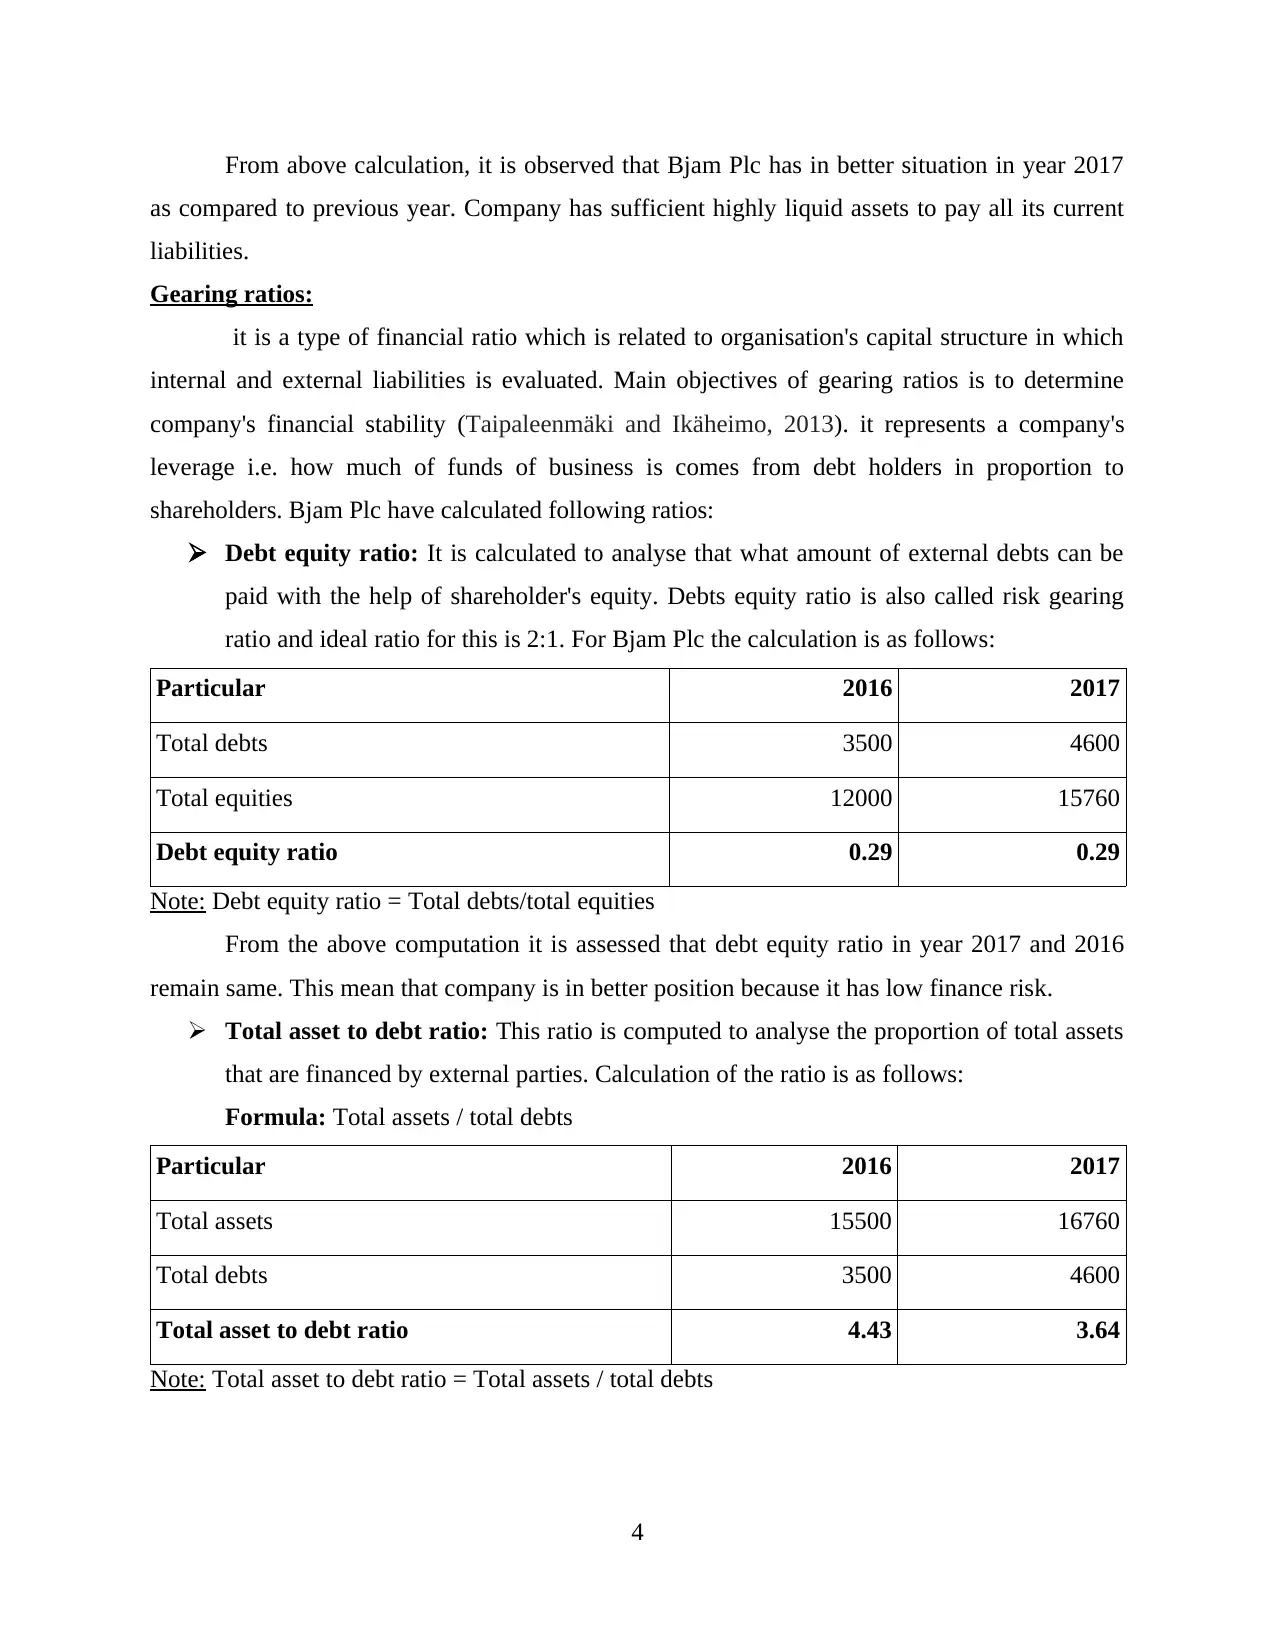
From above calculation, it is observed that Bjam Plc has in better situation in year 2017
as compared to previous year. Company has sufficient highly liquid assets to pay all its current
liabilities.
Gearing ratios:
it is a type of financial ratio which is related to organisation's capital structure in which
internal and external liabilities is evaluated. Main objectives of gearing ratios is to determine
company's financial stability (Taipaleenmäki and Ikäheimo, 2013). it represents a company's
leverage i.e. how much of funds of business is comes from debt holders in proportion to
shareholders. Bjam Plc have calculated following ratios:
Debt equity ratio: It is calculated to analyse that what amount of external debts can be
paid with the help of shareholder's equity. Debts equity ratio is also called risk gearing
ratio and ideal ratio for this is 2:1. For Bjam Plc the calculation is as follows:
Particular 2016 2017
Total debts 3500 4600
Total equities 12000 15760
Debt equity ratio 0.29 0.29
Note: Debt equity ratio = Total debts/total equities
From the above computation it is assessed that debt equity ratio in year 2017 and 2016
remain same. This mean that company is in better position because it has low finance risk.
Total asset to debt ratio: This ratio is computed to analyse the proportion of total assets
that are financed by external parties. Calculation of the ratio is as follows:
Formula: Total assets / total debts
Particular 2016 2017
Total assets 15500 16760
Total debts 3500 4600
Total asset to debt ratio 4.43 3.64
Note: Total asset to debt ratio = Total assets / total debts
4
⊘ This is a preview!⊘
Do you want full access?
Subscribe today to unlock all pages.
Trusted by 1+ million students worldwide
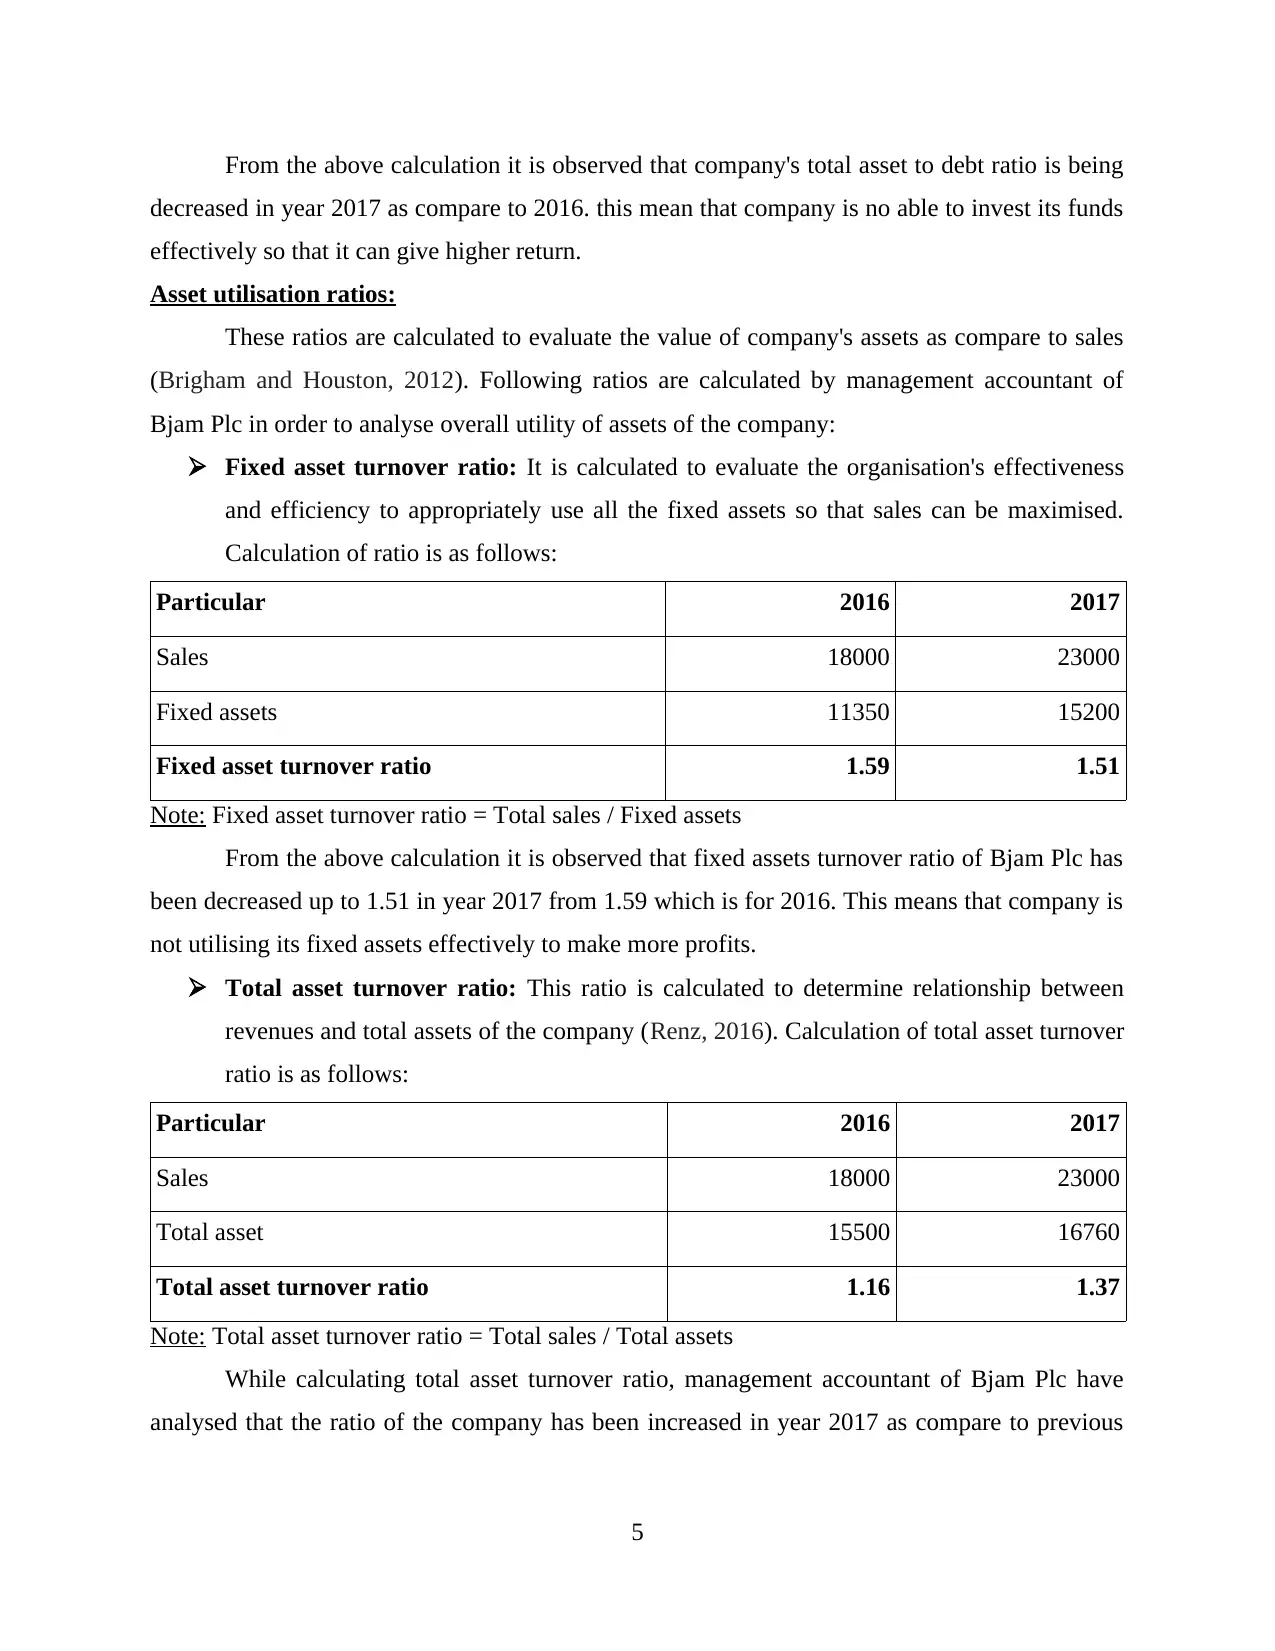
From the above calculation it is observed that company's total asset to debt ratio is being
decreased in year 2017 as compare to 2016. this mean that company is no able to invest its funds
effectively so that it can give higher return.
Asset utilisation ratios:
These ratios are calculated to evaluate the value of company's assets as compare to sales
(Brigham and Houston, 2012). Following ratios are calculated by management accountant of
Bjam Plc in order to analyse overall utility of assets of the company:
Fixed asset turnover ratio: It is calculated to evaluate the organisation's effectiveness
and efficiency to appropriately use all the fixed assets so that sales can be maximised.
Calculation of ratio is as follows:
Particular 2016 2017
Sales 18000 23000
Fixed assets 11350 15200
Fixed asset turnover ratio 1.59 1.51
Note: Fixed asset turnover ratio = Total sales / Fixed assets
From the above calculation it is observed that fixed assets turnover ratio of Bjam Plc has
been decreased up to 1.51 in year 2017 from 1.59 which is for 2016. This means that company is
not utilising its fixed assets effectively to make more profits.
Total asset turnover ratio: This ratio is calculated to determine relationship between
revenues and total assets of the company (Renz, 2016). Calculation of total asset turnover
ratio is as follows:
Particular 2016 2017
Sales 18000 23000
Total asset 15500 16760
Total asset turnover ratio 1.16 1.37
Note: Total asset turnover ratio = Total sales / Total assets
While calculating total asset turnover ratio, management accountant of Bjam Plc have
analysed that the ratio of the company has been increased in year 2017 as compare to previous
5
Paraphrase This Document
Need a fresh take? Get an instant paraphrase of this document with our AI Paraphraser
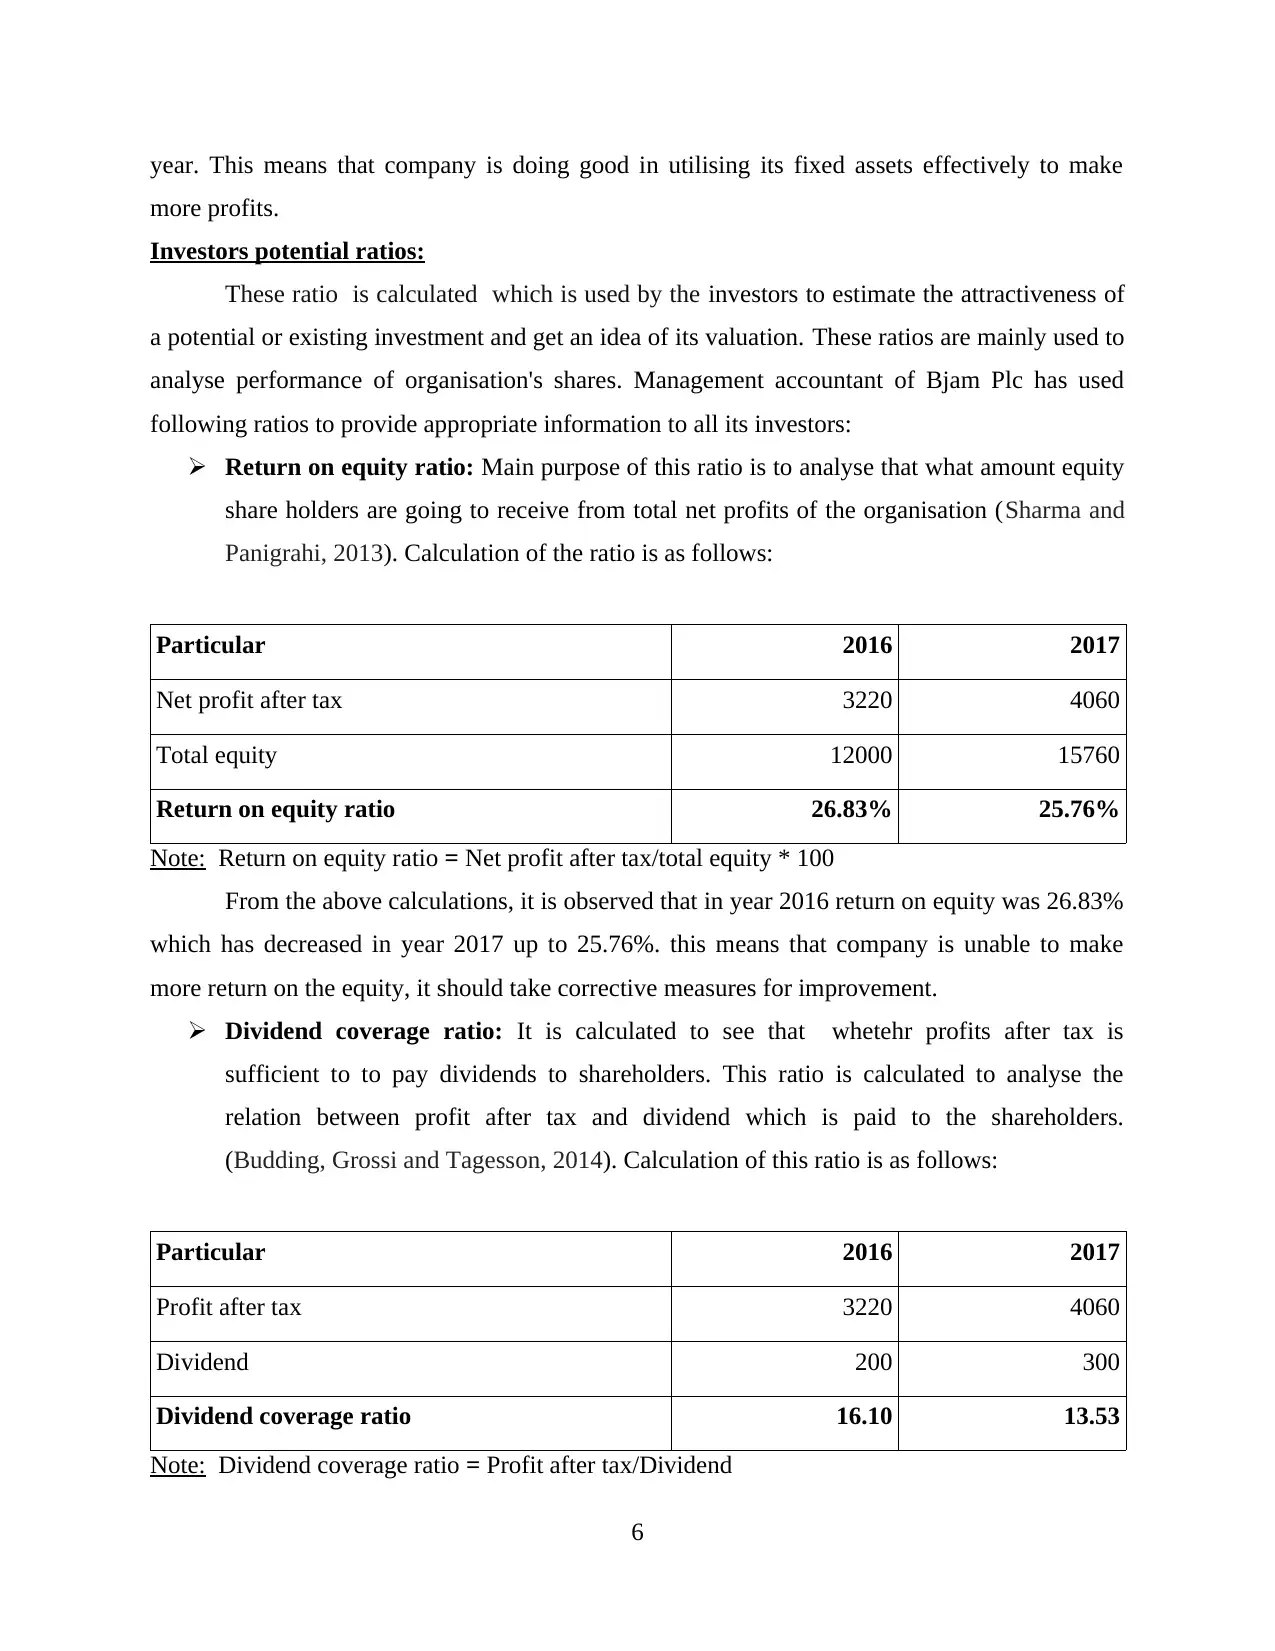
year. This means that company is doing good in utilising its fixed assets effectively to make
more profits.
Investors potential ratios:
These ratio is calculated which is used by the investors to estimate the attractiveness of
a potential or existing investment and get an idea of its valuation. These ratios are mainly used to
analyse performance of organisation's shares. Management accountant of Bjam Plc has used
following ratios to provide appropriate information to all its investors:
Return on equity ratio: Main purpose of this ratio is to analyse that what amount equity
share holders are going to receive from total net profits of the organisation (Sharma and
Panigrahi, 2013). Calculation of the ratio is as follows:
Particular 2016 2017
Net profit after tax 3220 4060
Total equity 12000 15760
Return on equity ratio 26.83% 25.76%
Note: Return on equity ratio = Net profit after tax/total equity * 100
From the above calculations, it is observed that in year 2016 return on equity was 26.83%
which has decreased in year 2017 up to 25.76%. this means that company is unable to make
more return on the equity, it should take corrective measures for improvement.
Dividend coverage ratio: It is calculated to see that whetehr profits after tax is
sufficient to to pay dividends to shareholders. This ratio is calculated to analyse the
relation between profit after tax and dividend which is paid to the shareholders.
(Budding, Grossi and Tagesson, 2014). Calculation of this ratio is as follows:
Particular 2016 2017
Profit after tax 3220 4060
Dividend 200 300
Dividend coverage ratio 16.10 13.53
Note: Dividend coverage ratio = Profit after tax/Dividend
6
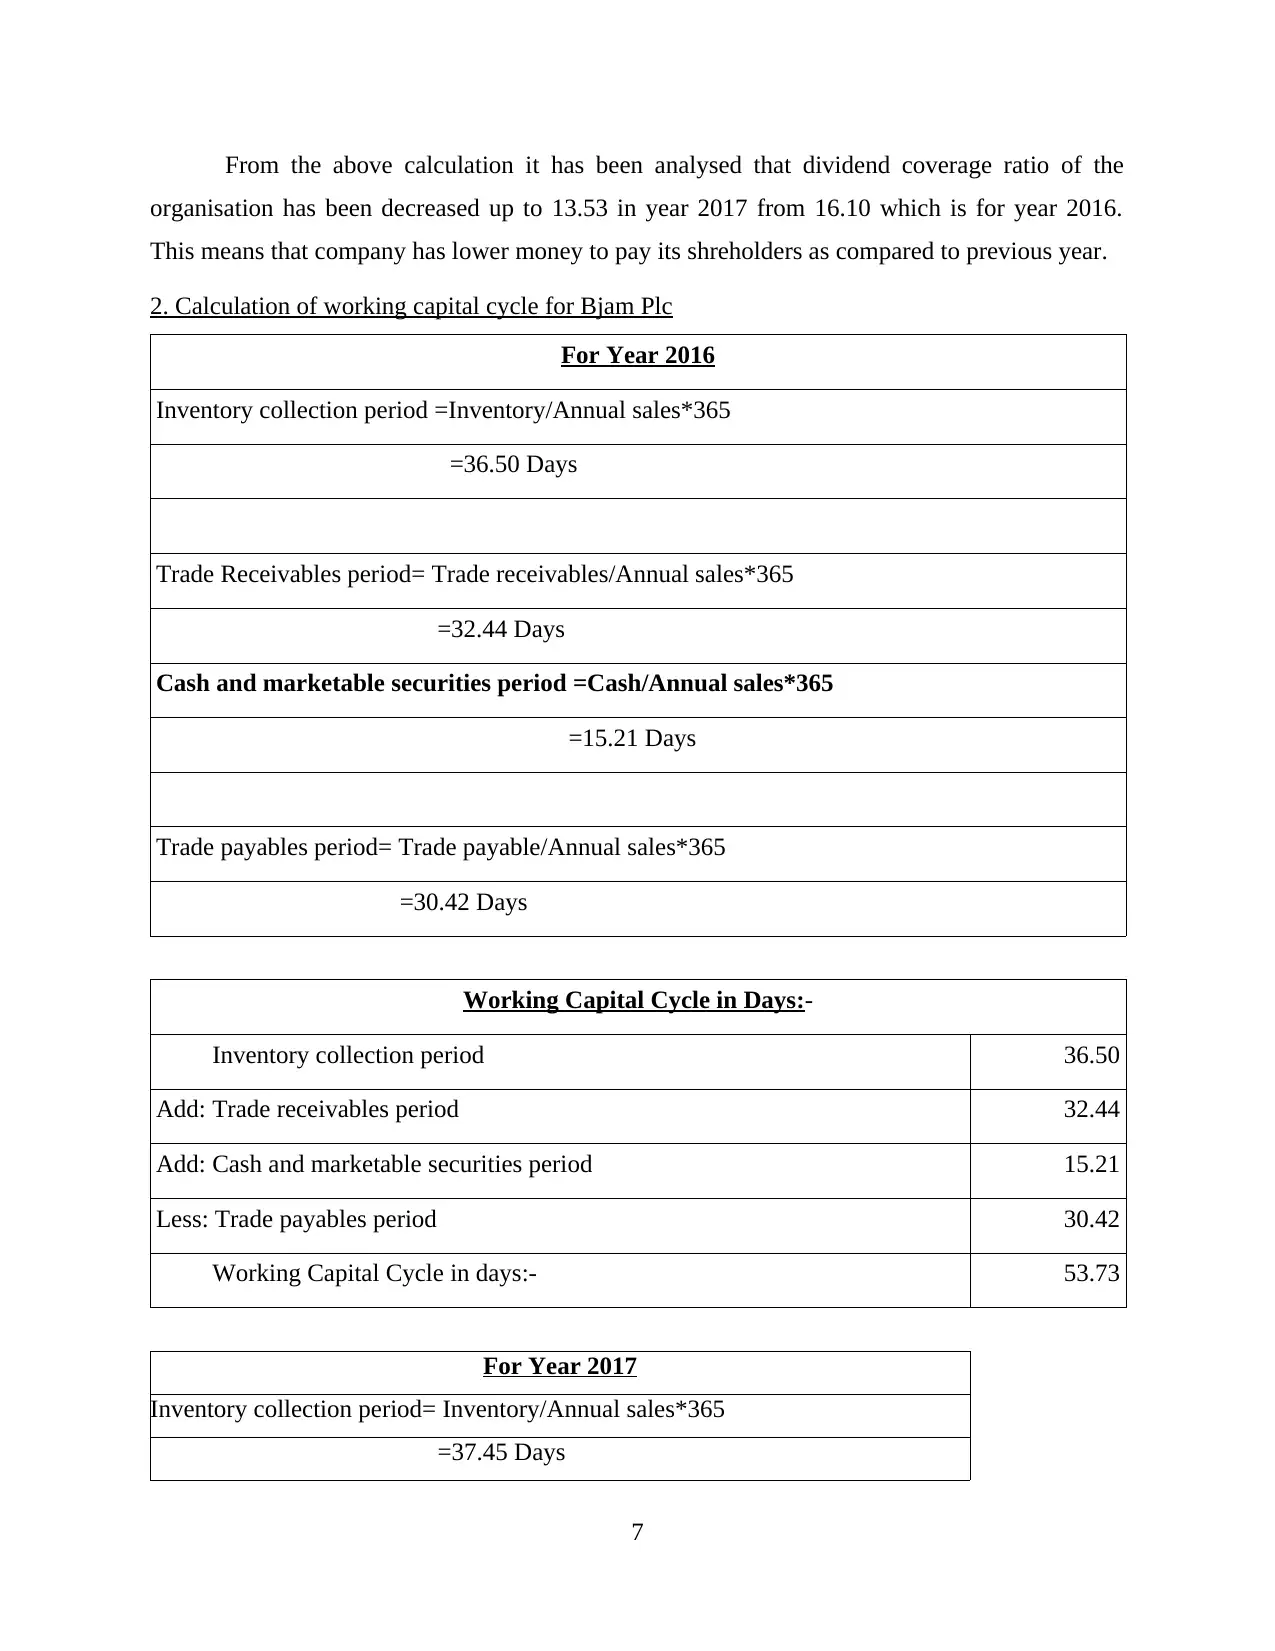
From the above calculation it has been analysed that dividend coverage ratio of the
organisation has been decreased up to 13.53 in year 2017 from 16.10 which is for year 2016.
This means that company has lower money to pay its shreholders as compared to previous year.
2. Calculation of working capital cycle for Bjam Plc
For Year 2016
Inventory collection period =Inventory/Annual sales*365
=36.50 Days
Trade Receivables period= Trade receivables/Annual sales*365
=32.44 Days
Cash and marketable securities period =Cash/Annual sales*365
=15.21 Days
Trade payables period= Trade payable/Annual sales*365
=30.42 Days
Working Capital Cycle in Days:-
Inventory collection period 36.50
Add: Trade receivables period 32.44
Add: Cash and marketable securities period 15.21
Less: Trade payables period 30.42
Working Capital Cycle in days:- 53.73
For Year 2017
Inventory collection period= Inventory/Annual sales*365
=37.45 Days
7
⊘ This is a preview!⊘
Do you want full access?
Subscribe today to unlock all pages.
Trusted by 1+ million students worldwide
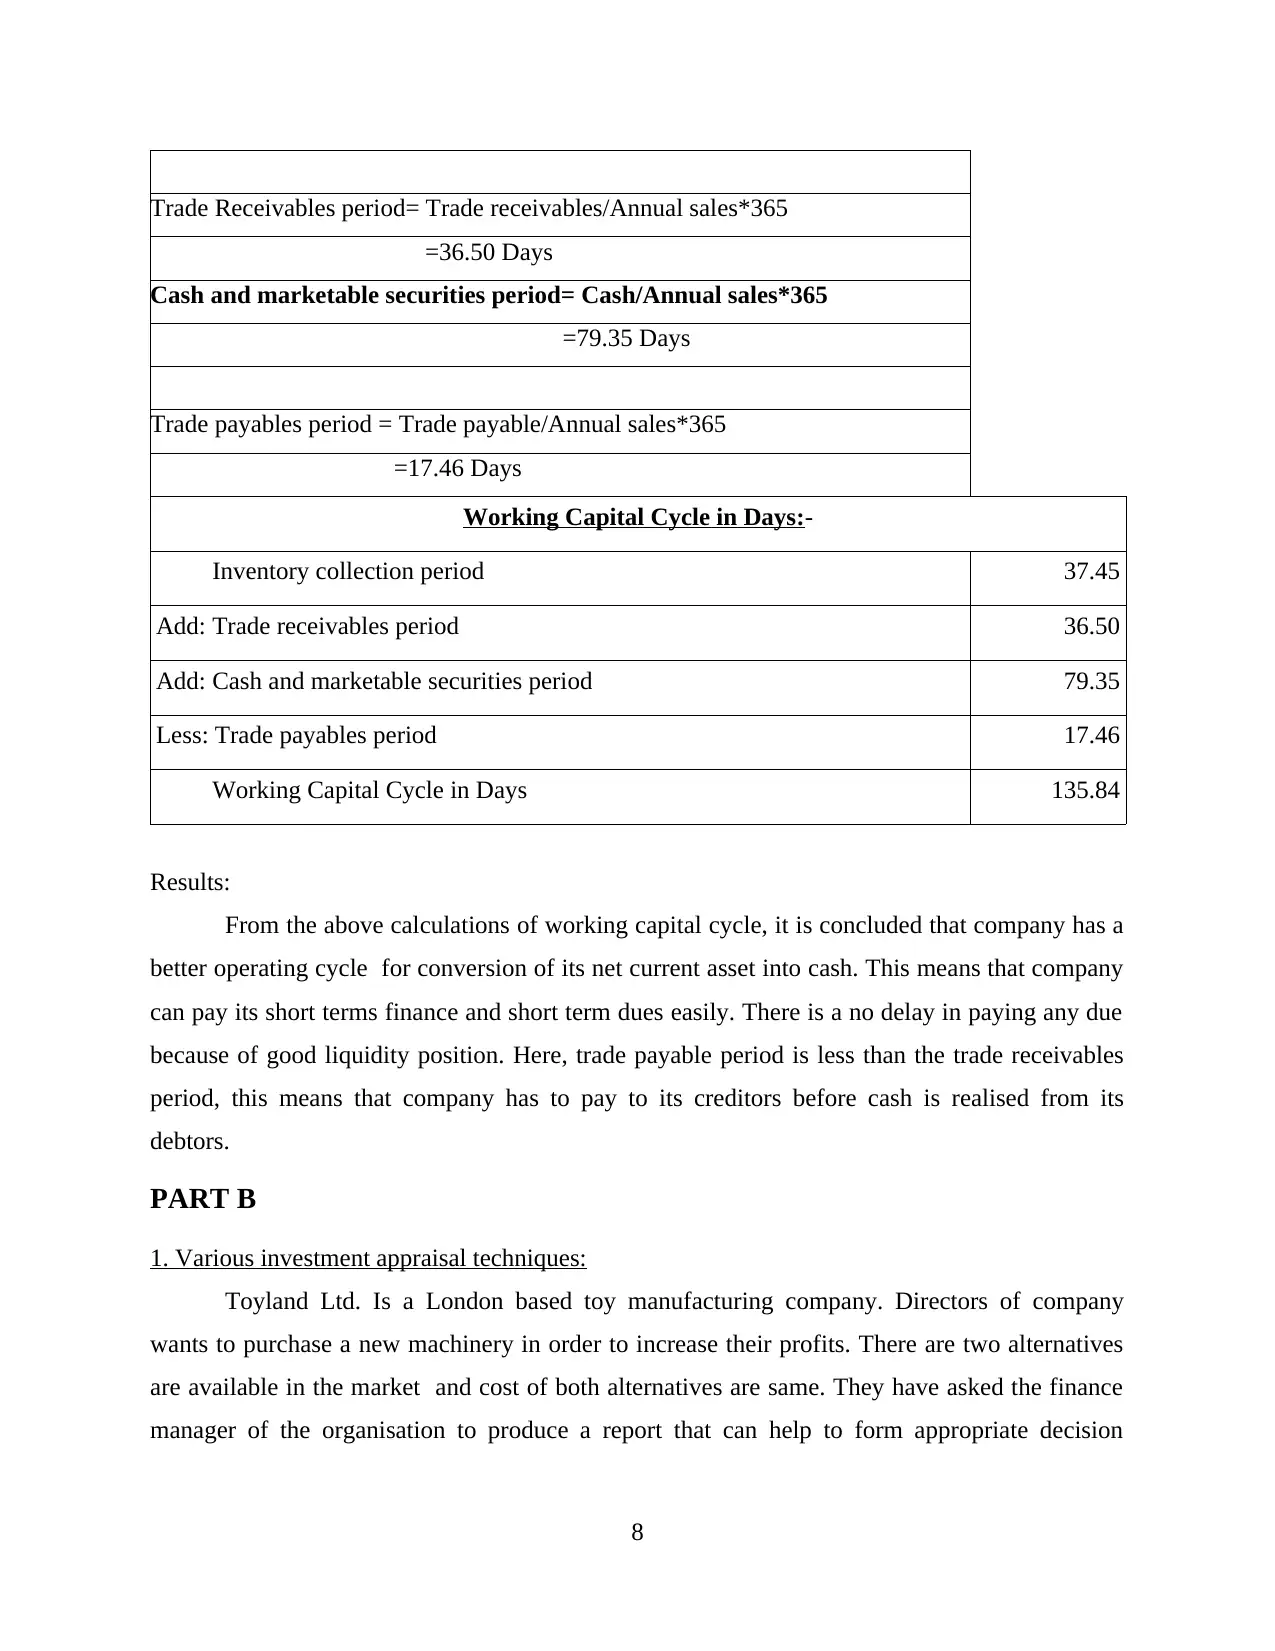
Trade Receivables period= Trade receivables/Annual sales*365
=36.50 Days
Cash and marketable securities period= Cash/Annual sales*365
=79.35 Days
Trade payables period = Trade payable/Annual sales*365
=17.46 Days
Working Capital Cycle in Days:-
Inventory collection period 37.45
Add: Trade receivables period 36.50
Add: Cash and marketable securities period 79.35
Less: Trade payables period 17.46
Working Capital Cycle in Days 135.84
Results:
From the above calculations of working capital cycle, it is concluded that company has a
better operating cycle for conversion of its net current asset into cash. This means that company
can pay its short terms finance and short term dues easily. There is a no delay in paying any due
because of good liquidity position. Here, trade payable period is less than the trade receivables
period, this means that company has to pay to its creditors before cash is realised from its
debtors.
PART B
1. Various investment appraisal techniques:
Toyland Ltd. Is a London based toy manufacturing company. Directors of company
wants to purchase a new machinery in order to increase their profits. There are two alternatives
are available in the market and cost of both alternatives are same. They have asked the finance
manager of the organisation to produce a report that can help to form appropriate decision
8
Paraphrase This Document
Need a fresh take? Get an instant paraphrase of this document with our AI Paraphraser
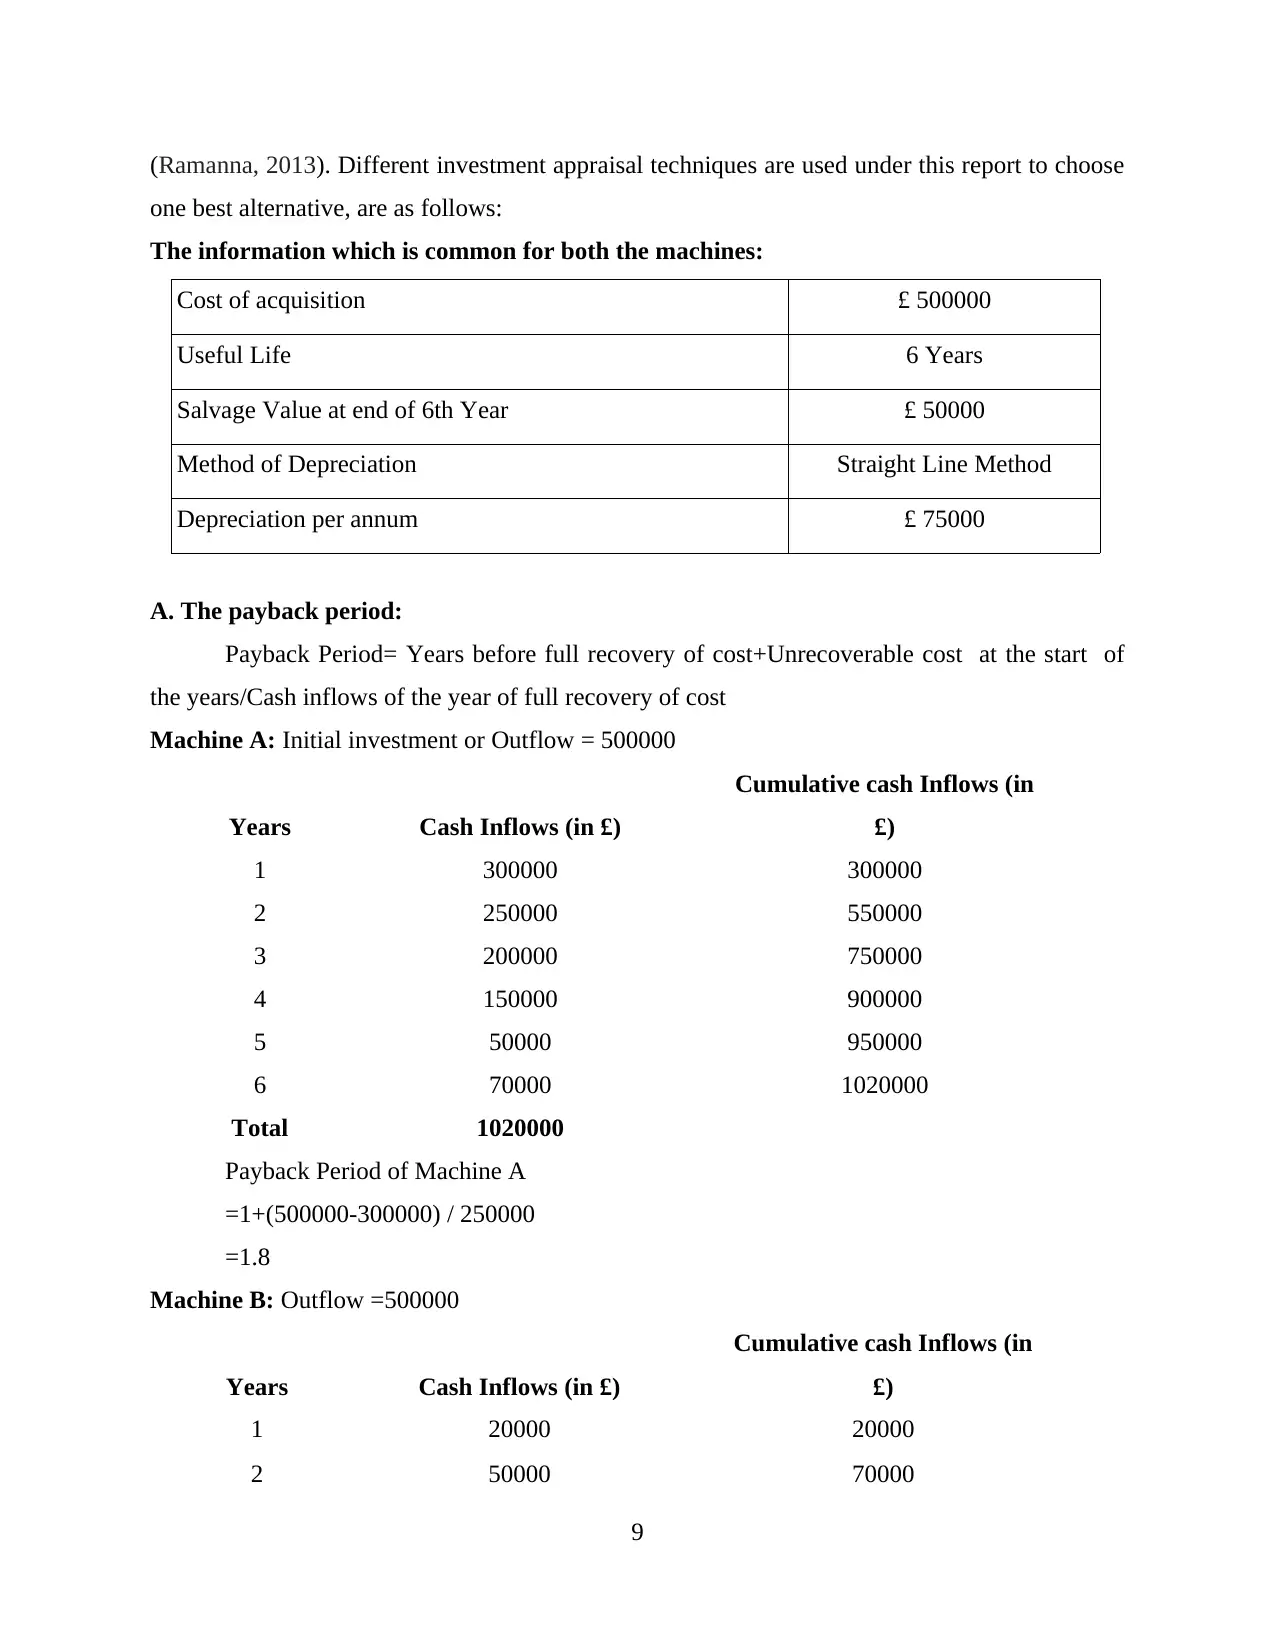
(Ramanna, 2013). Different investment appraisal techniques are used under this report to choose
one best alternative, are as follows:
The information which is common for both the machines:
Cost of acquisition £ 500000
Useful Life 6 Years
Salvage Value at end of 6th Year £ 50000
Method of Depreciation Straight Line Method
Depreciation per annum £ 75000
A. The payback period:
Payback Period= Years before full recovery of cost+Unrecoverable cost at the start of
the years/Cash inflows of the year of full recovery of cost
Machine A: Initial investment or Outflow = 500000
Years Cash Inflows (in £)
Cumulative cash Inflows (in
£)
1 300000 300000
2 250000 550000
3 200000 750000
4 150000 900000
5 50000 950000
6 70000 1020000
Total 1020000
Payback Period of Machine A
=1+(500000-300000) / 250000
=1.8
Machine B: Outflow =500000
Years Cash Inflows (in £)
Cumulative cash Inflows (in
£)
1 20000 20000
2 50000 70000
9
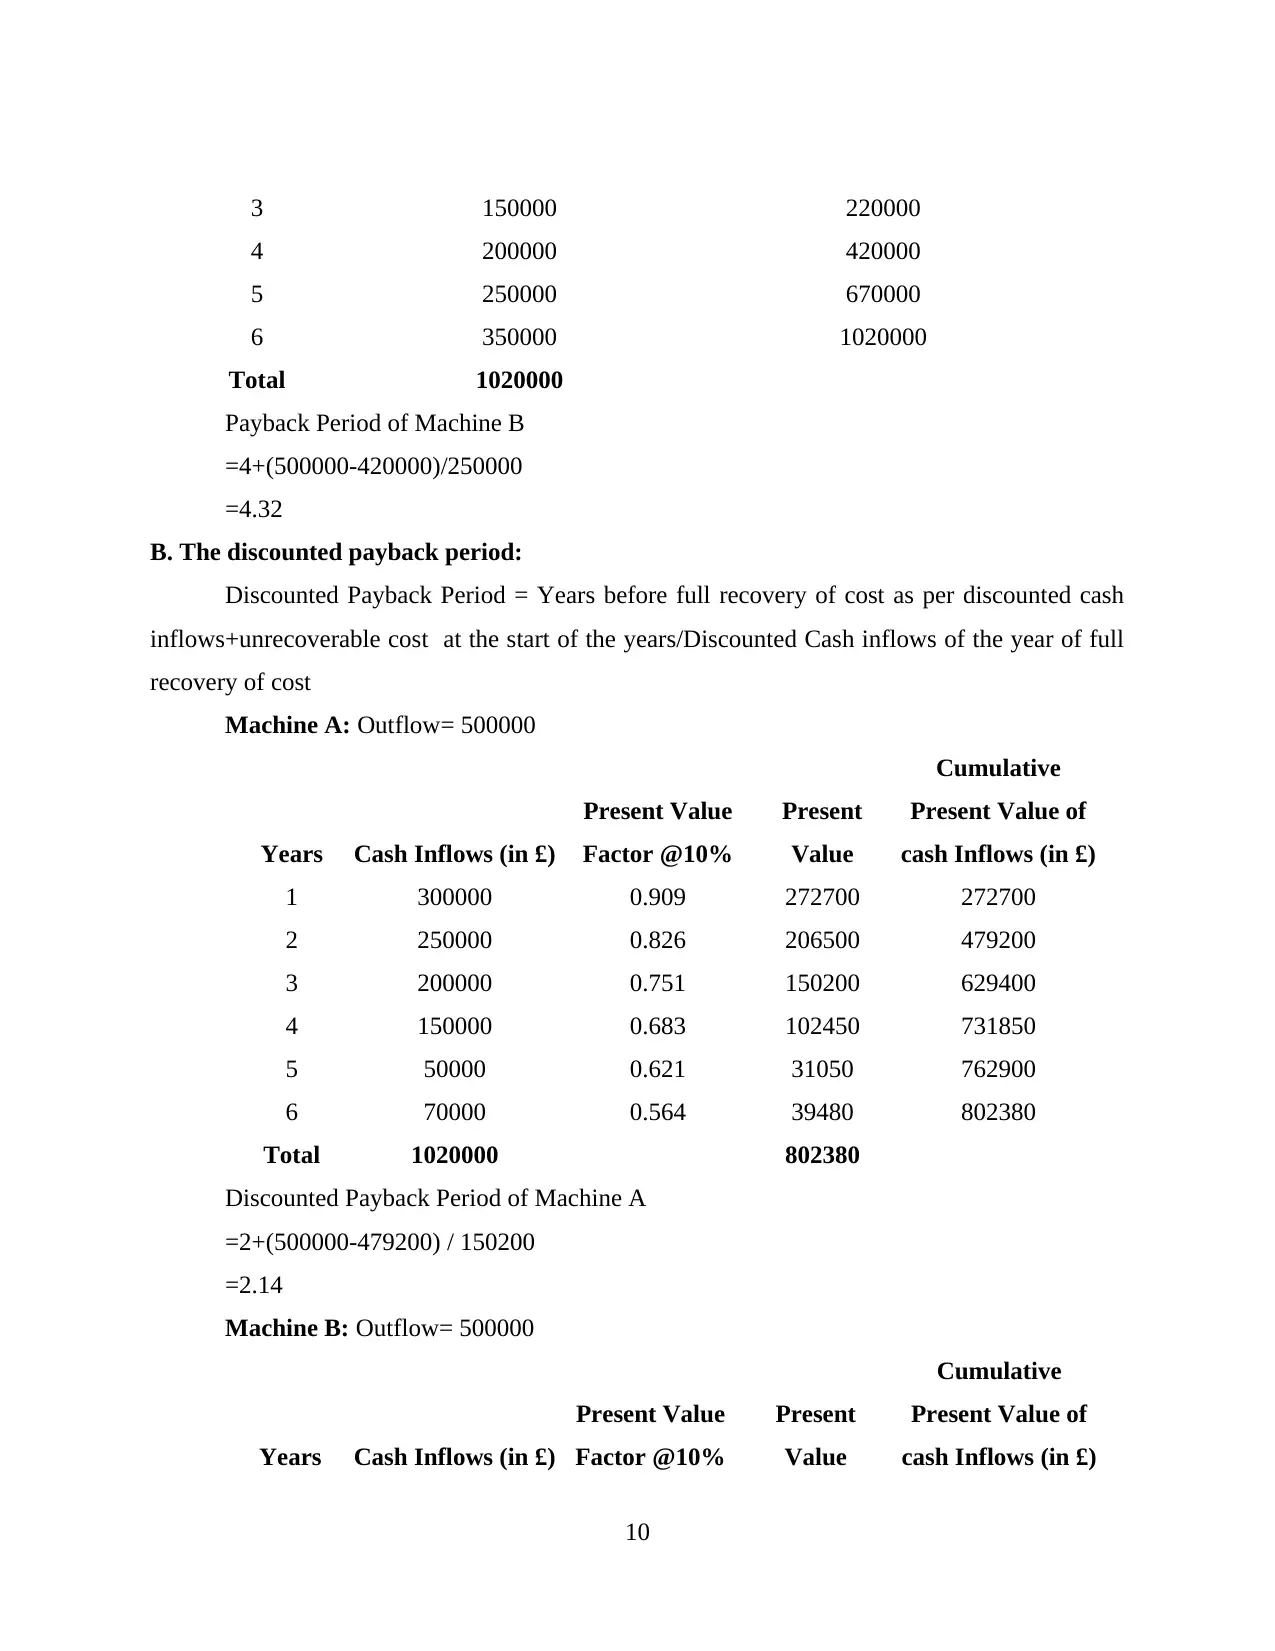
3 150000 220000
4 200000 420000
5 250000 670000
6 350000 1020000
Total 1020000
Payback Period of Machine B
=4+(500000-420000)/250000
=4.32
B. The discounted payback period:
Discounted Payback Period = Years before full recovery of cost as per discounted cash
inflows+unrecoverable cost at the start of the years/Discounted Cash inflows of the year of full
recovery of cost
Machine A: Outflow= 500000
Years Cash Inflows (in £)
Present Value
Factor @10%
Present
Value
Cumulative
Present Value of
cash Inflows (in £)
1 300000 0.909 272700 272700
2 250000 0.826 206500 479200
3 200000 0.751 150200 629400
4 150000 0.683 102450 731850
5 50000 0.621 31050 762900
6 70000 0.564 39480 802380
Total 1020000 802380
Discounted Payback Period of Machine A
=2+(500000-479200) / 150200
=2.14
Machine B: Outflow= 500000
Years Cash Inflows (in £)
Present Value
Factor @10%
Present
Value
Cumulative
Present Value of
cash Inflows (in £)
10
⊘ This is a preview!⊘
Do you want full access?
Subscribe today to unlock all pages.
Trusted by 1+ million students worldwide
1 out of 18
Related Documents


Your All-in-One AI-Powered Toolkit for Academic Success.
+13062052269
info@desklib.com
Available 24*7 on WhatsApp / Email
![[object Object]](/_next/static/media/star-bottom.7253800d.svg)
Unlock your academic potential
Copyright © 2020–2026 A2Z Services. All Rights Reserved. Developed and managed by ZUCOL.