Financial Management: Breakeven & Capital Budgeting Analysis
VerifiedAdded on 2022/08/19
|20
|6101
|10
Homework Assignment
AI Summary
This assignment provides a detailed analysis of financial management concepts. It begins with a breakeven analysis, calculating the production volume needed to achieve profitability, considering fixed and variable costs, and determining the breakeven point in units and days. The second part focuses on capital budgeting for the Derabel Company, evaluating a five-year project using Net Present Value (NPV) and Internal Rate of Return (IRR) to assess financial viability. The analysis includes revenue and cost projections, cash flow calculations, and a sensitivity analysis. The project's profitability is evaluated, with recommendations for further analysis. The document provides comprehensive calculations and financial insights relevant to the project's success.

Running head: MBA FINANCIAL MANAGEMENT
Financial Management
Name of the Student:
Name of the University:
Author’s Note:
Financial Management
Name of the Student:
Name of the University:
Author’s Note:
Paraphrase This Document
Need a fresh take? Get an instant paraphrase of this document with our AI Paraphraser
1FINANCIAL MANAGEMENT
Table of Contents
Question 1..........................................................................................................................2
Question 2..........................................................................................................................4
Question 3..........................................................................................................................8
Question 4........................................................................................................................12
Question 5........................................................................................................................13
Question 6........................................................................................................................15
References.......................................................................................................................17
2FINANCIAL MANAGEMENT
Question 1
a) The production volume at which the threshold level would breach out will be in the
form of breakeven analysis which would state the amount of units that needs to be well
sold for the purpose of maintaining the business profitable. Breakeven analysis is a key
financial tool that has been well used by financial managers for the purpose of
determining the amount of sales or contribution that a company needs to well make for
the purpose of covering the fixed cost that is associated with the business. Contribution
is well generated with the help of the by taking the total sales value less variable costs
that is associated with the product. The volume of production that the company needs to
well produce could be calculated with the help of the sales price of € 25/unit that the
company would be incurring based on the sales done. On the other hand, the variable
costs that is associated with the project has been around € 5/unit. The fixed costs that is
associated with the project has been around € 110,000 and the same would be well
considered for the purpose of calculating the threshold level of profitability that needs to
be well reached by the company.
Breakeven Point (In Units): Fixed Cost/(Sales Price Per Unit- Variable Cost Per
Unit)
Breakeven Point: € 110,000/(€25-€5)
Breakeven Point (In Units): 5,500 Units.
The calculation can be also shown with the help of other equation model as shown
below:
p*x=-cf+(cv*x)
25*x=110,000+(5*x)
25x-5x=110,000
X=110,000/20
X=5,500 units-
⊘ This is a preview!⊘
Do you want full access?
Subscribe today to unlock all pages.
Trusted by 1+ million students worldwide
3FINANCIAL MANAGEMENT
b) It is important that the company well reaches the breakeven point or sells the
minimum amount of quantity in order to well cover the fixed cost so that the profitability
or stability of the business well remains. It is important that company well maintains
breakeven point by estimating the fixed costs that it would be incurring and the amount
of contribution it will be having for covering the fixed costs of the company. The
breakeven amount in days has well been calculated for the company for the defined
point of time so that the company well knows the amount or period of days in which it
needs to well cover the fixed costs and how it could do the same. The management of
the company can well take important and crucial steps by well analysing the relevant
sales and relevant marketing strategies that it need to for well covering or reporting
down the sales value of the company. In order to well calculate the breakeven point for
the company or the days the company would be taking for well reaching the threshold
level can be well calculated and shown as below:
The annual sales of the company has been around 20,000 which well states that on
a daily basis the company needs to well sell around 55 units on a daily basis. The total
sales unit derived on a daily basis has been around 55 units and the sales price that the
company will be selling the products will be around € 25. Thus, if we multiply the daily
unit sold with the sales price per unit this makes the total sales value to be around
€1375 on a daily basis. The brief calculation of the same can be well shown below as
follows:
20,000/365=54.79 or 55 Unit or Amount needs to be sold on a daily basis
55*25€ unit=1375 €per day
110,005€/1375€=80 days
c) The sales value or turnover that would be over the threshold level will be around
€110,000 and the same has been well calculated with the help of above calculations
done. The sales value in excess or corresponding to the threshold value in the
profitability can be well calculated with the help of the excess value that would be sold
by the company in excess of the required amount for breakeven.
Paraphrase This Document
Need a fresh take? Get an instant paraphrase of this document with our AI Paraphraser
4FINANCIAL MANAGEMENT
Question 2
Capital Budgeting
The capital budgeting project has been well done for Derabel Company for a sum
of five years whereby relevant changes in the project has been well done by taking the
various cash inflows and cash outflows of the project that the project would be
experiencing. The initial set of investment that is required from the project has been
around €200,000 and the estimated life of the project was calculated to be around five-
years. All the cash inflows that the company would be experiencing in this sum of five
years will be taken into consideration for the purpose of analysis. Capital budgeting
would be helping us better address the financial viability of the project with the help of
the key financial tools like the Net Present Value and Internal Rate of Return that has
been well used in this case for the purpose of well evaluating the overall financial
stability of the project.
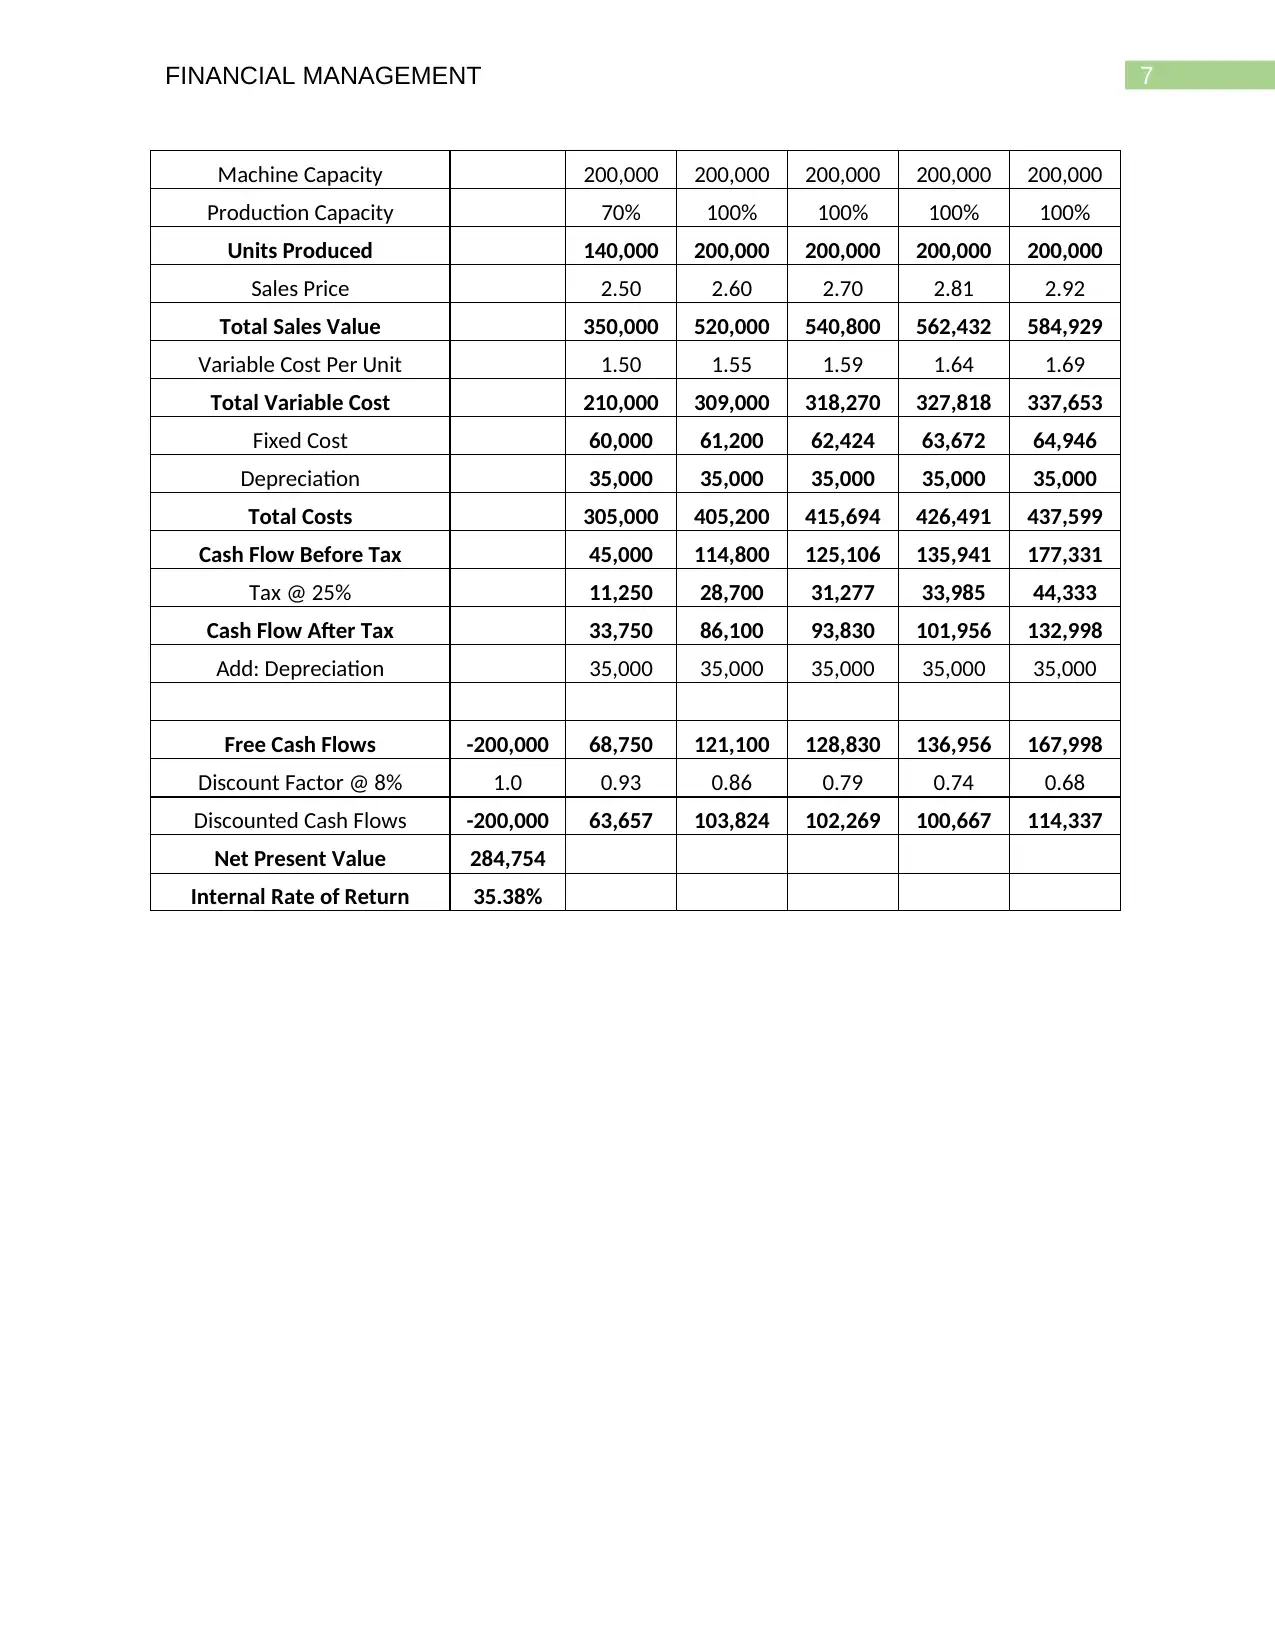
Revenue Analysis: The revenue that the project would be receiving from the project
will be based on the productive capacity of the plant that is around 200,000 units which
is the capacity of the plant. However, it is important to note that the capacity of the plant
in the first year of operations will be around 70% which well states that the company
would be producing around 140,000 units of goods which would be giving a total sales
value of €350,000. However, it is important to note that the sales value of the project is
expected to well increase to a consistent level to around 100% capacity and then
company is expected to well sell around 200,000 units of goods from the second year
onwards till the fifth year of operations which would be giving an total sales value to the
company to near about 520,000. The increase in the sales price of the company has
been well kept at an increasing rate of about 4% which well states the same would be
increasing the revenue base of the project for the given set of time period analysed.
Cost Analysis: The costs that the company would be experiencing will be primarily in
the field of variable costs and fixed costs that the project would be observing for a given
set of five years. The relevant changes in the costs that is increasing trend rate has
Question 2
Capital Budgeting
The capital budgeting project has been well done for Derabel Company for a sum
of five years whereby relevant changes in the project has been well done by taking the
various cash inflows and cash outflows of the project that the project would be
experiencing. The initial set of investment that is required from the project has been
around €200,000 and the estimated life of the project was calculated to be around five-
years. All the cash inflows that the company would be experiencing in this sum of five
years will be taken into consideration for the purpose of analysis. Capital budgeting
would be helping us better address the financial viability of the project with the help of
the key financial tools like the Net Present Value and Internal Rate of Return that has
been well used in this case for the purpose of well evaluating the overall financial
stability of the project.
Revenue Analysis: The revenue that the project would be receiving from the project
will be based on the productive capacity of the plant that is around 200,000 units which
is the capacity of the plant. However, it is important to note that the capacity of the plant
in the first year of operations will be around 70% which well states that the company
would be producing around 140,000 units of goods which would be giving a total sales
value of €350,000. However, it is important to note that the sales value of the project is
expected to well increase to a consistent level to around 100% capacity and then
company is expected to well sell around 200,000 units of goods from the second year
onwards till the fifth year of operations which would be giving an total sales value to the
company to near about 520,000. The increase in the sales price of the company has
been well kept at an increasing rate of about 4% which well states the same would be
increasing the revenue base of the project for the given set of time period analysed.
Cost Analysis: The costs that the company would be experiencing will be primarily in
the field of variable costs and fixed costs that the project would be observing for a given
set of five years. The relevant changes in the costs that is increasing trend rate has
5FINANCIAL MANAGEMENT
been well considered for the five year project. The variable costs on a per unit basis that
would be charged for the products produced would be around €1.50 and the same is
expected to well increase at a rate of 3% for the company in the time period that has
been analysed. The fixed costs that is directly attributed to the project would be around
€60,000 and the same is expected to well increase at a rate of 2% for the company in
the trend period that has been well analysed for the company. Depreciation on the other
hand, would also be treated as a fixed expense for the company whereby the initial sum
of investment that has been invested into the project which is around €200,000 would
be depreciated for a sum of five years after accounting for the residual value of €30,000
that the company would be receiving from the project. Thus, the depreciation expense
that the project would be experiencing was calculated to be around €35,000 for all the
five year trend period.
Cash Flows: The cash flows that the company would be receiving from the
project in this five year of trend period has been well calculated by taking the revenue
base which is the cash inflows and the cash outflows that the company would be
experiencing from the project for a sum of five years. The taxation rate that has been
charged to the cash flows has been around 25% in order to well get the cash flows after
tax for the project for a sum of five years for the project. The discount factor on the other
hand, that has been well considered for the project has been around 8% which was well
calculated for the project for getting the discounted cash flows of the project for a sum of
five years for the project. It is important to note that since depreciation is treated as a
non-cash expenses the same has been well added back to the total cash flows of the
company for a sum of five year for the project in order to well get the free cash flows for
the project. Depreciation expense is treated as a non-cash expense which well helps in
getting a tax shield for the company and the same is treated or added back after getting
the after tax amount. The internal rate of return for the project has been well calculated
with the help of cash flows that the company would be receiving from the project in the
sum of four year of trend period. The cash flows that would be flowing to the company
has been well calculated based on the total collections done by the company less the
amount of payments that has been done by the company for a sum of four years. The
net present value on the other hand has been calculated by taking all the relevant cash
⊘ This is a preview!⊘
Do you want full access?
Subscribe today to unlock all pages.
Trusted by 1+ million students worldwide
6FINANCIAL MANAGEMENT
inflows and outflows for the sum of five years discounted at the rate of 8% for the
project.
Project Results: The result of the project has been well calculated with the help of key
capital budgeting tools that have been well deployed by the company in order to well
asses the overall financial viability of the project. The key capital budgeting tools
deployed has been Net Present Value and Internal Rate of Return which was well used
by the company to well account for the profitability of the project. Net present Value of
the project shows the excess amount of cash flows that the project would be giving to
the shareholders or the capital holders for taking the risk or for doing the desired level of
investment. The net present value for the project has been around €284,754 and the
internal rate of return for the project has been around 35.38% which well states that the
project would be creating an excess value of around €284,754, which when compared
in percentage terms has been around 35.38% for the project. The internal rate of return
that has been around 35.38% shows the return generated from the project by taking the
initial sum of investment. The higher the IRR of the project is the better is the financial
viability of the project.
From a recommendation point of view it is equally important that the
management of the company take important and crucial steps for well recognizing and
incorporating various non- financial factors which in turn may help assess the better
valuation of the project. At the same time sensitivity analysis can also be used by the
managers for the better evaluation of the project whereby changes in the key input
variables like the selling price per unit of the product would be well considered for
observing the net outcome that would be received from the project in the given set of
time period that has been well analysed.
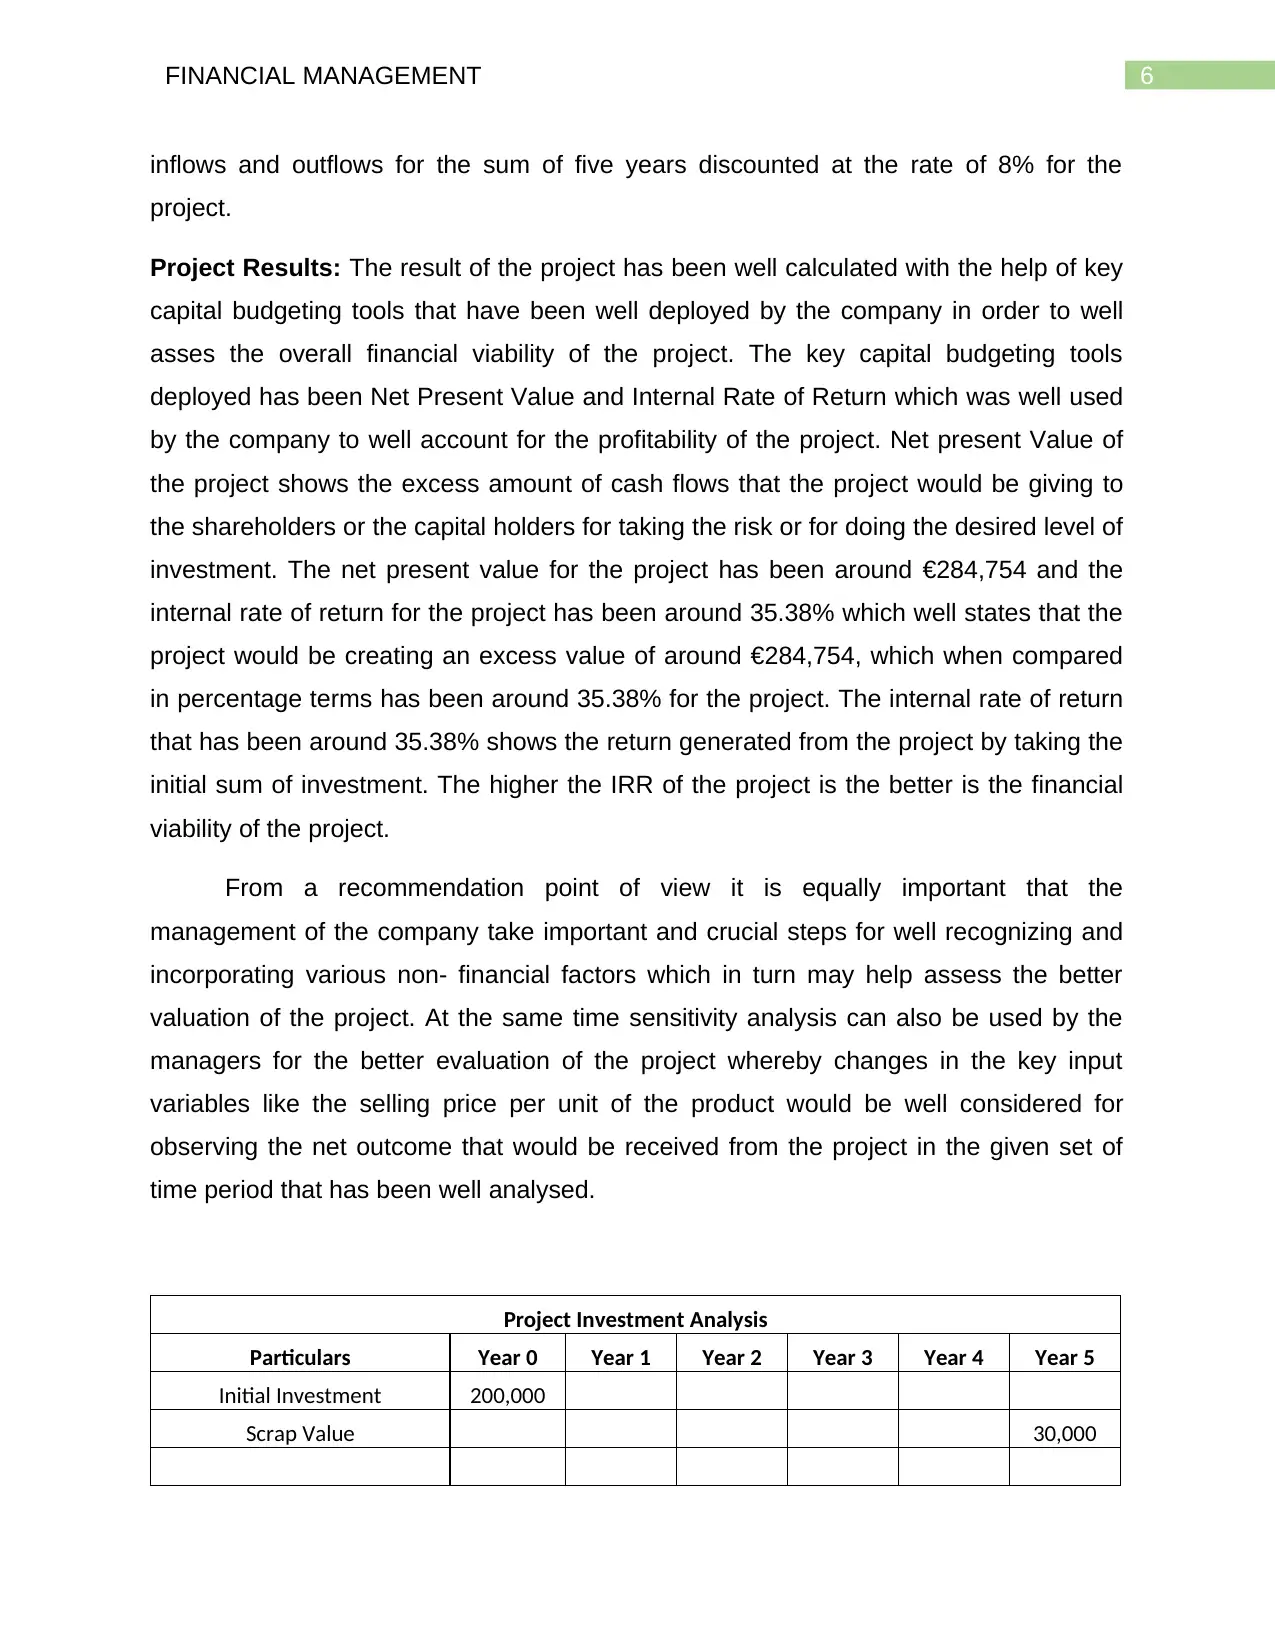
Project Investment Analysis
Particulars Year 0 Year 1 Year 2 Year 3 Year 4 Year 5
Initial Investment 200,000
Scrap Value 30,000
inflows and outflows for the sum of five years discounted at the rate of 8% for the
project.
Project Results: The result of the project has been well calculated with the help of key
capital budgeting tools that have been well deployed by the company in order to well
asses the overall financial viability of the project. The key capital budgeting tools
deployed has been Net Present Value and Internal Rate of Return which was well used
by the company to well account for the profitability of the project. Net present Value of
the project shows the excess amount of cash flows that the project would be giving to
the shareholders or the capital holders for taking the risk or for doing the desired level of
investment. The net present value for the project has been around €284,754 and the
internal rate of return for the project has been around 35.38% which well states that the
project would be creating an excess value of around €284,754, which when compared
in percentage terms has been around 35.38% for the project. The internal rate of return
that has been around 35.38% shows the return generated from the project by taking the
initial sum of investment. The higher the IRR of the project is the better is the financial
viability of the project.
From a recommendation point of view it is equally important that the
management of the company take important and crucial steps for well recognizing and
incorporating various non- financial factors which in turn may help assess the better
valuation of the project. At the same time sensitivity analysis can also be used by the
managers for the better evaluation of the project whereby changes in the key input
variables like the selling price per unit of the product would be well considered for
observing the net outcome that would be received from the project in the given set of
time period that has been well analysed.
Project Investment Analysis
Particulars Year 0 Year 1 Year 2 Year 3 Year 4 Year 5
Initial Investment 200,000
Scrap Value 30,000
Paraphrase This Document
Need a fresh take? Get an instant paraphrase of this document with our AI Paraphraser
7FINANCIAL MANAGEMENT
Machine Capacity 200,000 200,000 200,000 200,000 200,000
Production Capacity 70% 100% 100% 100% 100%
Units Produced 140,000 200,000 200,000 200,000 200,000
Sales Price 2.50 2.60 2.70 2.81 2.92
Total Sales Value 350,000 520,000 540,800 562,432 584,929
Variable Cost Per Unit 1.50 1.55 1.59 1.64 1.69
Total Variable Cost 210,000 309,000 318,270 327,818 337,653
Fixed Cost 60,000 61,200 62,424 63,672 64,946
Depreciation 35,000 35,000 35,000 35,000 35,000
Total Costs 305,000 405,200 415,694 426,491 437,599
Cash Flow Before Tax 45,000 114,800 125,106 135,941 177,331
Tax @ 25% 11,250 28,700 31,277 33,985 44,333
Cash Flow After Tax 33,750 86,100 93,830 101,956 132,998
Add: Depreciation 35,000 35,000 35,000 35,000 35,000
Free Cash Flows -200,000 68,750 121,100 128,830 136,956 167,998
Discount Factor @ 8% 1.0 0.93 0.86 0.79 0.74 0.68
Discounted Cash Flows -200,000 63,657 103,824 102,269 100,667 114,337
Net Present Value 284,754
Internal Rate of Return 35.38%
8FINANCIAL MANAGEMENT
Question 3
The finance manager of the MGT Company is interested to know the company’s
situation with respect to the industrial sector to which the company belongs. Data
regarding the industry are as follows:
Liquidity ratios: current ratio – 1.55; quick ratio – 1.20
Debt ratio – 1.25; margin on sales – 21%; investment rotation – 1.45times
Economic profitability – 23%; financial profitability – 29%
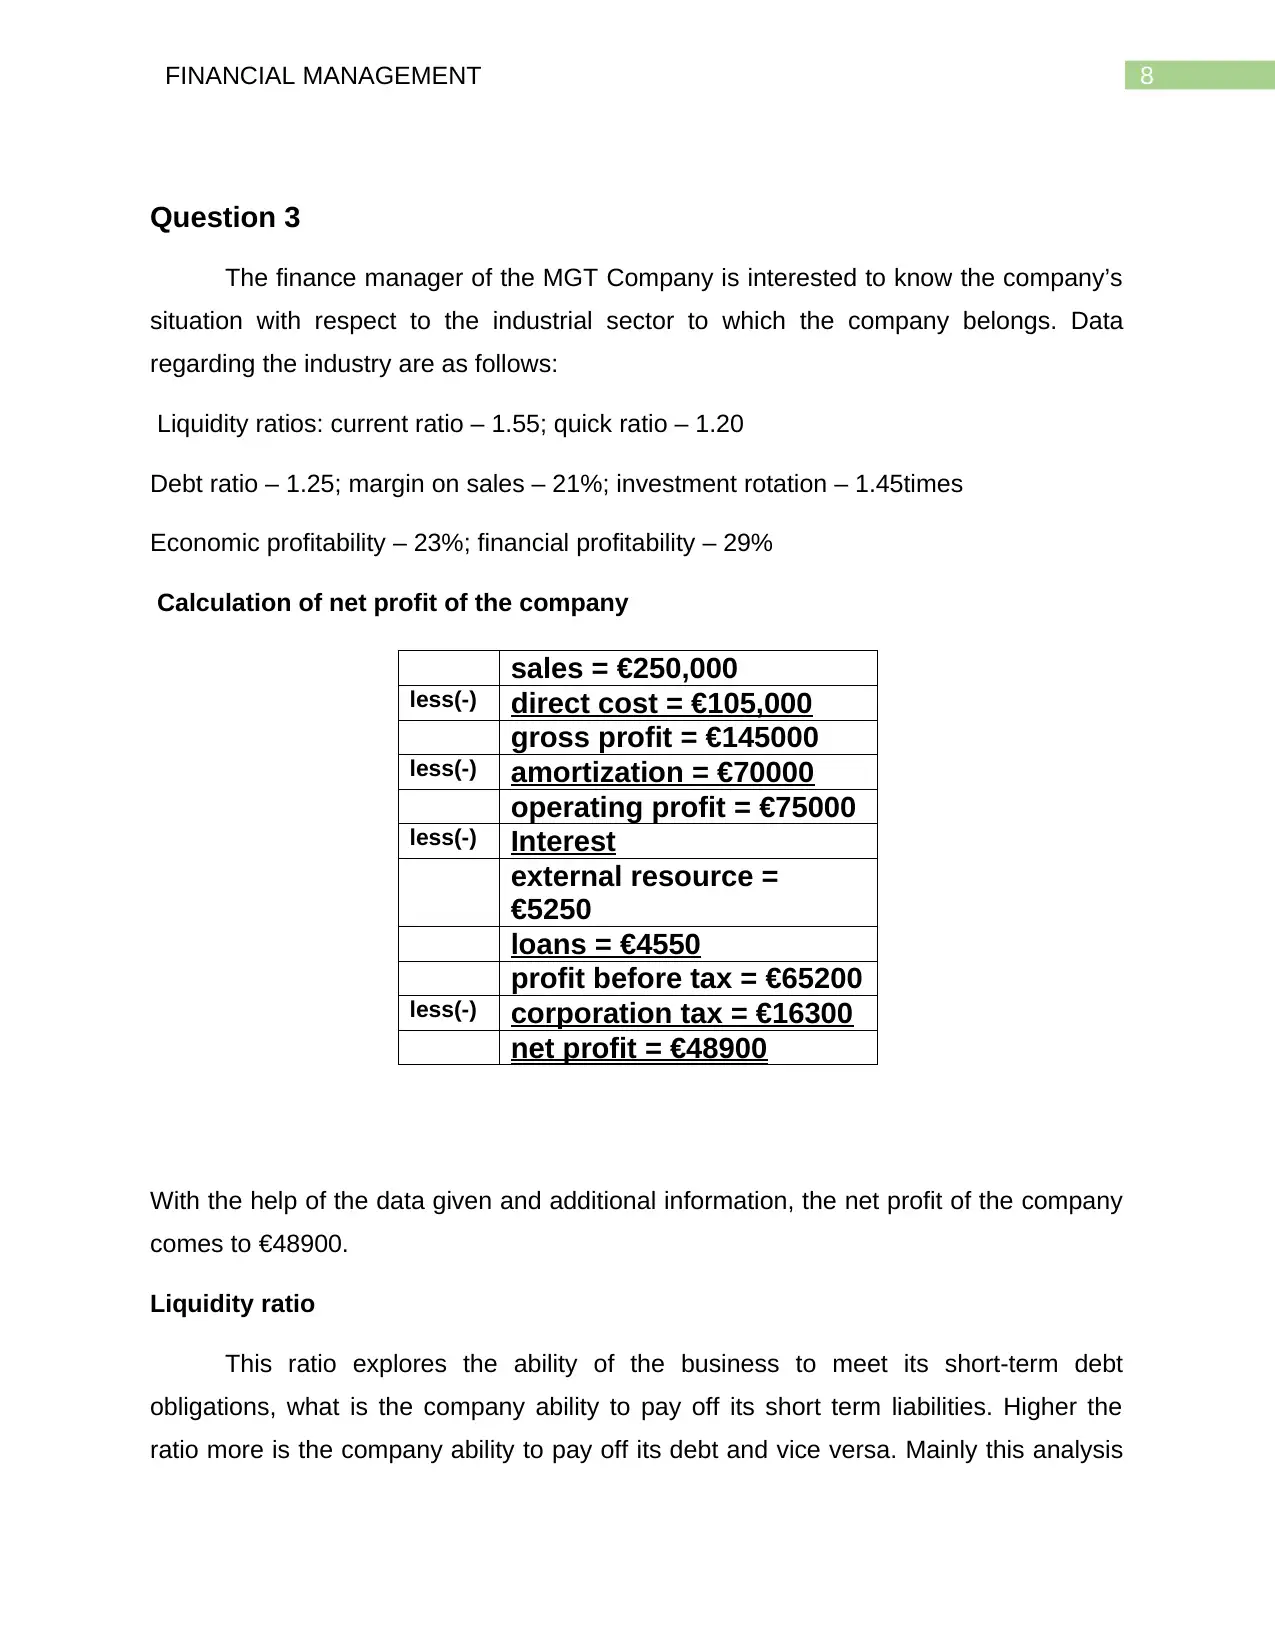
Calculation of net profit of the company
With the help of the data given and additional information, the net profit of the company
comes to €48900.
Liquidity ratio
This ratio explores the ability of the business to meet its short-term debt
obligations, what is the company ability to pay off its short term liabilities. Higher the
ratio more is the company ability to pay off its debt and vice versa. Mainly this analysis
sales = €250,000
less(-) direct cost = €105,000
gross profit = €145000
less(-) amortization = €70000
operating profit = €75000
less(-) Interest
external resource =
€5250
loans = €4550
profit before tax = €65200
less(-) corporation tax = €16300
net profit = €48900
Question 3
The finance manager of the MGT Company is interested to know the company’s
situation with respect to the industrial sector to which the company belongs. Data
regarding the industry are as follows:
Liquidity ratios: current ratio – 1.55; quick ratio – 1.20
Debt ratio – 1.25; margin on sales – 21%; investment rotation – 1.45times
Economic profitability – 23%; financial profitability – 29%
Calculation of net profit of the company
With the help of the data given and additional information, the net profit of the company
comes to €48900.
Liquidity ratio
This ratio explores the ability of the business to meet its short-term debt
obligations, what is the company ability to pay off its short term liabilities. Higher the
ratio more is the company ability to pay off its debt and vice versa. Mainly this analysis
sales = €250,000
less(-) direct cost = €105,000
gross profit = €145000
less(-) amortization = €70000
operating profit = €75000
less(-) Interest
external resource =
€5250
loans = €4550
profit before tax = €65200
less(-) corporation tax = €16300
net profit = €48900
⊘ This is a preview!⊘
Do you want full access?
Subscribe today to unlock all pages.
Trusted by 1+ million students worldwide
9FINANCIAL MANAGEMENT
deals with the short-term assets and liabilities that can be easily converted into cash to
pay off certain current obligation of the firm (Ghasemi& Ab Razak, 2016). Current ratio
identifies whether a company has ample resource to meet its short-term obligations.
Comparison of current assets and current liabilities is done to evaluate this ratio. Quick
ratio is also known as acid test ratio. Comparison of total amount of cash and cash
equivalents, account receivable and other current assets excluding inventory and
marketable securities to the total amount of current liabilities is done. Calculating current
ratio proves to be very beneficial for the company as this ratio deals with short-term
obligation and its shows the liquidity position of the company (Ehiedu, 2014). The
company can measure the required amount that it needs to generate within a short
period to pay off its debt obligations. By evaluating this ratio, investors and analyst can
know how a company can increase its current assets to satisfy its current liabilities. The
quick ratio is also used to measure the liquidity position of the firm. For paying off the
debt obligation of the firm immediately, this ratio is used and a more thorough test of
liquidity than the current ratio. It can be an equivalent ratio to the current ratio. In this
case, the industry current ratio is 1.25 whereas the company’s current ratio comes to
1.89. The quick ratio of the industry is 1.20 and 1.42 is the ratio for the company. Both
the liquidity ratios are more favorable for the company than for the industry as it is
profitable for any firm to have higher liquidity ratio (Singh, 2017). In this situation the
liquidity ratios of company is more than that of the industry ratios. This reflects the
company is more capable of paying off its current debt obligation and has ample of
assets that can be used in future to pay off its obligation. To remain solvent the current
ratio of the firm should be one and in this situation, the firm is having extra funds. Even
after paying off its current debt there will be some funds left with the firm, which means
the firm is in good position (Kaya, 2014). To become solvent the ratio should be one or
more than one, thus the firm needs to increase its current assets to become liable to
pay off its debt in future that may arise because of some uncertainty. Both industry and
company are solvent and should try to maintain this solvency nature in future and even
try to increase the assets to become more secure. A stable liquidity ratio reflects good
reputation in the market and even attract investments.
Paraphrase This Document
Need a fresh take? Get an instant paraphrase of this document with our AI Paraphraser
10FINANCIAL MANAGEMENT
Debt ratio
It refers to one type of solvency ratio. It takes into account the company total
liabilities as a percentage of total assets. The main objective to calculate debt ratio is to
measure the company ability to pay off its debt obligation by using the company’s
assets. This ratio identifies, to pay off liabilities what amount of assets needs to be sold
by the company. Investors or lenders depends on the debt ratio to know the amount of
risk associated with the business as debt ratio evaluates the financial leverage of the
company. Higher is the leveraged ratio more is the risk for the lenders (Khadafi, Heikal
& Ummah, 2014). Before making any investment in the company, the investors and
creditors analyses the debt burden of the company and even measures the ability to set
off all the obligations of debt in future due to some uncertainty. All lenders and creditors
are interested in profitability of the firm. They want profitable returns from their
investment thus before investing in the company or financing any activities of the firm,
the creditors will look into the solvency ratio. Their main concern is about being repaid.
The debt ratio of the industry is 1.25 where as it comes to 0.57 for the company. A debt
ratio of 0.5 is often considered less risky. In this case, the industry shows a more risky
situation for the creditors and lenders as the ratio is more than one, liabilities are more
as compared to the total assets of the firm. The industry will face some difficulties to pay
off its obligation, if it has decided to pay off its liabilities by using the assets of the
industry. In this analysis, the company’s ratio comes to 0.57, which shows the company
has twice as many assets as liabilities. For every firm solvency ratios should be lower
as a lower ratio is more beneficial than a higher ratio. A more stable situation with
potential longevity can be achieved if the debt ratio of a firm comes to lower (Fullwiler,
2016). Lower debt ratio reflects lower overall debt. The company is having a stable debt
ratio whereas the industry is not, the industry needs to work on its assets, to lower the
ratio and attract investors. It will be better for the industry if it go for equity financing, as
equity financing is less risky than debt financing to grow their operations and by this it
can improve its solvency position.
Economic and financial return ratios
11FINANCIAL MANAGEMENT
The economic and financial return of the company can be identified by evaluating
the profitability ratios. Investors, lenders or creditors are interested in profitability ratios
as it shows how much a company can earn within a specific period and how much
profits the investors will be getting if they invest in that particular company. Gross profit
margin and net profit margin are calculated for this company to know the return of the
company in terms of financial investment and economical investment. The gross profit
margin deals with how the firm manage its inventory and manufacturing costs. The
higher the margin ratio, the better for the business (Cournède, & Denk, 2015). The
operational efficiency of the firm can be measured by evaluating these ratios. These
ratios reflect the results of business operations. Management attempts to maximize
these ratios to maximize firm value. The results can be evaluated in terms of its
earnings with reference to a given level of assets or sales or owners interest. The gross
profit of the company comes to 58% and the net profit comes to 19.56%. Gross profit
measure the percentage of each sales in rupees remaining after payment of the goods
sold. Gross profit margin depends on the relationship between price and sales, volume
and costs. A high gross profit margin is a favorable sign of good management (Fullwiler,
2016). Higher the gross profit more efficient the company is. This company gross profit
is 58%, which is beneficial for the firm, even though the company should try to increase
the ratio to establish a more stable position in the market. Sales revenue should be
increased to makes the gross profit margin ratio more suitable for the business.
Investors and creditors are more interested in the companies having a higher gross
profit. They will invest more as there will be a security of their invested funds, which the
company will repay them within a specified time. A higher gross profit ratio reflects that
the firm has the ability to make reasonable profit on sales. The company should try to
minimize the cost of goods sold which is the main factor that can affect the gross profit
margin of the company. Net profit margin measures the relationship between net profit
and sales of the business. Net profit finds the proportion of revenue that finds its way
into profit. A high net profit will ensure positive returns of the business. In addition, the
economic profit and accounting profit of the company can be evaluated by analyzing the
profitability of the firm (Necula, 2017). The profit that is remaining after deducting all the
costs is known as economic profit. The economic profit of the industry comes to 23%
⊘ This is a preview!⊘
Do you want full access?
Subscribe today to unlock all pages.
Trusted by 1+ million students worldwide
1 out of 20
Related Documents


Your All-in-One AI-Powered Toolkit for Academic Success.
+13062052269
info@desklib.com
Available 24*7 on WhatsApp / Email
![[object Object]](/_next/static/media/star-bottom.7253800d.svg)
Unlock your academic potential
Copyright © 2020–2026 A2Z Services. All Rights Reserved. Developed and managed by ZUCOL.