An Analysis of Capital Budgeting in Financial Management
VerifiedAdded on 2020/04/15
|19
|4888
|44
Report
AI Summary
This report delves into the intricacies of capital budgeting, a crucial aspect of financial management, exploring various techniques used by businesses to evaluate long-term investments. It examines the use of Net Present Value (NPV), Internal Rate of Return (IRR), Payback Period (PBP), Profitability Index (PI), and Accounting Rate of Return (ARR), highlighting their applications and limitations. The report analyzes the recent trends in literature, emphasizing the prevalence of discounted cash flow techniques like NPV and IRR as primary methods, while the payback period is often used as a secondary approach. It discusses the usefulness of these techniques in wealth creation, emphasizing their role in setting long-term goals, appraising investment projects, forecasting cash flows, and controlling expenditures. The report provides examples and concludes by summarizing the importance of these techniques in making informed investment decisions and contributing to the overall financial health of a company.

Running head: FINANCIAL MANAGEMENT
Financial Management
Name of the Student
Name of the University
Author’s Note
Financial Management
Name of the Student
Name of the University
Author’s Note
Paraphrase This Document
Need a fresh take? Get an instant paraphrase of this document with our AI Paraphraser
1FINANCIAL MANAGEMENT
Table of Contents
Part A...............................................................................................................................................3
1. Summary of Recent Trend of Literature and Direction in Capital Budgeting........................3
1.1 Use of Net Present value and Internal Rate of Return.......................................................3
1.2 Discounted Cash Flow Techniques...................................................................................4
1.3 Dependence of Payback Method.......................................................................................4
2. Techniques of Capital Bu dgeting...........................................................................................5
2.1 Accounting Rate of Return (ARR) and Payback Period (PBP).........................................5
2.2 Internal Rate of Return (IRR) and Profitability Index (PI)................................................6
2.3 Net Present Value (NPV)...................................................................................................6
3. Usefulness of Capital Budgeting Techniques in Wealth Creation..........................................7
4. Conclusion...............................................................................................................................8
References..................................................................................................................................10
Part B.............................................................................................................................................12
1. Summary of Recent Trend of Literature and Direction in Capital Budgeting......................12
2. Is EMH Testable?..................................................................................................................13
3. Is it possible for an investor to make excess return consistently?.........................................14
4. Conclusion.............................................................................................................................15
References..................................................................................................................................17
2FINANCIAL MANAGEMENT
Part A
1. Summary of Recent Trend of Literature and Direction in Capital Budgeting
Capital Budgeting refers to the planning procedures used for the determination of the fact
that whether the long-term investments of the companies like buying of new machinery,
replacement of machinery or others are worth cash funding with the help of capitalization
structure. Capital Budgeting is an important aspect for the business organizations and thus, much
research has been conducted on this particular topic. Some of them have similar findings and
some of them have different.
1.1 Use of Net Present value and Internal Rate of Return
According to Bennouna, Meredith and Marchant (2010), most of the business organizations
prefer the use of Internal Rate of Return model as the most important as well as efficient model
for making investment decisions. According to him, majority portion of the companies consider
that the determination of the cash flow projections is the toughest stage in the process of capital
budgeting. As per Lundholm and O'keefe (2001), the model of internal rate of return is the most
preferred techniques for decision-making to the business organizations. He has stated that most
of the companies stay concerned for the selection of capital budgeting techniques for investment
decision-making process. Moreover, to the companies, the technique of present value is useful
for the evaluation of the new product lines. However, in the opinion of Froot and Stein (1998),
the model of discounted cash flow is the most popular technique of capital budgeting for the
firms around the globe. In this context, he mentioned about the internal rate of return model for
⊘ This is a preview!⊘
Do you want full access?
Subscribe today to unlock all pages.
Trusted by 1+ million students worldwide
3FINANCIAL MANAGEMENT
effective decision-making process. However, many firms are still using the model of payback
period as a secondary approach for investment decision making.
1.2 Discounted Cash Flow Techniques
According to the findings of Carr, Kolehmainen and Mitchell (2010), for the evaluation of
capital budgeting projects, most of the companies use either Net Present Value or Internal Rate
of Return model as their primary methods; and they also use payback period as secondary
approach. As opined by Denison (2009), most of the large business corporations put emphasis on
discounted cash flow models for their capital budgeting decision-making model and they heavily
depend on payback period techniques for taking decisions in the smaller projects. As per the
findings of Kester and Chang (1999), most of the large organizations in Hong Kong, Malaysia
and Singapore prefer to use the model of Payback Period for the evaluation and rank the capital
projects. He concluded that the discounted cash flow techniques are more popular among the
companies as a primary technique for the evaluation of projects.
1.3 Dependence of Payback Method
According to the findings of Okoruwa, Cox and Thompson, many small business organizations
struggle while measuring and evaluating the capital projects. For this reason, they largely rely on
the technique of payback method as a primary method to measure and evaluate their business
projects. As the small companies take the business risks very seriously, their required rate of
return for risky project tends to be very high. As opined by Drake (2006), more than 75%
companies in Canada employ discounted cash flow model for the assessment of their capital
investments. He also mentioned that the companies use internal rate of return techniques more
frequently than Net present value in the assessment of capital decisions. According to Adkins
and Paxson (2014), most of the hundred-fortune companies use discounted cash flow model and
Paraphrase This Document
Need a fresh take? Get an instant paraphrase of this document with our AI Paraphraser
4FINANCIAL MANAGEMENT
for this reason, they use internal rate of return techniques more than net present value for the
assessment of capital projects. As per Lilian Chan (2004), majority portion of the companies
prefer to use net present value method for capital budget decision-making model.
2. Techniques of Capital Budgeting
In the process of capital budgeting, many techniques assist the organizational managers
in the process of making decisions. The following discussion shows the description of some of
these capital budgeting processes.
2.1 Accounting Rate of Return (ARR) and Payback Period (PBP)
One of such technique is Accounting Rate of Return (ARR). ARR refers to the proportion of
annual net profit average to either the net investment or the average investment in the particular
project. ARR is expressed as Average Annual net profit / Initial investment or Average
Investment. In most of the cases, ARR is calculated based on average investment rather than
original investment. After the determination of ARR, it is compared with the desired rate of
return. According to the rules, the project will be acceptable in case the calculated ARR is bigger
than or equal to the desired rate of return. The next capital budgeting technique is called
Payback Period (PBP). It refers to the required number of years for the recovery of initial
investment by using net cash flow after tax. After the calculation of the PBP, a comparison is
done between the PBP and minimum acceptable payback period that is selected arbitrarily (Hall
2012). According to the decision rule, the particular project will be accepted in case the PBP
calculated is equal to or less than the selected desired period as it is better to recover the amount
of initial investment in shorter time. Payback Period is expressed as Cash Outlay (Investment) /
Annual Cash Inflow.
5FINANCIAL MANAGEMENT
2.2 Internal Rate of Return (IRR) and Profitability Index (PI)
The next important technique for capital budgeting is called Internal Rate of Return (IRR).
IRR can be expressed as the discount rate for equaling the present value of the expected net cash
inflows with an initial investment having net present value equal to zero. For selection, it is good
to have higher IRR as projects having higher IRR become more profitable (Bhuller, Mogstad and
Salvanes 2017). This method also considers as time value of money. It needs to be mentioned
that it is tedious task to calculate the value of IRR. The next capital budgeting technique is called
Profitability Index (PI) or Benefit-Cost Ratio. In the process of PI, the discounting method for
future cash flows is done; after that, the process of adding up the present value is done. Then, all
the present value sums are divided by the initial investment (Pasqual, Padilla and Jadotte 2013).
According to the decision rule, managers should accept the project having PI of one or greater
than one. PI is expressed as present value of cash inflows / initial cost outlay or net present value
(benefits) / net present value (costs).
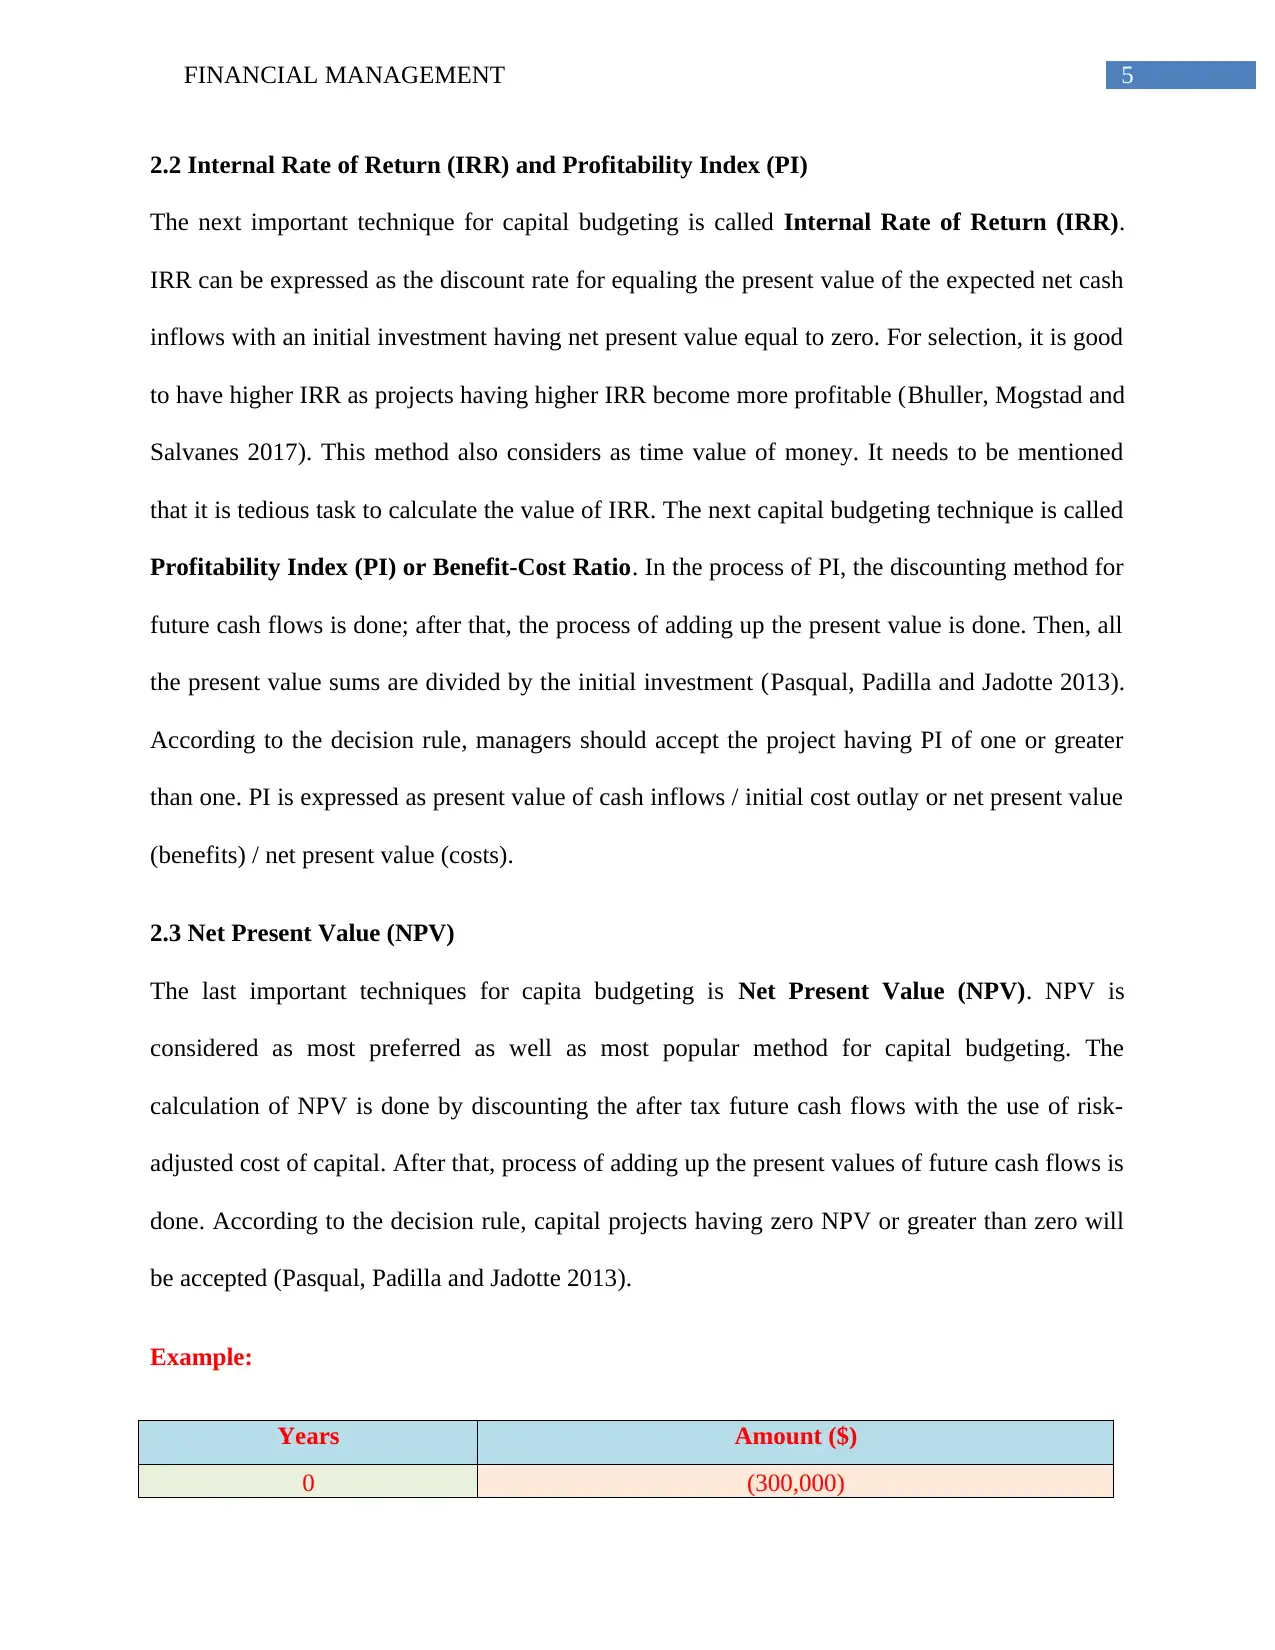
2.3 Net Present Value (NPV)
The last important techniques for capita budgeting is Net Present Value (NPV). NPV is
considered as most preferred as well as most popular method for capital budgeting. The
calculation of NPV is done by discounting the after tax future cash flows with the use of risk-
adjusted cost of capital. After that, process of adding up the present values of future cash flows is
done. According to the decision rule, capital projects having zero NPV or greater than zero will
be accepted (Pasqual, Padilla and Jadotte 2013).
Example:
Years Amount ($)
0 (300,000)
2.2 Internal Rate of Return (IRR) and Profitability Index (PI)
The next important technique for capital budgeting is called Internal Rate of Return (IRR).
IRR can be expressed as the discount rate for equaling the present value of the expected net cash
inflows with an initial investment having net present value equal to zero. For selection, it is good
to have higher IRR as projects having higher IRR become more profitable (Bhuller, Mogstad and
Salvanes 2017). This method also considers as time value of money. It needs to be mentioned
that it is tedious task to calculate the value of IRR. The next capital budgeting technique is called
Profitability Index (PI) or Benefit-Cost Ratio. In the process of PI, the discounting method for
future cash flows is done; after that, the process of adding up the present value is done. Then, all
the present value sums are divided by the initial investment (Pasqual, Padilla and Jadotte 2013).
According to the decision rule, managers should accept the project having PI of one or greater
than one. PI is expressed as present value of cash inflows / initial cost outlay or net present value
(benefits) / net present value (costs).
2.3 Net Present Value (NPV)
The last important techniques for capita budgeting is Net Present Value (NPV). NPV is
considered as most preferred as well as most popular method for capital budgeting. The
calculation of NPV is done by discounting the after tax future cash flows with the use of risk-
adjusted cost of capital. After that, process of adding up the present values of future cash flows is
done. According to the decision rule, capital projects having zero NPV or greater than zero will
be accepted (Pasqual, Padilla and Jadotte 2013).
Example:
Years Amount ($)
0 (300,000)
⊘ This is a preview!⊘
Do you want full access?
Subscribe today to unlock all pages.
Trusted by 1+ million students worldwide
6FINANCIAL MANAGEMENT
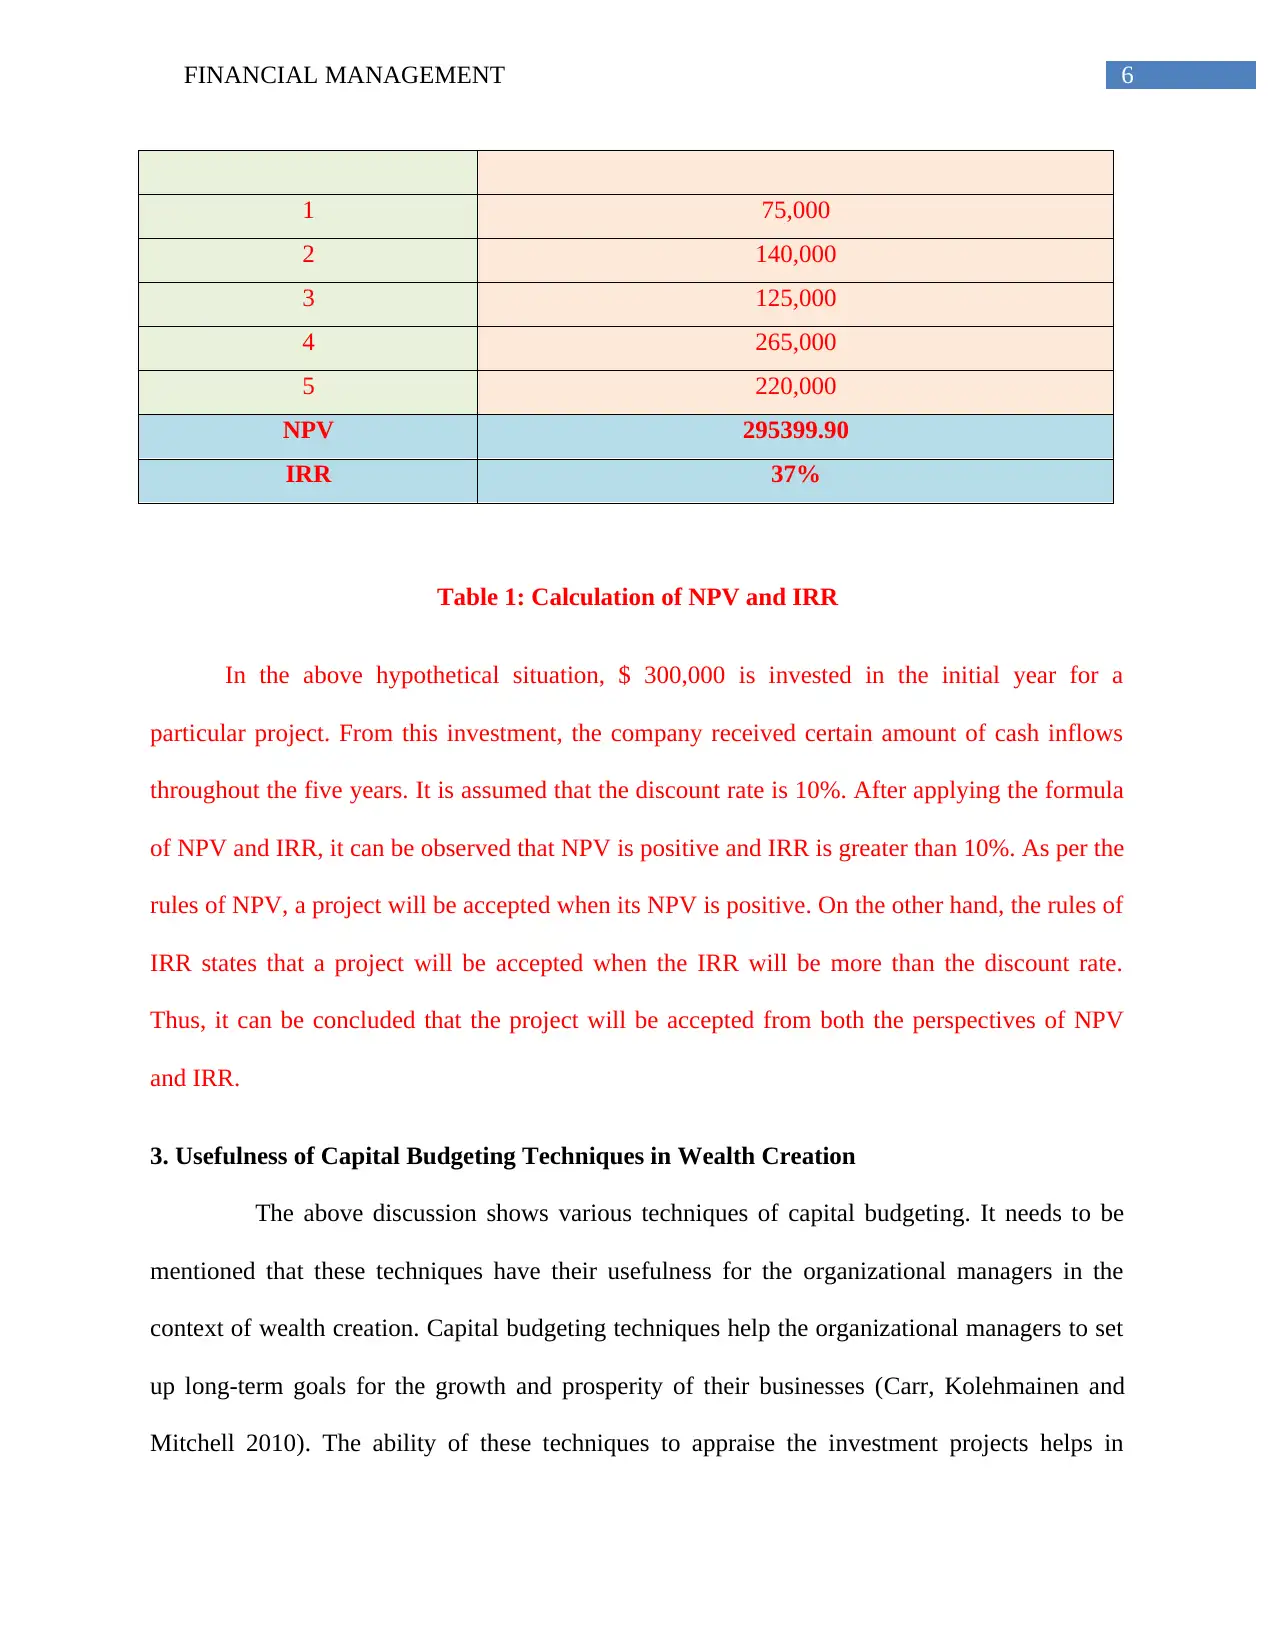
1 75,000
2 140,000
3 125,000
4 265,000
5 220,000
NPV 295399.90
IRR 37%
Table 1: Calculation of NPV and IRR
In the above hypothetical situation, $ 300,000 is invested in the initial year for a
particular project. From this investment, the company received certain amount of cash inflows
throughout the five years. It is assumed that the discount rate is 10%. After applying the formula
of NPV and IRR, it can be observed that NPV is positive and IRR is greater than 10%. As per the
rules of NPV, a project will be accepted when its NPV is positive. On the other hand, the rules of
IRR states that a project will be accepted when the IRR will be more than the discount rate.
Thus, it can be concluded that the project will be accepted from both the perspectives of NPV
and IRR.
3. Usefulness of Capital Budgeting Techniques in Wealth Creation
The above discussion shows various techniques of capital budgeting. It needs to be
mentioned that these techniques have their usefulness for the organizational managers in the
context of wealth creation. Capital budgeting techniques help the organizational managers to set
up long-term goals for the growth and prosperity of their businesses (Carr, Kolehmainen and
Mitchell 2010). The ability of these techniques to appraise the investment projects helps in
Paraphrase This Document
Need a fresh take? Get an instant paraphrase of this document with our AI Paraphraser
7FINANCIAL MANAGEMENT
creating framework for firms to plan their long-term directions. In addition, with the assistance
of the capital budgeting techniques, organizational manages can find new investment for their
business organizations that is very mush helpful in the wealth creation of the companies. Most
importantly, organizational managers can make the forecast and estimation of their future cash
flows with the assistance of different techniques of capital budgeting. These aspects help the
managers in taking decisions regarding the acceptance of certain capital projects (Adkins and
Paxson 2014). At the time of the selection of the capital projects, organizational managers are
required to take many decisions that require the timely flow of project information.
Organizational managers can get all the necessary information about different capital projects
from different capital budgeting techniques. One of the major aspects of wealth creation is to
monitor and control expenditures. Capital budgeting techniques help to define the necessary
expenditure for an investment project. Thus, the managers become able to identify the necessary
expenses so that they can control them (Brunzell, Liljeblom and Vaihekoski 2013). Most
importantly, the capital budgeting techniques assist the organizational managers in taking
valuable decisions for their companies. Thus, the above discussion shows that the capital
budgeting techniques have many important in the business organizations (Brief 2013). All these
aspects help managers identify the aspects that are helpful for the companies in wealth creation.
As a result of this, the managers are able to take decisions for wealth creation in the companies.
4. Conclusion
From the above discussion, it can be seen that there are many tetchiness for capital
budgeting in the companies; they are IRR, NPV, PBP, PI and ARR. However, according to the
trend of last ten years literature review on capital budgeting, it can be seen that most of the
companies all over the world prefer to use two techniques as their primary capital investment

8FINANCIAL MANAGEMENT
decision-making technique; they are IRR and NPV. However, companies prefer to use the
technique of PBP as their secondary techniques to appraise investment projects. Thus, it implies
that IRR, NPV and PBP are the most popular techniques of capital budgeting. The above
discussion also shows that these techniques of capital budgeting have major importance in
increasing wealth in the companies. The capital budgeting techniques help the organizational
managers in providing important information regarding various capital projects so that they can
be helpful in wealth creation. In addition, these techniques assist the managers in setting long-
term goals of their companies. Apart from this, the estimation and projection of future cash flows
are two of the major contributions of capital budgeting techniques that lead to wealth creation.
⊘ This is a preview!⊘
Do you want full access?
Subscribe today to unlock all pages.
Trusted by 1+ million students worldwide
9FINANCIAL MANAGEMENT
References
Adkins, R. and Paxson, D., 2014. Stochastic equipment capital budgeting with technological
progress. European Financial Management, 20(5), pp.1031-1049.
Bennouna, K., Meredith, G.G. and Marchant, T., 2010. Improved capital budgeting decision
making: evidence from Canada. Management decision, 48(2), pp.225-247.
Bhuller, M., Mogstad, M. and Salvanes, K.G., 2017. Life-cycle earnings, education premiums,
and internal rates of return. Journal of Labor Economics, 35(4), pp.993-1030.
Brunzell, T., Liljeblom, E. and Vaihekoski, M., 2013. Determinants of capital budgeting
methods and hurdle rates in Nordic firms. Accounting & Finance, 53(1), pp.85-110.
Carr, C., Kolehmainen, K. and Mitchell, F., 2010. Strategic investment decision making
practices: A contextual approach. Management Accounting Research, 21(3), pp.167-184.
Denison, C.A., 2009. Real options and escalation of commitment: A behavioral analysis of
capital investment decisions. The accounting review, 84(1), pp.133-155.
Drake, P.P., Capital budgeting techniques. Online (datum poslední revize: 29.6. 2006): www.
fau. edu/~ ppeter/fin3403/module6/capbudtech. pdf.
Froot, K.A. and Stein, J.C., 1998. Risk management, capital budgeting, and capital structure
policy for financial institutions: an integrated approach. Journal of financial economics, 47(1),
pp.55-82.
Hall, J.H., 2012. An analysis of capital budgeting methods, the cost of capital and decision-
makers in listed South African firms. Corporate Ownership & Control, 9(4), pp.381-390.
Paraphrase This Document
Need a fresh take? Get an instant paraphrase of this document with our AI Paraphraser
10FINANCIAL MANAGEMENT
Kester, G.W. and Chang, R.P., 1999. CAPITAL BUDGETING PRACTICES IN THE ASIA-
PACIFIC REGION: AUSTRALIA, HONG KONG, INDONESIA,... Financial Practice and
Education, 9(1), pp.25-33.
Lilian Chan, Y.C., 2004. Use of capital budgeting techniques and an analytic approach to capital
investment decisions in Canadian municipal governments. Public Budgeting & Finance, 24(2),
pp.40-58.
Lundholm, R. and O'keefe, T., 2001. Reconciling value estimates from the discounted cash flow
model and the residual income model. Contemporary Accounting Research, 18(2), pp.311-335.
Okoruwa, A., Cox, A.T. and Thompson, A.F., Three Treatments of Debt Financing for Capital
Budgeting Decisions. Appraisal J, 62, pp.189-96.
Pasqual, J., Padilla, E. and Jadotte, E., 2013. Equivalence of different profitability criteria with
the net present value. International Journal of Production Economics, 142(1), pp.205-210.
Pasqual, J., Padilla, E. and Jadotte, E., 2013. Equivalence of different profitability criteria with
the net present value. International Journal of Production Economics, 142(1), pp.205-210.
11FINANCIAL MANAGEMENT
Part B
1. Summary of Recent Trend of Literature and Direction in Capital Budgeting
Efficient Market Hypothesis (EMH) is a financial market theory developed in the year of
1960. According to the theory of EMH, in the liquid market at any point of time, the prices of
securities fully reflect all available information about them. Considering the importance of the
theory of EMH, many researchers have been done on them. Some of them have different
findings and some of them have similar findings. According to Jordan (1983), based on the thesis
paper he concluded that the prices of stock is highly unpredictable and they followed a random
walk. This is considered as one of the major findings in EMH. The same writer also states that
the financial market is called efficient when the prices of the shares and securities fully reflect
the available information. The findings of Fama and French (1997) support the above findings.
According to this finding, a large number of shares have random walk and they do not show any
sign of predictability. In this context, it needs to be mentioned that the results of many early
researches on the subject of EMH shows the signs of weak predictability. Thus, it can be seen
that it is highly impossible to predict the prices of shares in the market. As opined by Fama
(1991), the prices of shares in the share market fluctuate on a highly random basis. This
particular aspect indicates a random walk in the share prices in the share market and they are
inconsistent in the rational market. According to the findings of Rao (2017), this un-predictive
nature of the share prices lead to weak form of market efficiency. According to this finding, to
some extent, one can predict the share prices of next period from the share prices of current
period. For this reason, in case a market was efficient in the past period, it will not able to
provide any help to predict the share prices of the future period. According to the findings of Lo
⊘ This is a preview!⊘
Do you want full access?
Subscribe today to unlock all pages.
Trusted by 1+ million students worldwide
1 out of 19
Related Documents


Your All-in-One AI-Powered Toolkit for Academic Success.
+13062052269
info@desklib.com
Available 24*7 on WhatsApp / Email
![[object Object]](/_next/static/media/star-bottom.7253800d.svg)
Unlock your academic potential
Copyright © 2020–2026 A2Z Services. All Rights Reserved. Developed and managed by ZUCOL.