Financial Performance Analysis: Brentwood Plc and Griffin Plc Report
VerifiedAdded on 2019/12/03
|17
|4557
|176
Report
AI Summary
This report provides a comprehensive financial analysis of Brentwood Plc and Griffin Plc. Part A focuses on Brentwood Plc, evaluating its financial performance through profitability, liquidity, gearing, asset utilization, and investment ratios for 2013 and 2014, including a detailed analysis of its working capital cycle. Part B shifts to Griffin Plc, analyzing the optimal production quantities given scarce resources and considering the relevance of committed fixed costs. Part C critically evaluates investment appraisal techniques and examines the assumptions underlying the break-even model. The report utilizes financial ratios, calculations, and comparisons to assess the companies' financial positions and offers insights into their financial management practices, making it a valuable resource for understanding financial analysis and control.

Financial
management and
control
1
management and
control
1
Paraphrase This Document
Need a fresh take? Get an instant paraphrase of this document with our AI Paraphraser
TABLE OF CONTENTS
Introduction......................................................................................................................................3
Part a – Brentwood Plc....................................................................................................................3
Report on financial performance for the Board of Brentwood Plc..............................................3
Computation of working capital cycle.........................................................................................7
Part b – Griffin Plc...........................................................................................................................9
Computation of optimum quantities of products by making utilization of scarce resources.......9
Relevance to the committed fixed costs in determination of optimum mix for production......10
Part c..............................................................................................................................................11
Critical evaluation of investment appraisal techniques.............................................................11
Analysis of assumptions linked to the model of break even......................................................13
Conclusion.....................................................................................................................................14
References......................................................................................................................................15
2
INDEX OF TABLES
Table 1: Statement showing profitability ratios...............................................................................4
Table 2: Statement showing liquidity ratios....................................................................................5
Table 3: Statement showing gearing ratios......................................................................................6
Table 4: Statement showing asset utilization ratios.........................................................................7
Table 5: Statement showing investment ratios................................................................................7
Table 6: Working capital cycle of Brentwood Plc of 2014.............................................................8
Table 7: Working capital cycle of Brentwood Plc of 2013.............................................................9
Table 8: Profitability statement of product A, B and C.................................................................10
Table 9: Statement showing unit demanded in the market............................................................10
Table 10: Statement showing ranking of production as profit in accordance with consumption of
quantity of raw material ................................................................................................................10
Table 11: Statement showing unit to be produced.........................................................................10
3
⊘ This is a preview!⊘
Do you want full access?
Subscribe today to unlock all pages.
Trusted by 1+ million students worldwide
INTRODUCTION
Finance is a crucial resource of business thus; management of organization is required to
make appropriate utilization of available resources in order to enhance their profitability. In order
to strengthen the financial position, companies are required to make financial analysis by using
suitable tools (Ahrendsen and Katchova, 2012). Present project report is focused on the
evaluation of various financial tools in order to develop an effective control on business. These
techniques will be applied to given case scenario of Brentwood Plc and Griffin Plc. Further,
description will be provided regarding the use of investment appraisal techniques and key
assumptions that are linked to the model of break-even point.
PART A – BRENTWOOD PLC
Report on financial performance for the Board of Brentwood Plc
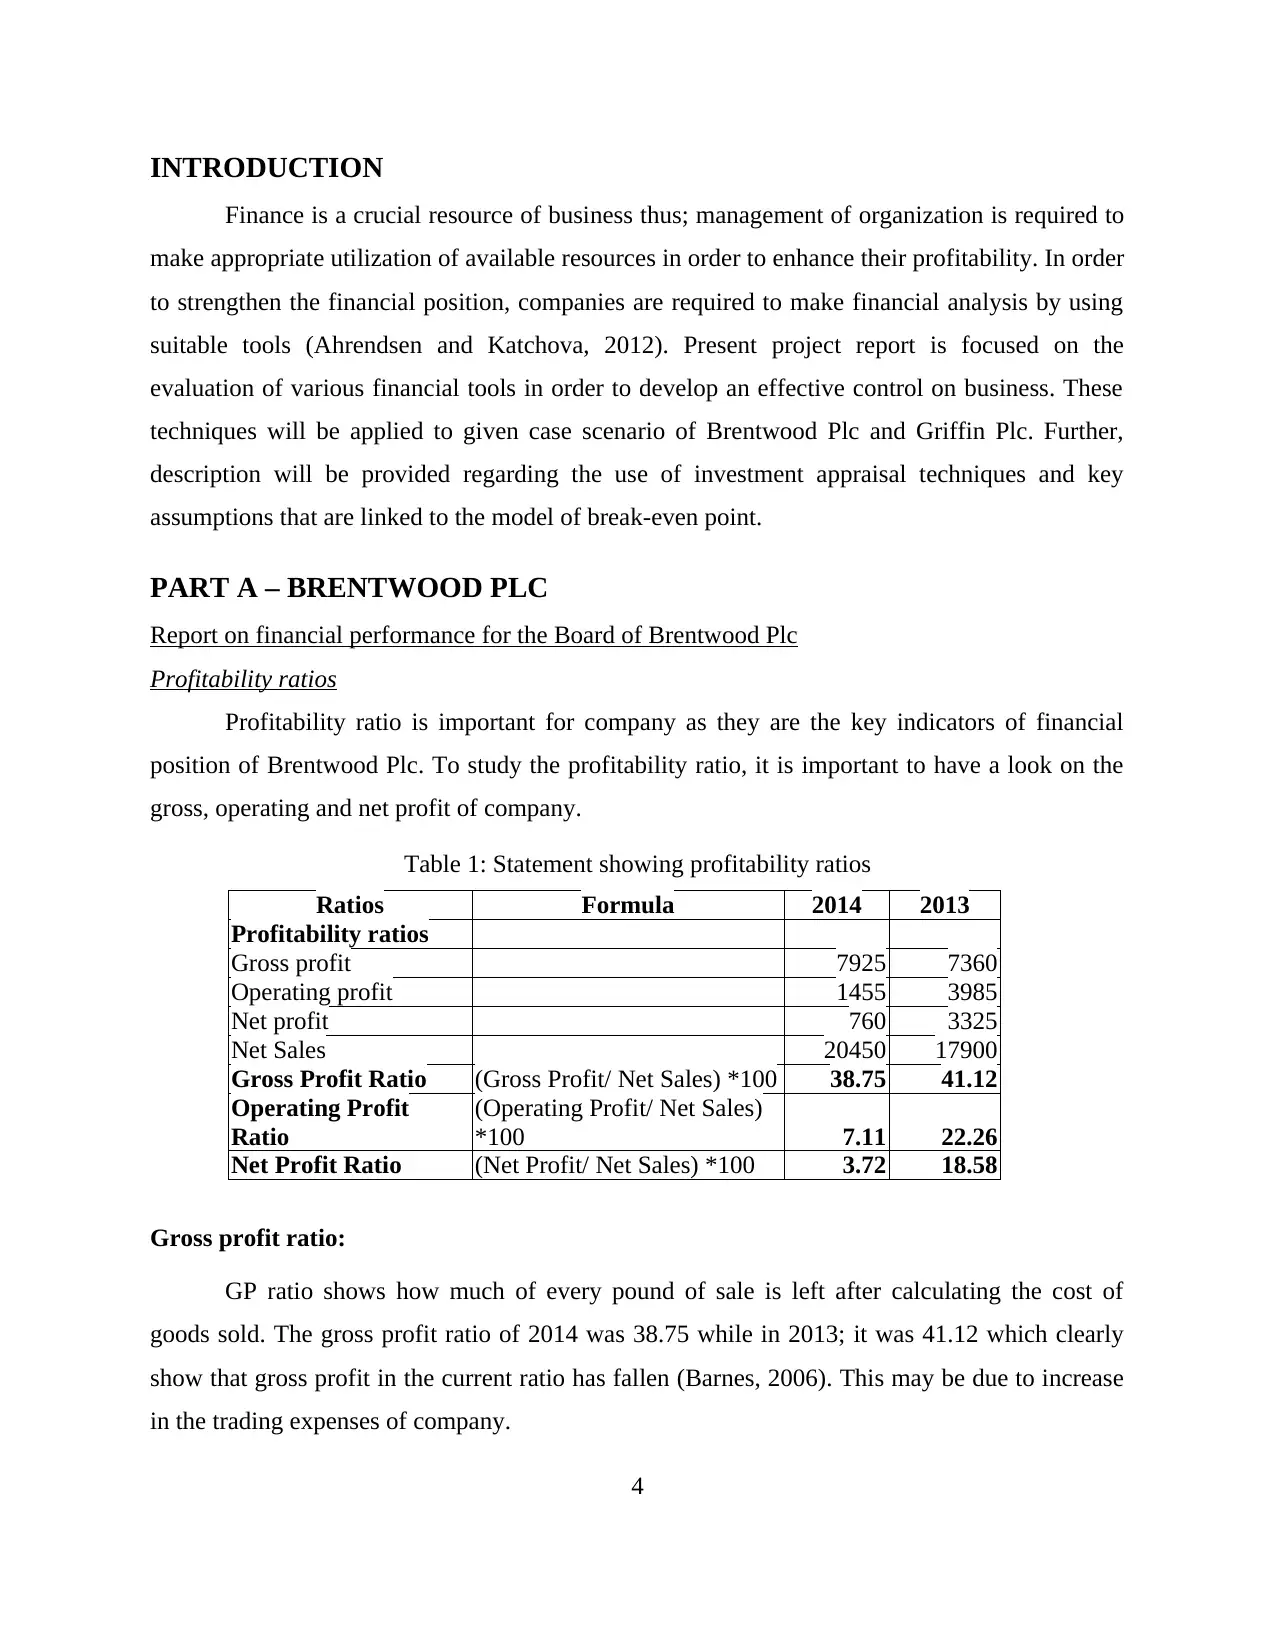
Profitability ratios
Profitability ratio is important for company as they are the key indicators of financial
position of Brentwood Plc. To study the profitability ratio, it is important to have a look on the
gross, operating and net profit of company.
Table 1: Statement showing profitability ratios
Ratios Formula 2014 2013
Profitability ratios
Gross profit 7925 7360
Operating profit 1455 3985
Net profit 760 3325
Net Sales 20450 17900
Gross Profit Ratio (Gross Profit/ Net Sales) *100 38.75 41.12
Operating Profit
Ratio
(Operating Profit/ Net Sales)
*100 7.11 22.26
Net Profit Ratio (Net Profit/ Net Sales) *100 3.72 18.58
Gross profit ratio:
GP ratio shows how much of every pound of sale is left after calculating the cost of
goods sold. The gross profit ratio of 2014 was 38.75 while in 2013; it was 41.12 which clearly
show that gross profit in the current ratio has fallen (Barnes, 2006). This may be due to increase
in the trading expenses of company.
4
Finance is a crucial resource of business thus; management of organization is required to
make appropriate utilization of available resources in order to enhance their profitability. In order
to strengthen the financial position, companies are required to make financial analysis by using
suitable tools (Ahrendsen and Katchova, 2012). Present project report is focused on the
evaluation of various financial tools in order to develop an effective control on business. These
techniques will be applied to given case scenario of Brentwood Plc and Griffin Plc. Further,
description will be provided regarding the use of investment appraisal techniques and key
assumptions that are linked to the model of break-even point.
PART A – BRENTWOOD PLC
Report on financial performance for the Board of Brentwood Plc
Profitability ratios
Profitability ratio is important for company as they are the key indicators of financial
position of Brentwood Plc. To study the profitability ratio, it is important to have a look on the
gross, operating and net profit of company.
Table 1: Statement showing profitability ratios
Ratios Formula 2014 2013
Profitability ratios
Gross profit 7925 7360
Operating profit 1455 3985
Net profit 760 3325
Net Sales 20450 17900
Gross Profit Ratio (Gross Profit/ Net Sales) *100 38.75 41.12
Operating Profit
Ratio
(Operating Profit/ Net Sales)
*100 7.11 22.26
Net Profit Ratio (Net Profit/ Net Sales) *100 3.72 18.58
Gross profit ratio:
GP ratio shows how much of every pound of sale is left after calculating the cost of
goods sold. The gross profit ratio of 2014 was 38.75 while in 2013; it was 41.12 which clearly
show that gross profit in the current ratio has fallen (Barnes, 2006). This may be due to increase
in the trading expenses of company.
4
Paraphrase This Document
Need a fresh take? Get an instant paraphrase of this document with our AI Paraphraser
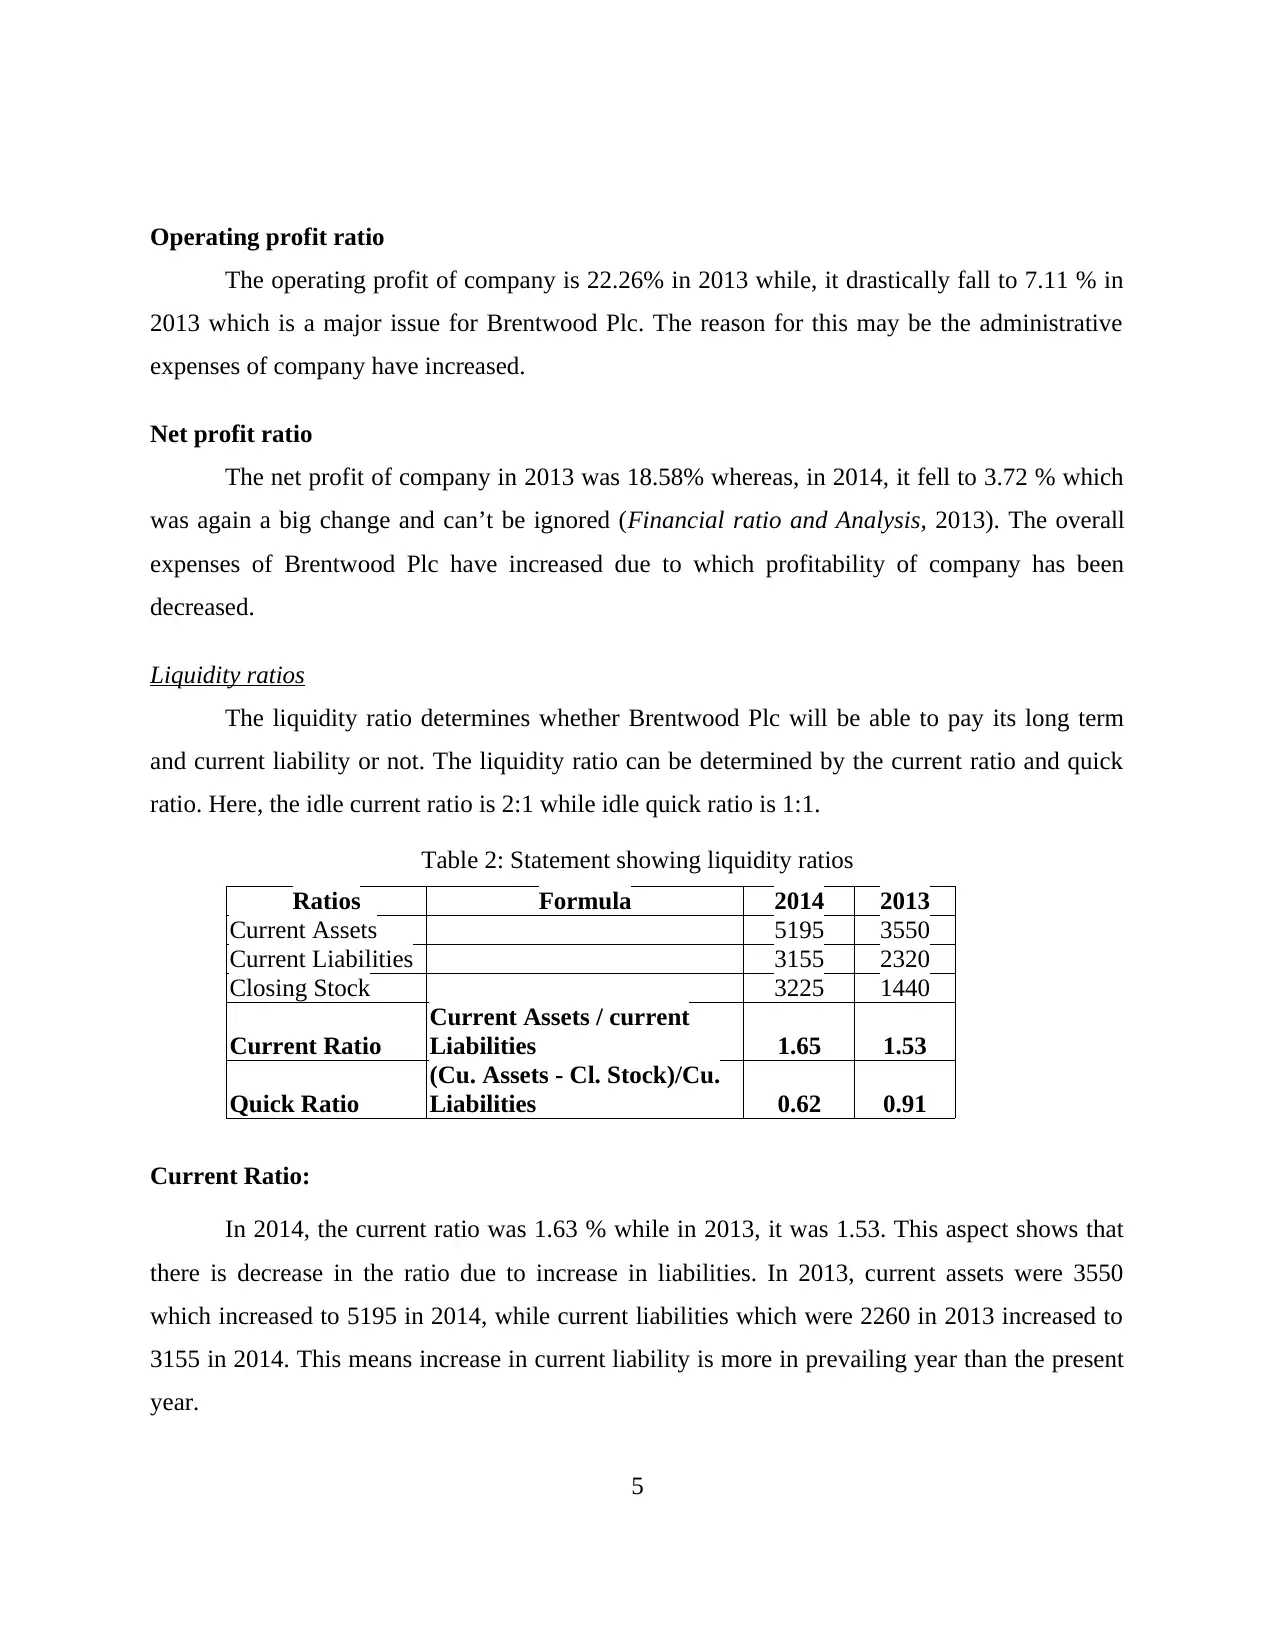
Operating profit ratio
The operating profit of company is 22.26% in 2013 while, it drastically fall to 7.11 % in
2013 which is a major issue for Brentwood Plc. The reason for this may be the administrative
expenses of company have increased.
Net profit ratio
The net profit of company in 2013 was 18.58% whereas, in 2014, it fell to 3.72 % which
was again a big change and can’t be ignored (Financial ratio and Analysis, 2013). The overall
expenses of Brentwood Plc have increased due to which profitability of company has been
decreased.
Liquidity ratios
The liquidity ratio determines whether Brentwood Plc will be able to pay its long term
and current liability or not. The liquidity ratio can be determined by the current ratio and quick
ratio. Here, the idle current ratio is 2:1 while idle quick ratio is 1:1.
Table 2: Statement showing liquidity ratios
Ratios Formula 2014 2013
Current Assets 5195 3550
Current Liabilities 3155 2320
Closing Stock 3225 1440
Current Ratio
Current Assets / current
Liabilities 1.65 1.53
Quick Ratio
(Cu. Assets - Cl. Stock)/Cu.
Liabilities 0.62 0.91
Current Ratio:
In 2014, the current ratio was 1.63 % while in 2013, it was 1.53. This aspect shows that
there is decrease in the ratio due to increase in liabilities. In 2013, current assets were 3550
which increased to 5195 in 2014, while current liabilities which were 2260 in 2013 increased to
3155 in 2014. This means increase in current liability is more in prevailing year than the present
year.
5
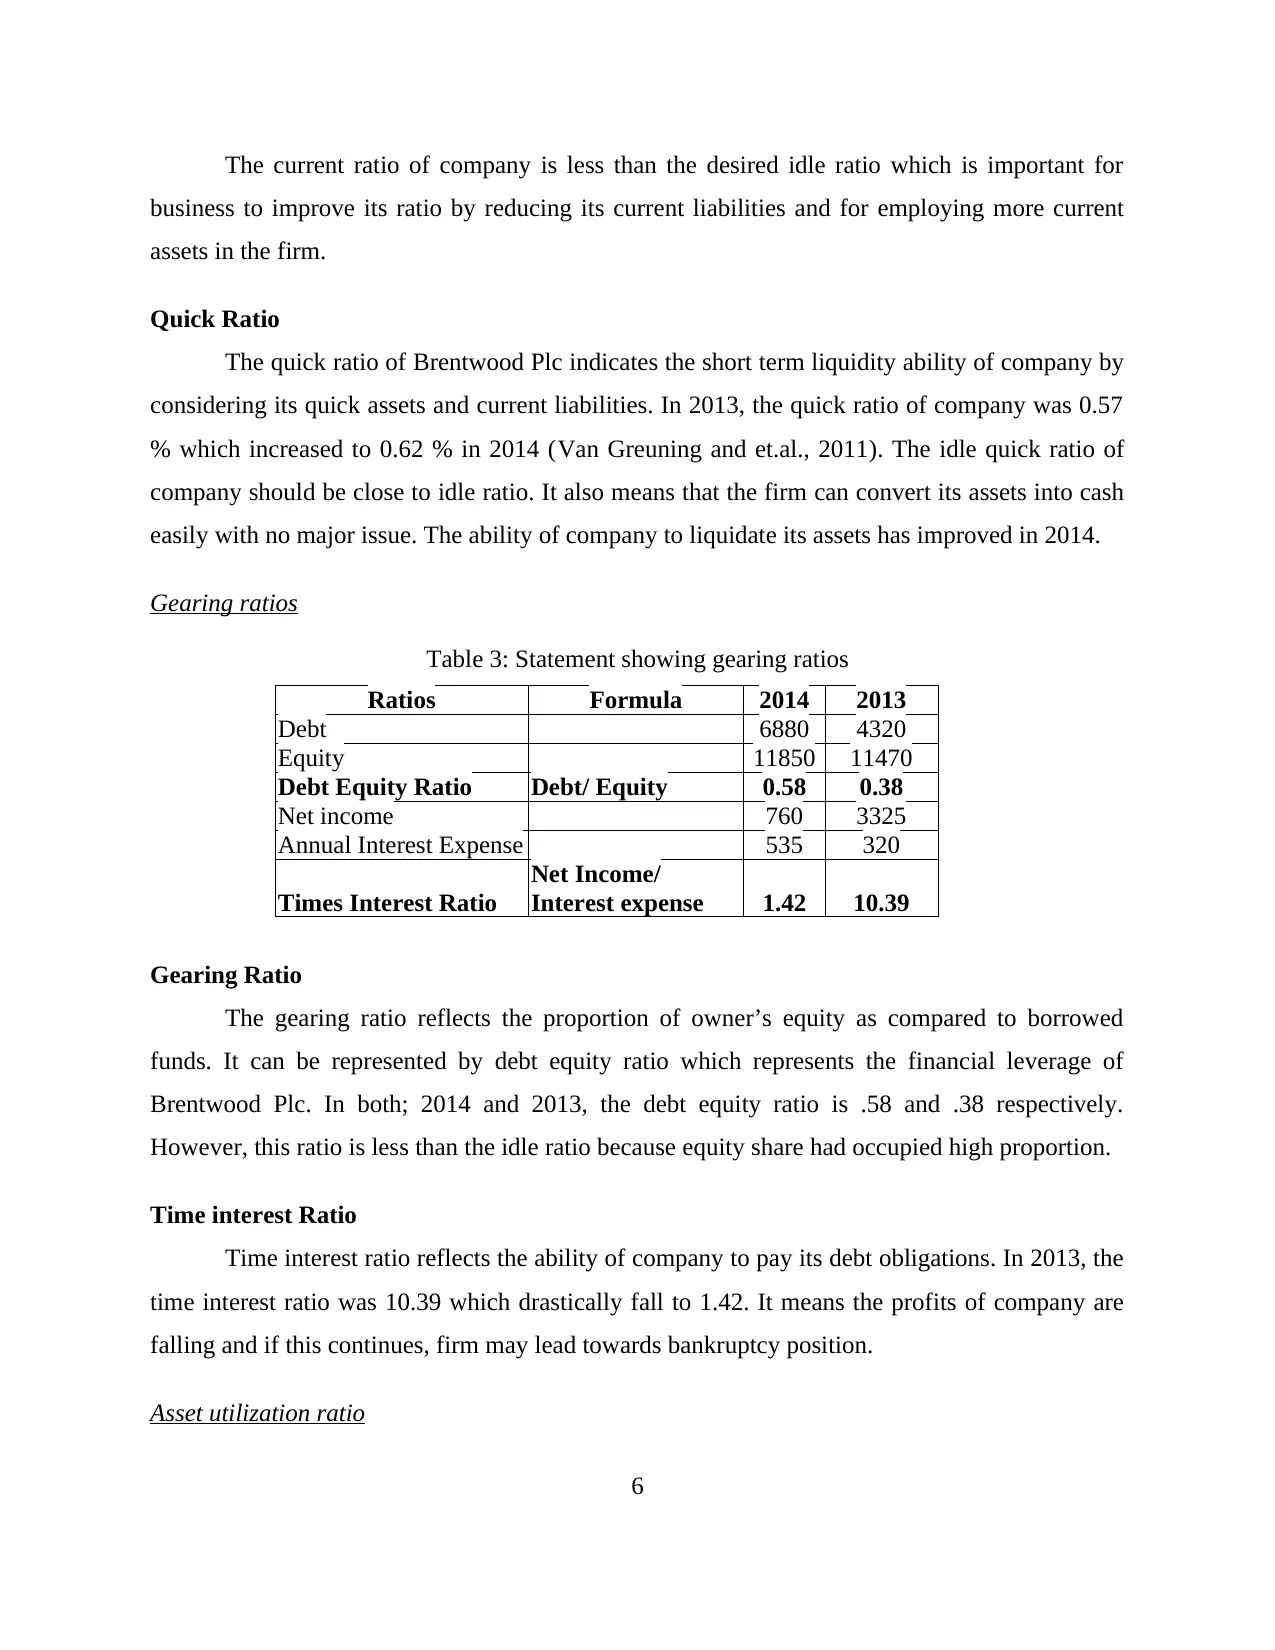
The current ratio of company is less than the desired idle ratio which is important for
business to improve its ratio by reducing its current liabilities and for employing more current
assets in the firm.
Quick Ratio
The quick ratio of Brentwood Plc indicates the short term liquidity ability of company by
considering its quick assets and current liabilities. In 2013, the quick ratio of company was 0.57
% which increased to 0.62 % in 2014 (Van Greuning and et.al., 2011). The idle quick ratio of
company should be close to idle ratio. It also means that the firm can convert its assets into cash
easily with no major issue. The ability of company to liquidate its assets has improved in 2014.
Gearing ratios
Table 3: Statement showing gearing ratios
Ratios Formula 2014 2013
Debt 6880 4320
Equity 11850 11470
Debt Equity Ratio Debt/ Equity 0.58 0.38
Net income 760 3325
Annual Interest Expense 535 320
Times Interest Ratio
Net Income/
Interest expense 1.42 10.39
Gearing Ratio
The gearing ratio reflects the proportion of owner’s equity as compared to borrowed
funds. It can be represented by debt equity ratio which represents the financial leverage of
Brentwood Plc. In both; 2014 and 2013, the debt equity ratio is .58 and .38 respectively.
However, this ratio is less than the idle ratio because equity share had occupied high proportion.
Time interest Ratio
Time interest ratio reflects the ability of company to pay its debt obligations. In 2013, the
time interest ratio was 10.39 which drastically fall to 1.42. It means the profits of company are
falling and if this continues, firm may lead towards bankruptcy position.
Asset utilization ratio
6
⊘ This is a preview!⊘
Do you want full access?
Subscribe today to unlock all pages.
Trusted by 1+ million students worldwide
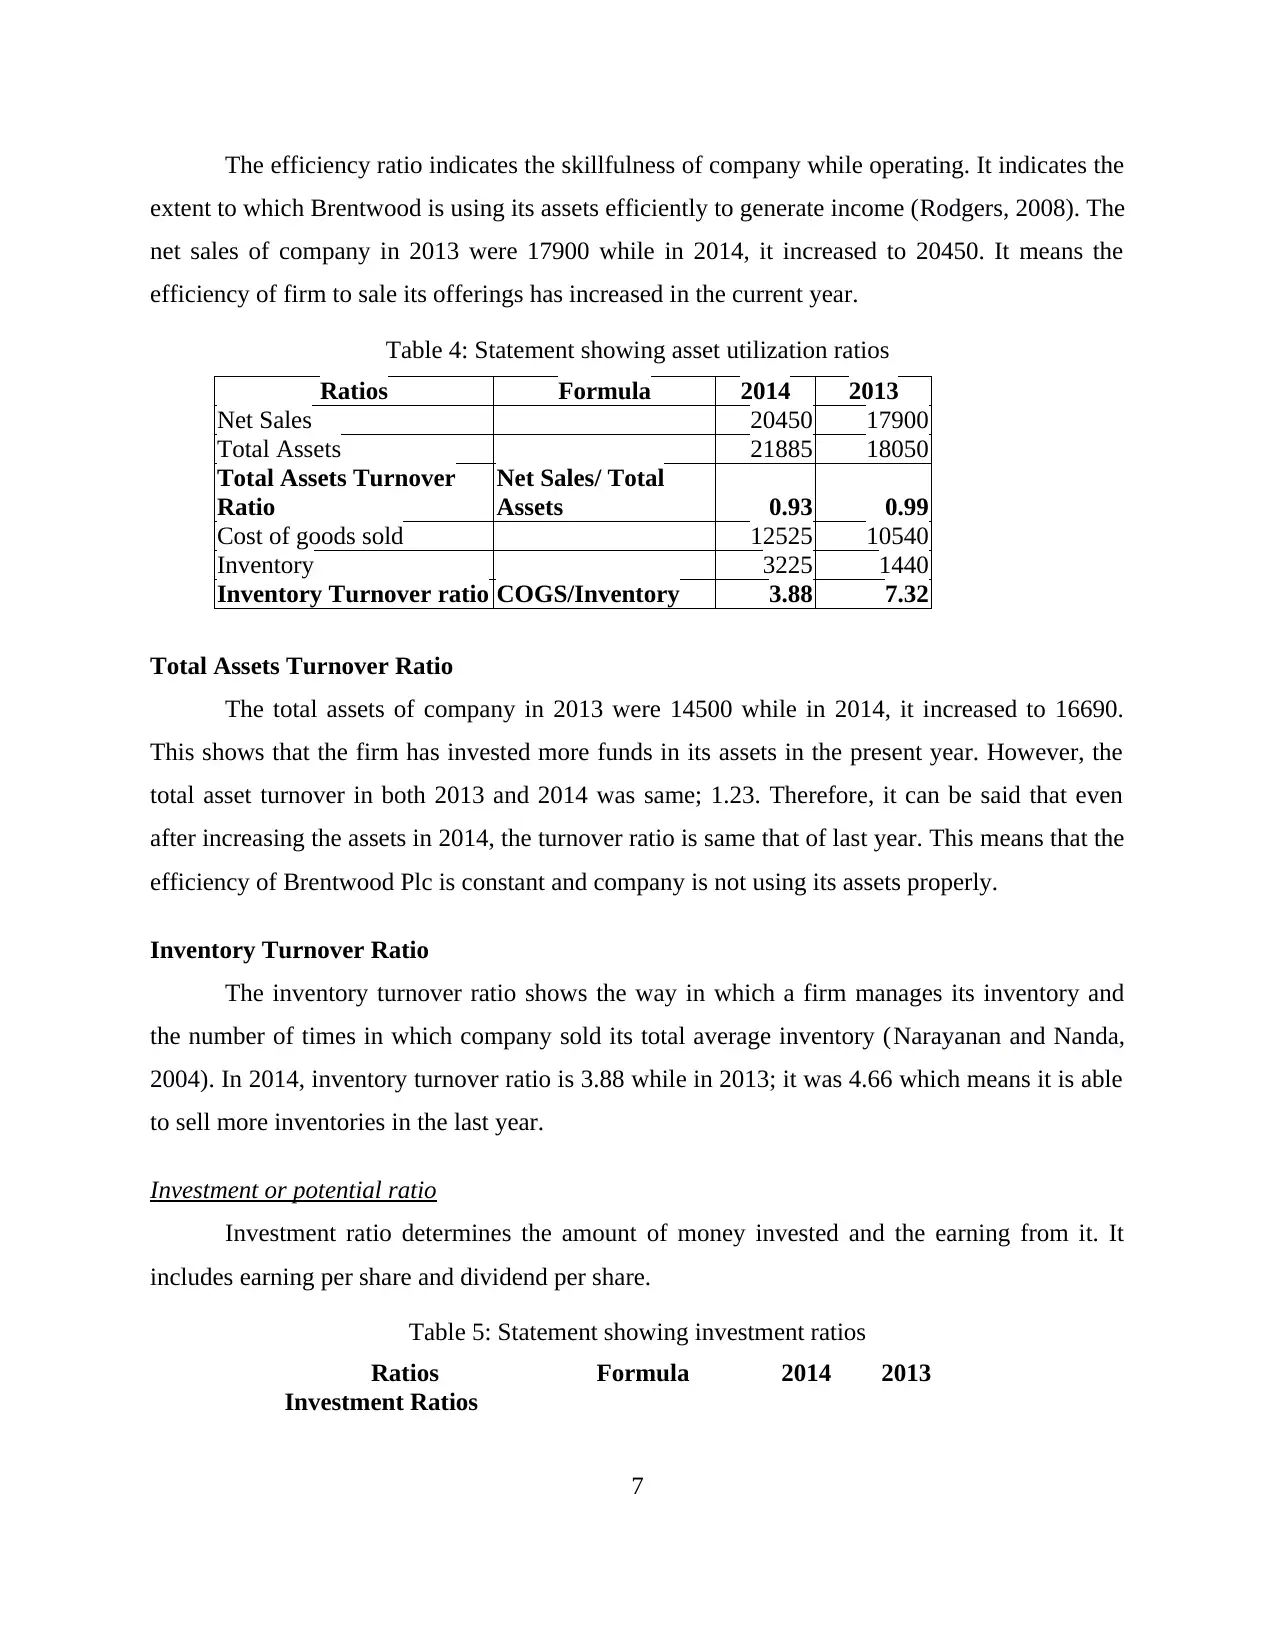
The efficiency ratio indicates the skillfulness of company while operating. It indicates the
extent to which Brentwood is using its assets efficiently to generate income (Rodgers, 2008). The
net sales of company in 2013 were 17900 while in 2014, it increased to 20450. It means the
efficiency of firm to sale its offerings has increased in the current year.
Table 4: Statement showing asset utilization ratios
Ratios Formula 2014 2013
Net Sales 20450 17900
Total Assets 21885 18050
Total Assets Turnover
Ratio
Net Sales/ Total
Assets 0.93 0.99
Cost of goods sold 12525 10540
Inventory 3225 1440
Inventory Turnover ratio COGS/Inventory 3.88 7.32
Total Assets Turnover Ratio
The total assets of company in 2013 were 14500 while in 2014, it increased to 16690.
This shows that the firm has invested more funds in its assets in the present year. However, the
total asset turnover in both 2013 and 2014 was same; 1.23. Therefore, it can be said that even
after increasing the assets in 2014, the turnover ratio is same that of last year. This means that the
efficiency of Brentwood Plc is constant and company is not using its assets properly.
Inventory Turnover Ratio
The inventory turnover ratio shows the way in which a firm manages its inventory and
the number of times in which company sold its total average inventory (Narayanan and Nanda,
2004). In 2014, inventory turnover ratio is 3.88 while in 2013; it was 4.66 which means it is able
to sell more inventories in the last year.
Investment or potential ratio
Investment ratio determines the amount of money invested and the earning from it. It
includes earning per share and dividend per share.
Table 5: Statement showing investment ratios
Ratios Formula 2014 2013
Investment Ratios
7
Paraphrase This Document
Need a fresh take? Get an instant paraphrase of this document with our AI Paraphraser
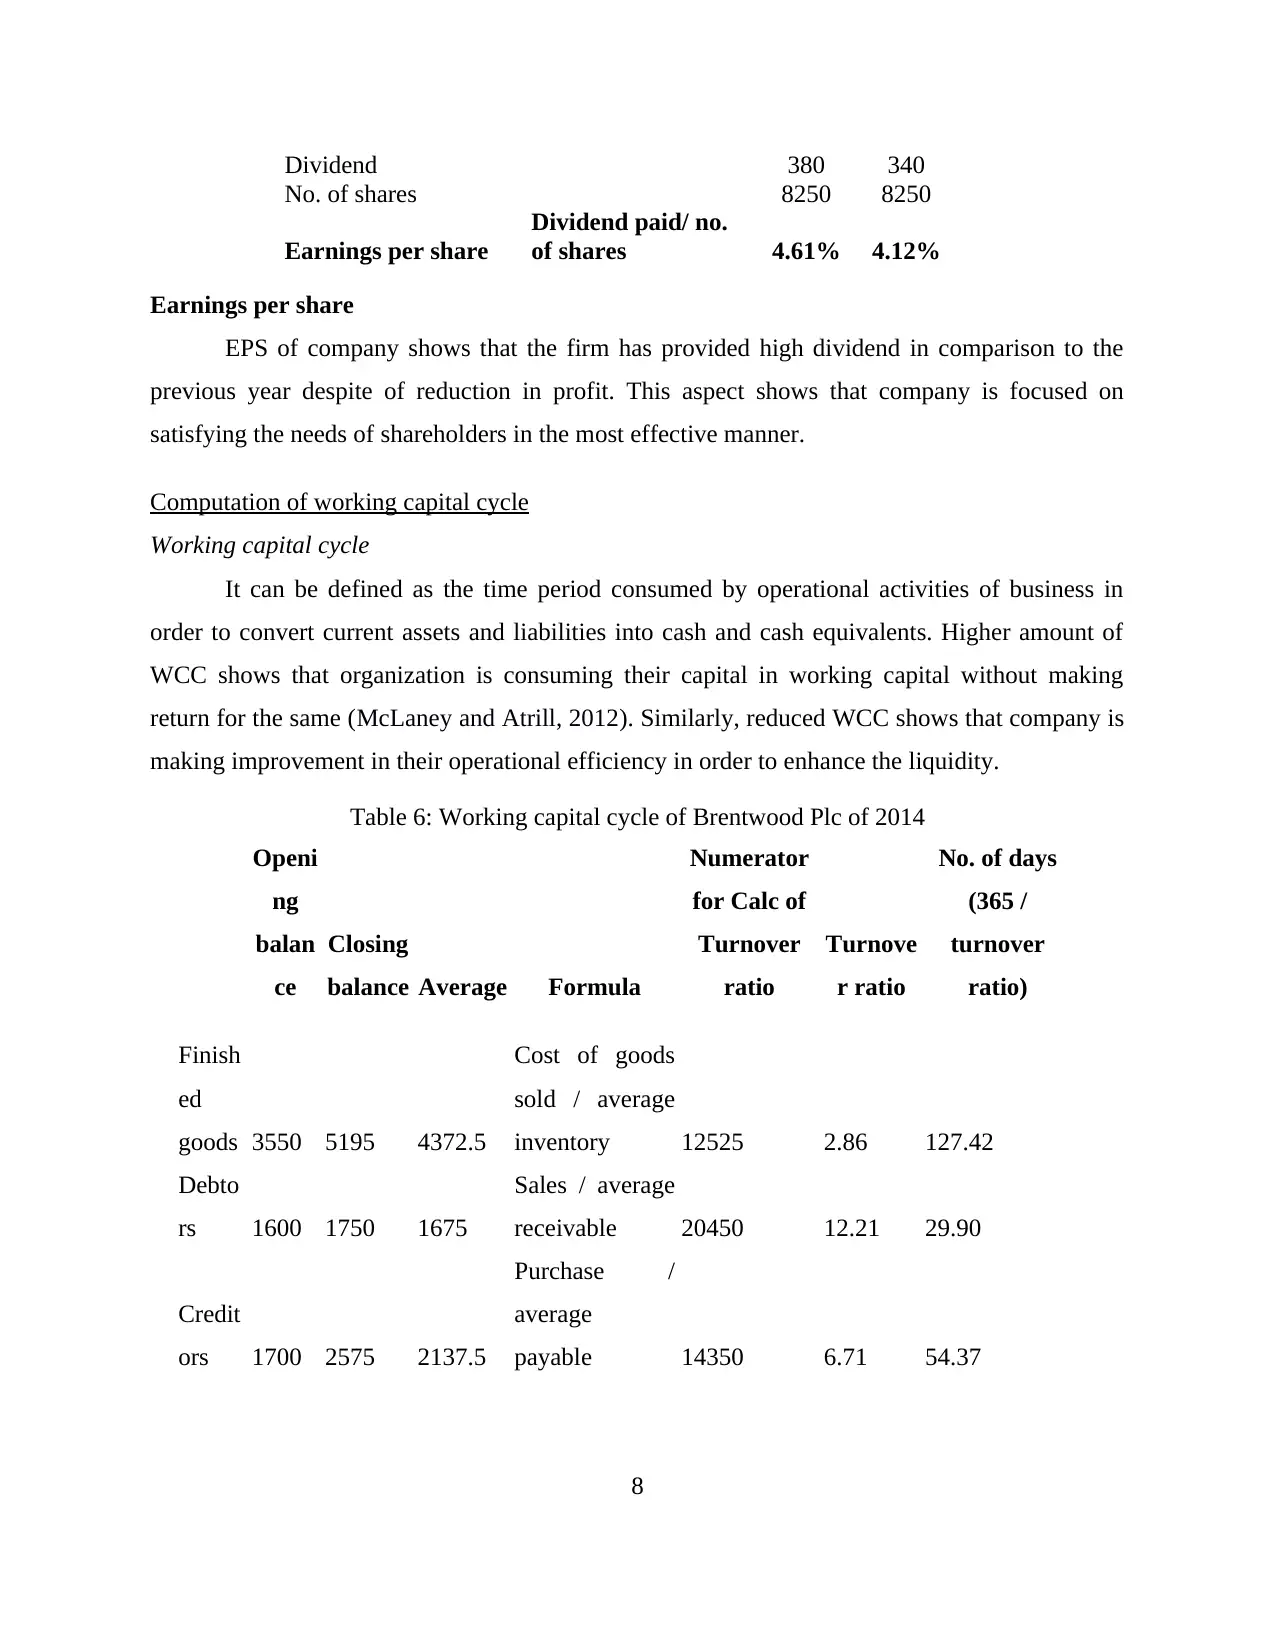
Dividend 380 340
No. of shares 8250 8250
Earnings per share
Dividend paid/ no.
of shares 4.61% 4.12%
Earnings per share
EPS of company shows that the firm has provided high dividend in comparison to the
previous year despite of reduction in profit. This aspect shows that company is focused on
satisfying the needs of shareholders in the most effective manner.
Computation of working capital cycle
Working capital cycle
It can be defined as the time period consumed by operational activities of business in
order to convert current assets and liabilities into cash and cash equivalents. Higher amount of
WCC shows that organization is consuming their capital in working capital without making
return for the same (McLaney and Atrill, 2012). Similarly, reduced WCC shows that company is
making improvement in their operational efficiency in order to enhance the liquidity.
Table 6: Working capital cycle of Brentwood Plc of 2014
Openi
ng
balan
ce
Closing
balance Average Formula
Numerator
for Calc of
Turnover
ratio
Turnove
r ratio
No. of days
(365 /
turnover
ratio)
Finish
ed
goods 3550 5195 4372.5
Cost of goods
sold / average
inventory 12525 2.86 127.42
Debto
rs 1600 1750 1675
Sales / average
receivable 20450 12.21 29.90
Credit
ors 1700 2575 2137.5
Purchase /
average
payable 14350 6.71 54.37
8
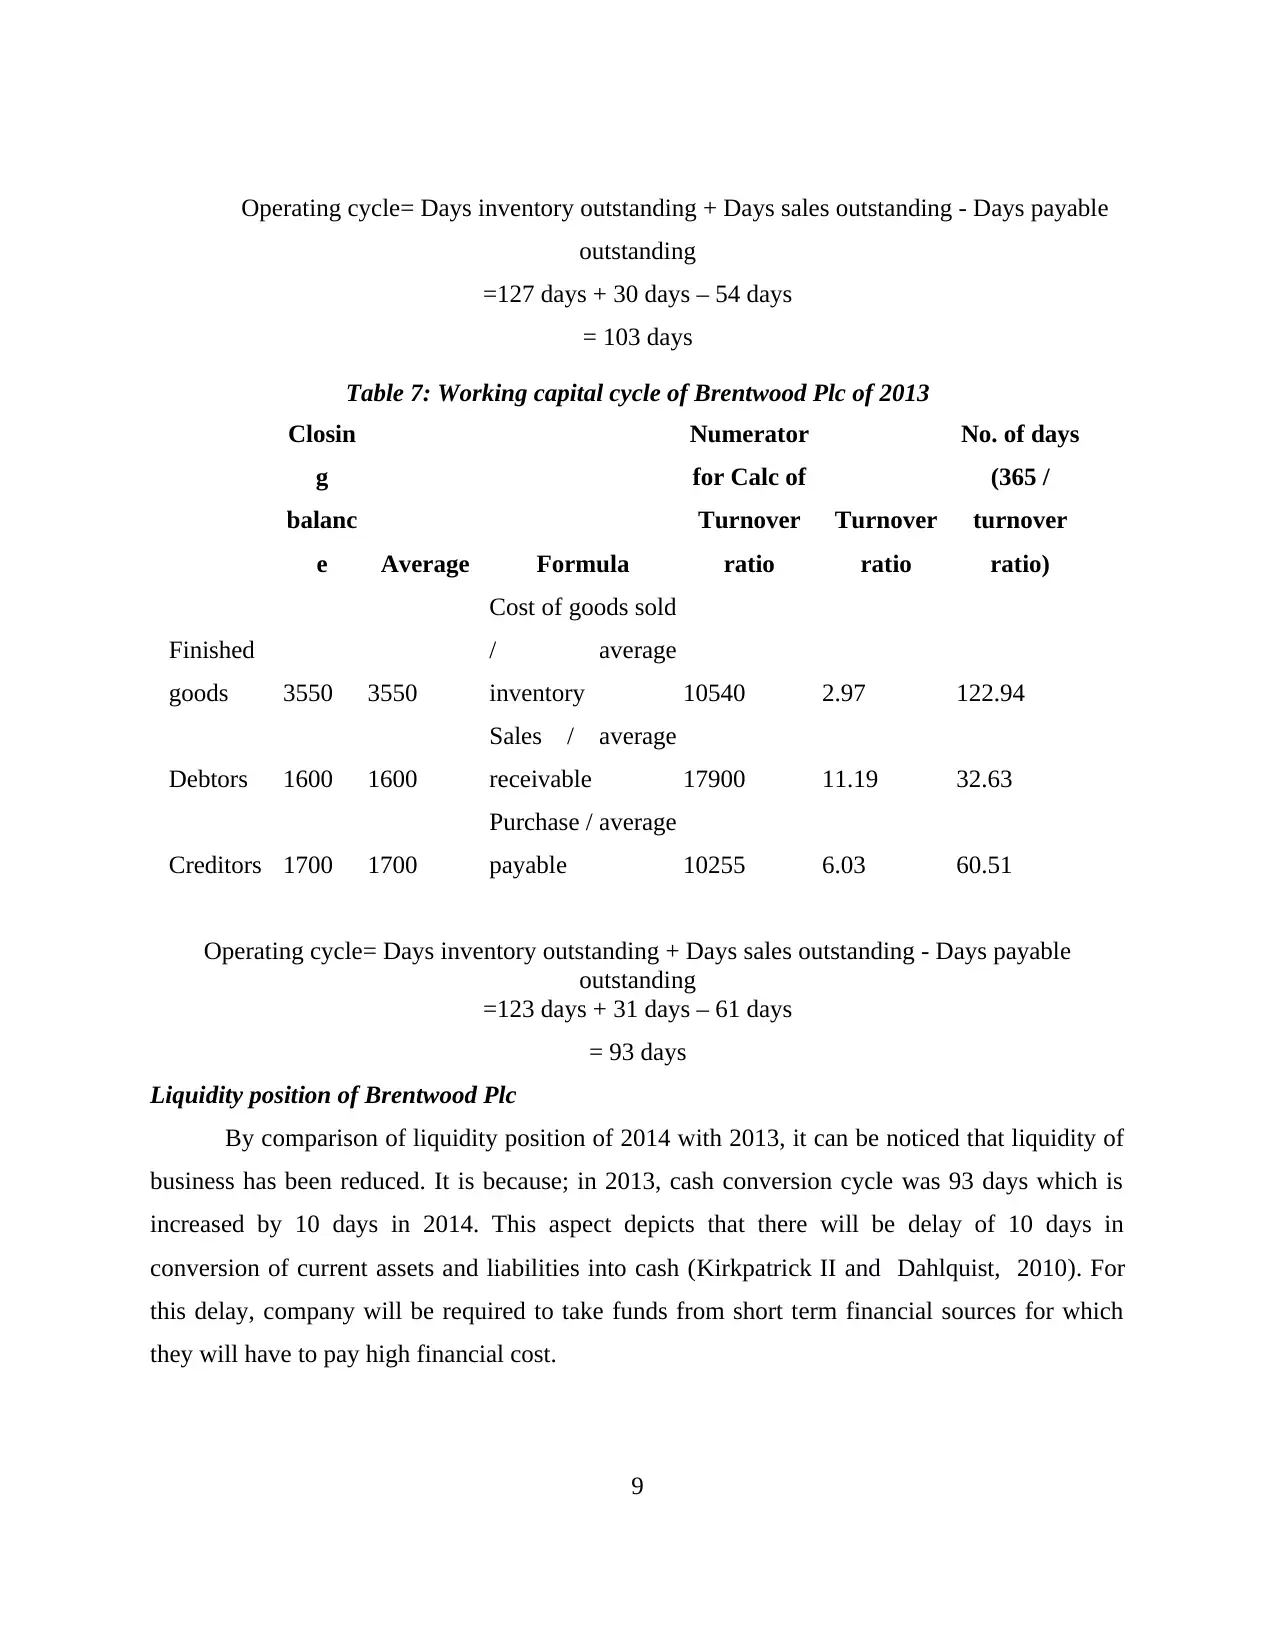
Operating cycle= Days inventory outstanding + Days sales outstanding - Days payable
outstanding
=127 days + 30 days – 54 days
= 103 days
Table 7: Working capital cycle of Brentwood Plc of 2013
Closin
g
balanc
e Average Formula
Numerator
for Calc of
Turnover
ratio
Turnover
ratio
No. of days
(365 /
turnover
ratio)
Finished
goods 3550 3550
Cost of goods sold
/ average
inventory 10540 2.97 122.94
Debtors 1600 1600
Sales / average
receivable 17900 11.19 32.63
Creditors 1700 1700
Purchase / average
payable 10255 6.03 60.51
Operating cycle= Days inventory outstanding + Days sales outstanding - Days payable
outstanding
=123 days + 31 days – 61 days
= 93 days
Liquidity position of Brentwood Plc
By comparison of liquidity position of 2014 with 2013, it can be noticed that liquidity of
business has been reduced. It is because; in 2013, cash conversion cycle was 93 days which is
increased by 10 days in 2014. This aspect depicts that there will be delay of 10 days in
conversion of current assets and liabilities into cash (Kirkpatrick II and Dahlquist, 2010). For
this delay, company will be required to take funds from short term financial sources for which
they will have to pay high financial cost.
9
outstanding
=127 days + 30 days – 54 days
= 103 days
Table 7: Working capital cycle of Brentwood Plc of 2013
Closin
g
balanc
e Average Formula
Numerator
for Calc of
Turnover
ratio
Turnover
ratio
No. of days
(365 /
turnover
ratio)
Finished
goods 3550 3550
Cost of goods sold
/ average
inventory 10540 2.97 122.94
Debtors 1600 1600
Sales / average
receivable 17900 11.19 32.63
Creditors 1700 1700
Purchase / average
payable 10255 6.03 60.51
Operating cycle= Days inventory outstanding + Days sales outstanding - Days payable
outstanding
=123 days + 31 days – 61 days
= 93 days
Liquidity position of Brentwood Plc
By comparison of liquidity position of 2014 with 2013, it can be noticed that liquidity of
business has been reduced. It is because; in 2013, cash conversion cycle was 93 days which is
increased by 10 days in 2014. This aspect depicts that there will be delay of 10 days in
conversion of current assets and liabilities into cash (Kirkpatrick II and Dahlquist, 2010). For
this delay, company will be required to take funds from short term financial sources for which
they will have to pay high financial cost.
9
⊘ This is a preview!⊘
Do you want full access?
Subscribe today to unlock all pages.
Trusted by 1+ million students worldwide
PART B – GRIFFIN PLC
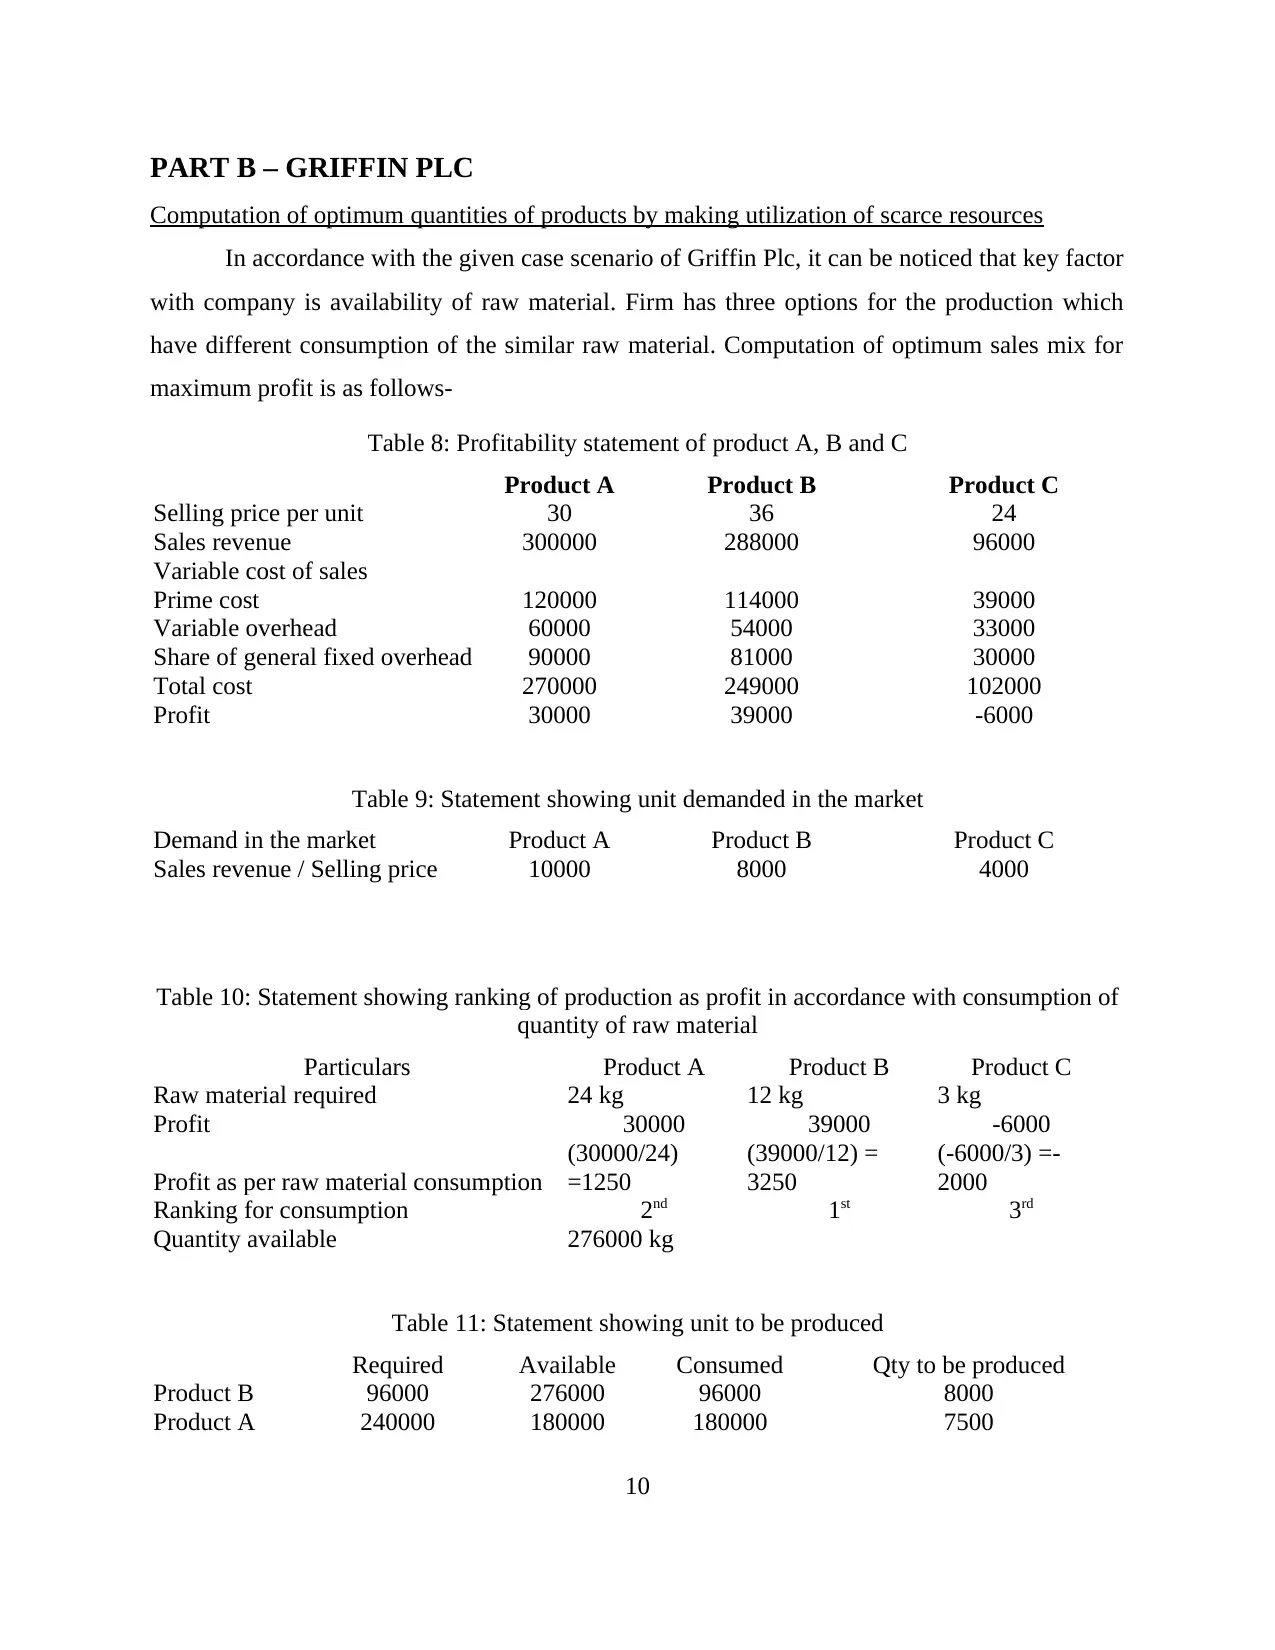
Computation of optimum quantities of products by making utilization of scarce resources
In accordance with the given case scenario of Griffin Plc, it can be noticed that key factor
with company is availability of raw material. Firm has three options for the production which
have different consumption of the similar raw material. Computation of optimum sales mix for
maximum profit is as follows-
Table 8: Profitability statement of product A, B and C
Product A Product B Product C
Selling price per unit 30 36 24
Sales revenue 300000 288000 96000
Variable cost of sales
Prime cost 120000 114000 39000
Variable overhead 60000 54000 33000
Share of general fixed overhead 90000 81000 30000
Total cost 270000 249000 102000
Profit 30000 39000 -6000
Table 9: Statement showing unit demanded in the market
Demand in the market Product A Product B Product C
Sales revenue / Selling price 10000 8000 4000
Table 10: Statement showing ranking of production as profit in accordance with consumption of
quantity of raw material
Particulars Product A Product B Product C
Raw material required 24 kg 12 kg 3 kg
Profit 30000 39000 -6000
Profit as per raw material consumption
(30000/24)
=1250
(39000/12) =
3250
(-6000/3) =-
2000
Ranking for consumption 2nd 1st 3rd
Quantity available 276000 kg
Table 11: Statement showing unit to be produced
Required Available Consumed Qty to be produced
Product B 96000 276000 96000 8000
Product A 240000 180000 180000 7500
10
Paraphrase This Document
Need a fresh take? Get an instant paraphrase of this document with our AI Paraphraser
Product C 12000 0 0 0
In order to earn maximum profit, company is required to produce 8000 units of B and
7500 units of A. In addition to this, product C should be eliminated from the sales mix because it
is providing loss to the firm (Management accounting, 2014).
Relevance to the committed fixed costs in determination of optimum mix for production
Fixed cost plays a vital role in decision making for all the organizations because it assists
the management in achieving break-even point. In order to recover all the costs, firm is required
to assure that provided contribution by production units are able to recover the fixed cost of
business. In addition to this, production mix is narrowed or widened on the basis of their fixed
costs (Kieso, Weygandt and Warfield, 2001). It is because; production can be done by
commercial organization in accordance with their budgets. Products that are profitable but are
not in the budget of company will not be produced. For example in the above case scenario,
fixed cost of product A is not affordable then firm will not produce it despite of the fact that it is
the second most profitable product.
In addition to the fixed cost, following costs affect the decision of production mix of
company-
1. Profitability- All business entities aim to maximize their profit. Due to this aspect,
organization prefers to produce those options which will make positive change in the
profitability of business.
2. Production capacity- Production mix decision also varies with the production capacity of
plant or overall business capacity. By considering this factor, company designs their mix
in such a way by which available resources can be utilized in an optimum manner (Gray
and et. al., 2013).
3. Fluctuation in demand- Decisions regarding production mix are taken with the reference
to demand of product in the market. For example, if a product is profitable but it does not
have high demand in the market then company will switch to another option. For this
aspect, previous scenario can be considered (Gibson, 2010). In that example, product B
has maximum demand of 8000 units thus; remaining raw material has been consumed on
product A.
11
4. Competition- An organization is required to design their production mix in a way that
competitive advantage can be achieved by the business. In addition to this, production
mix strategy used by competing firms will also affect the strategy of business.
5. Government rules and restriction- Companies are required to comply with regulatory
policies while formulation of production policies (Drake, 2012). Due to these factors,
sometimes, organization has to impose restrictions on certain products as they are not
permitted by the government authorities.
6. Overall condition of business and economy- In the present globalized era, no business
entity can ignore the impact of world economy. Thus, these factors are required to be
considered by the management while determination of production mixes for business.
PART C
Critical evaluation of investment appraisal techniques
Investment appraisal techniques are used to analyze proposed options for the investment
in order to assess their risk and potential profits. By making comparative evaluation of available
options, financial manager will be able to select the suitable option for their business (Deon,
2010). Description of various investment appraisal techniques along with their advantages and
disadvantages is as follows-
Net present value
In this method, computation of net inflow is done by considering the time value of
money. Organizations are recommended to make investment in option with the positive present
value (Positive Net Present Value Mean When Appraising Long-Term Projects?, 2013).
Advantages and disadvantages of this method is enumerated as below-
Advantages-
This method provides the importance to time value of money.
Analysis is done by giving priority to risk and profitability. In computation, all aspects are covered.
Disadvantages-
12
⊘ This is a preview!⊘
Do you want full access?
Subscribe today to unlock all pages.
Trusted by 1+ million students worldwide
1 out of 17
Related Documents


Your All-in-One AI-Powered Toolkit for Academic Success.
+13062052269
info@desklib.com
Available 24*7 on WhatsApp / Email
![[object Object]](/_next/static/media/star-bottom.7253800d.svg)
Unlock your academic potential
Copyright © 2020–2026 A2Z Services. All Rights Reserved. Developed and managed by ZUCOL.