Financial Management and Control: Investment Appraisal and Budgeting
VerifiedAdded on 2023/01/10
|19
|4439
|96
Report
AI Summary
This report provides a comprehensive analysis of financial management and control. It begins with an introduction to the subject, emphasizing its importance in organizational success. Part A focuses on ratio analysis, calculating and interpreting profitability, liquidity, gearing, asset utilization, and investor ratios for a company over two years. Part B delves into investment appraisal techniques, including payback period, discounted payback period, accounting rate of return (ARR), and net present value (NPV), comparing the viability of different investment options. Part C examines the budgeting process, critically evaluating the relationship between strategic plans, objectives, and budgets. The report concludes with a summary of the key findings and their implications for effective financial management. The report also includes the calculation of working capital cycle, which helps in identifying the time taken by a company in converting its current assets and liabilities into cash.

Financial Management and
control
control
Paraphrase This Document
Need a fresh take? Get an instant paraphrase of this document with our AI Paraphraser

Table of Contents
INTRODUCTION...........................................................................................................................1
PART A...........................................................................................................................................1
1. .................................................................................................................................................1
b...................................................................................................................................................4
PART B............................................................................................................................................6
1 Calculation of investment appraisal techniques.......................................................................6
2 Evaluation of key benefits and the limitations of investment appraisal techniques...............10
3 Suitable sources of finance for funding the investments. .....................................................12
PART C..........................................................................................................................................12
1. Critically evaluating process of budgeting and the manner in which strategic plan,
objectives and the budgets are inter-related..............................................................................12
CONCLUSION..............................................................................................................................14
REFERENCES .............................................................................................................................15
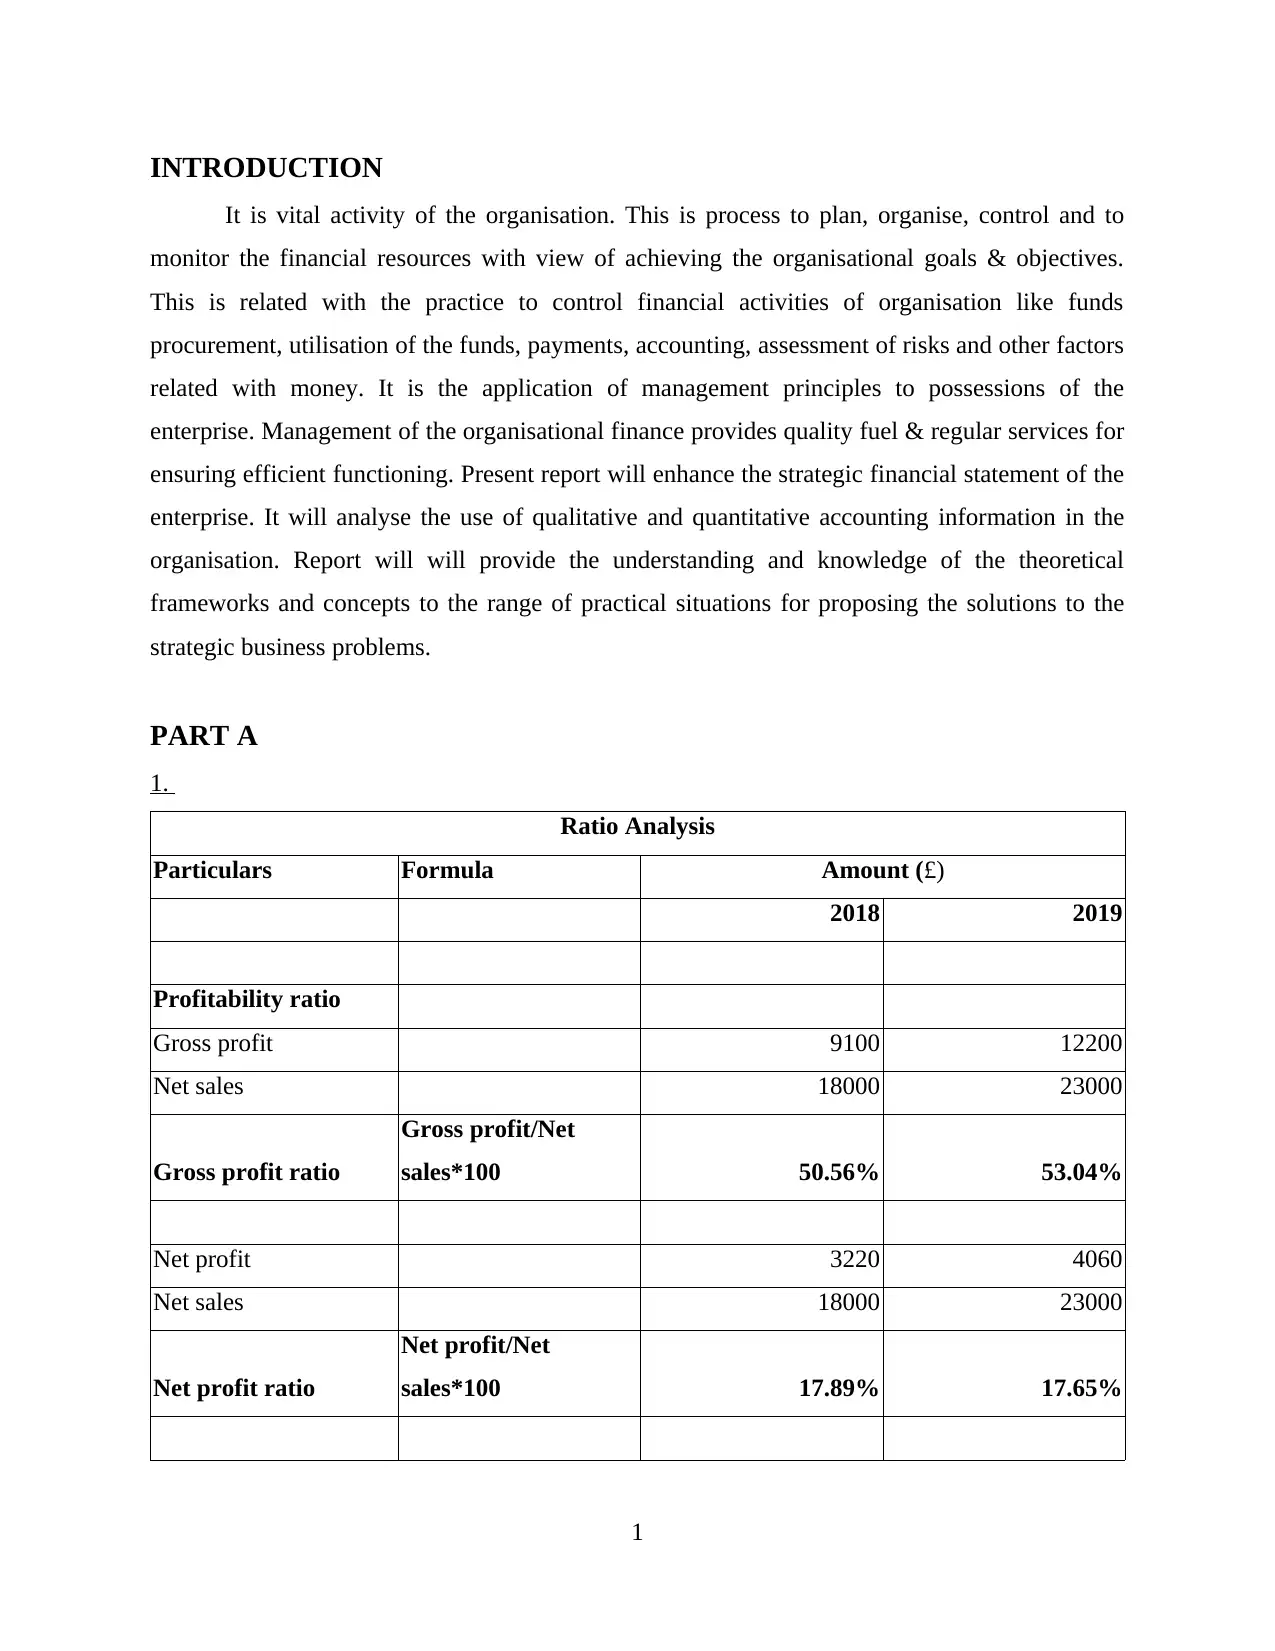
INTRODUCTION
It is vital activity of the organisation. This is process to plan, organise, control and to
monitor the financial resources with view of achieving the organisational goals & objectives.
This is related with the practice to control financial activities of organisation like funds
procurement, utilisation of the funds, payments, accounting, assessment of risks and other factors
related with money. It is the application of management principles to possessions of the
enterprise. Management of the organisational finance provides quality fuel & regular services for
ensuring efficient functioning. Present report will enhance the strategic financial statement of the
enterprise. It will analyse the use of qualitative and quantitative accounting information in the
organisation. Report will will provide the understanding and knowledge of the theoretical
frameworks and concepts to the range of practical situations for proposing the solutions to the
strategic business problems.
PART A
1.
Ratio Analysis
Particulars Formula Amount (£)
2018 2019
Profitability ratio
Gross profit 9100 12200
Net sales 18000 23000
Gross profit ratio
Gross profit/Net
sales*100 50.56% 53.04%
Net profit 3220 4060
Net sales 18000 23000
Net profit ratio
Net profit/Net
sales*100 17.89% 17.65%
1
⊘ This is a preview!⊘
Do you want full access?
Subscribe today to unlock all pages.
Trusted by 1+ million students worldwide

Liquidity ratio
Current assets 4150 5160
Current liabilities 14000 19260
Current ratio
Current
assets/Current
liabilities 0.29 0.26
Current assets 4150 5160
Inventory 1800 2360
Quick assets
Current assets-
inventory 2350 2800
Current liabilities 14000 19260
Quick ratio
Quick assets/Current
liabilities 0.16 0.14
Gearing ratio
Debt 2000 3500
Equity 10000 10000
Debt equity ratio Debt/Equity 0.2 0.35
Earnings before interest
and tax 5100 6800
Interest expense 500 1000
Interest coverage ratio
EBIT/Interest
expense 10.2 6.8
Asset utilisation ratio
Net sales 18000 23000
Average total assets 12000 15760
2
Current assets 4150 5160
Current liabilities 14000 19260
Current ratio
Current
assets/Current
liabilities 0.29 0.26
Current assets 4150 5160
Inventory 1800 2360
Quick assets
Current assets-
inventory 2350 2800
Current liabilities 14000 19260
Quick ratio
Quick assets/Current
liabilities 0.16 0.14
Gearing ratio
Debt 2000 3500
Equity 10000 10000
Debt equity ratio Debt/Equity 0.2 0.35
Earnings before interest
and tax 5100 6800
Interest expense 500 1000
Interest coverage ratio
EBIT/Interest
expense 10.2 6.8
Asset utilisation ratio
Net sales 18000 23000
Average total assets 12000 15760
2
Paraphrase This Document
Need a fresh take? Get an instant paraphrase of this document with our AI Paraphraser

Asset turnover ratio
Net sales/Avg total
assets 1.5 1.4593908629
Investors ratio
Net income 3220 4060
Average shares
outstanding 10000 10000
Earning per share
ratio
Net income/ Average
shares outstanding 0.32 0.41
Total dividends paid 200 300
Number of the ordinary
shares 10000 10000
DPS
Total dividend paid/
Number of ordinary
shares 0.02 0.03
Profitability- It refers to the class of the financial metric which is been used for accessing
an ability of the business in generating the earnings in relation its operating cost, revenue,
balance sheet and shareholders funds over the time by making use of the data at specific point
time period. It includes gross and net margin ratio that are considered as the major profitability
ratio which reflects the operational and overall performance of an enterprise. Gross margin
indicates the operational performance of the company by measuring capability of the company
in meeting its variable expenses by generating sales (Murad and et.al., 2019). Over the period of
2 years, GP ratio of Bitmap Plc is increasing which means that its revenue increases and this
shows better operations of company. However, net profit margin reflects ab ability of an entity in
gaining profits after making payment of all its income, expenses and tax obligation. The NP ratio
of Bitmap Plc is declining from one period to other which depicts that company is bearing high
operating expense that results to gaining of lower margins against the high sales. Overall the
3
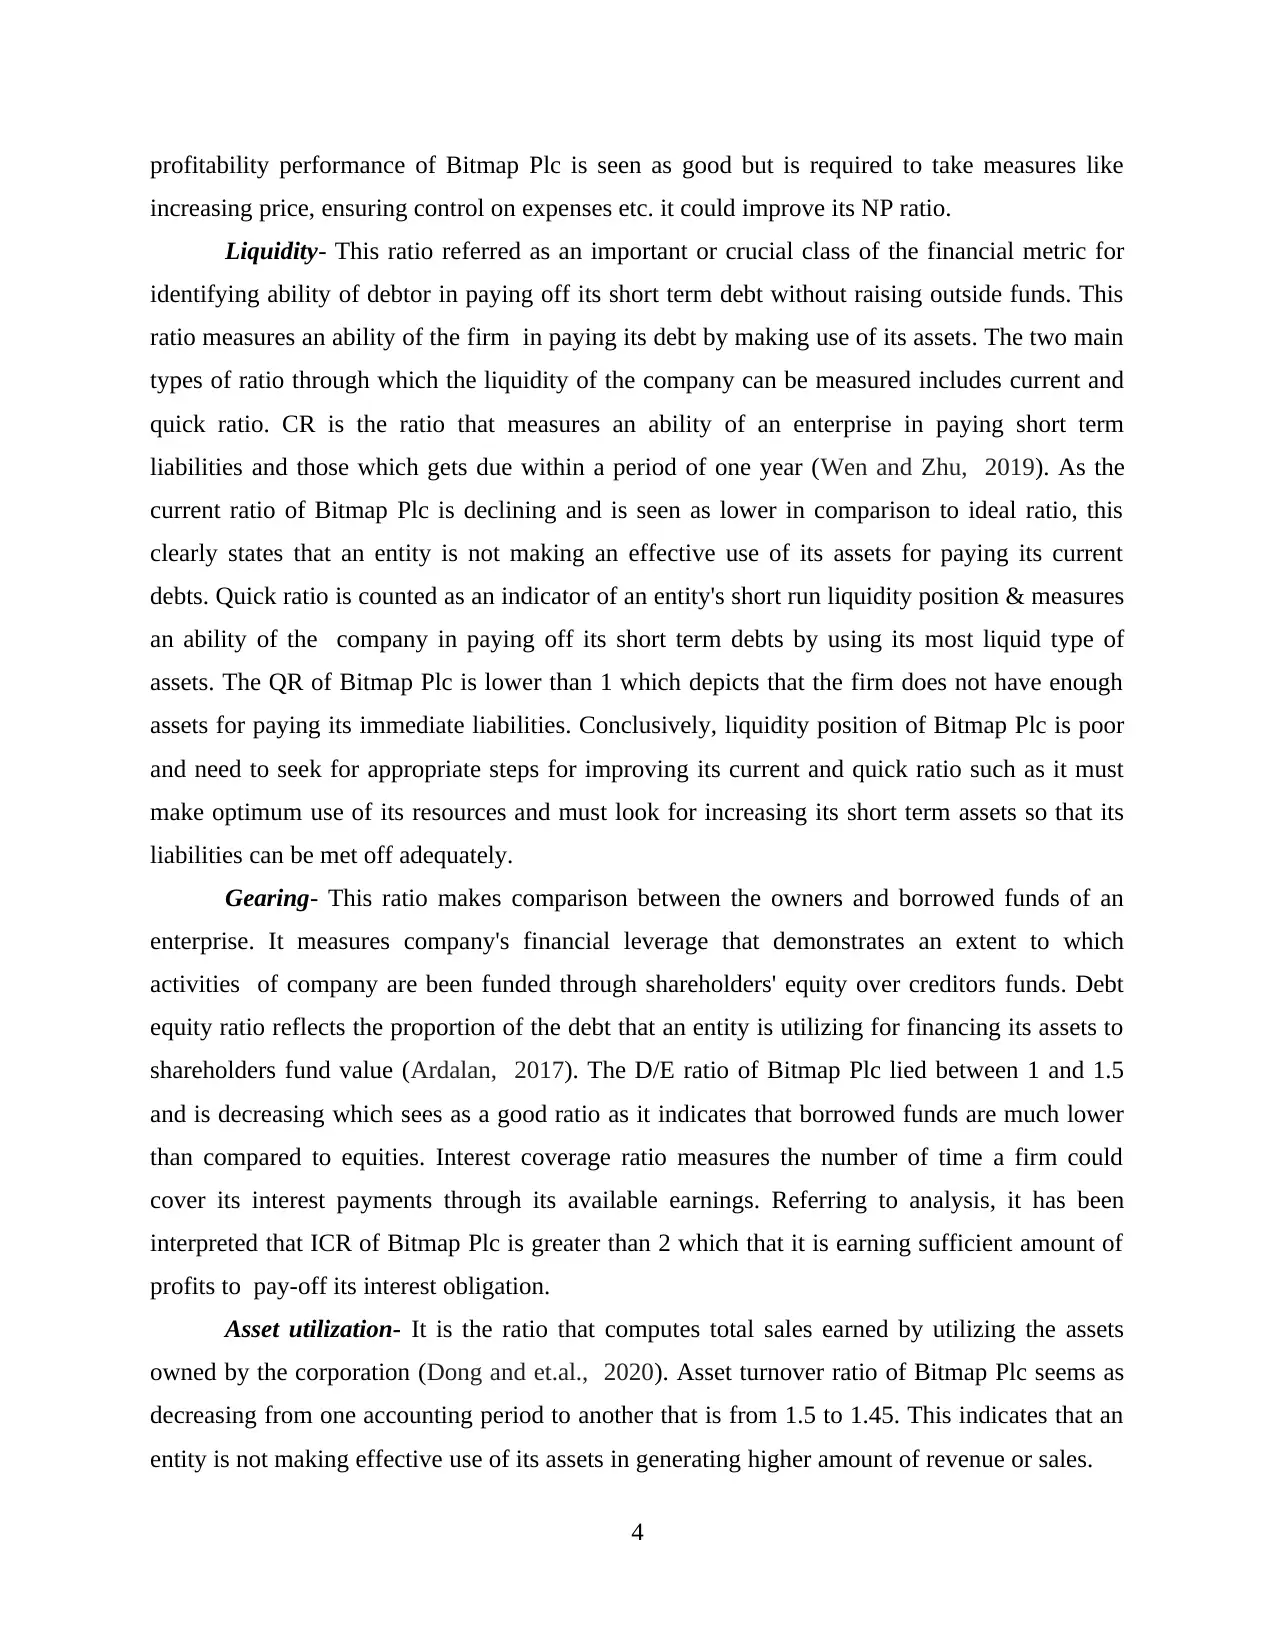
profitability performance of Bitmap Plc is seen as good but is required to take measures like
increasing price, ensuring control on expenses etc. it could improve its NP ratio.
Liquidity- This ratio referred as an important or crucial class of the financial metric for
identifying ability of debtor in paying off its short term debt without raising outside funds. This
ratio measures an ability of the firm in paying its debt by making use of its assets. The two main
types of ratio through which the liquidity of the company can be measured includes current and
quick ratio. CR is the ratio that measures an ability of an enterprise in paying short term
liabilities and those which gets due within a period of one year (Wen and Zhu, 2019). As the
current ratio of Bitmap Plc is declining and is seen as lower in comparison to ideal ratio, this
clearly states that an entity is not making an effective use of its assets for paying its current
debts. Quick ratio is counted as an indicator of an entity's short run liquidity position & measures
an ability of the company in paying off its short term debts by using its most liquid type of
assets. The QR of Bitmap Plc is lower than 1 which depicts that the firm does not have enough
assets for paying its immediate liabilities. Conclusively, liquidity position of Bitmap Plc is poor
and need to seek for appropriate steps for improving its current and quick ratio such as it must
make optimum use of its resources and must look for increasing its short term assets so that its
liabilities can be met off adequately.
Gearing- This ratio makes comparison between the owners and borrowed funds of an
enterprise. It measures company's financial leverage that demonstrates an extent to which
activities of company are been funded through shareholders' equity over creditors funds. Debt
equity ratio reflects the proportion of the debt that an entity is utilizing for financing its assets to
shareholders fund value (Ardalan, 2017). The D/E ratio of Bitmap Plc lied between 1 and 1.5
and is decreasing which sees as a good ratio as it indicates that borrowed funds are much lower
than compared to equities. Interest coverage ratio measures the number of time a firm could
cover its interest payments through its available earnings. Referring to analysis, it has been
interpreted that ICR of Bitmap Plc is greater than 2 which that it is earning sufficient amount of
profits to pay-off its interest obligation.
Asset utilization- It is the ratio that computes total sales earned by utilizing the assets
owned by the corporation (Dong and et.al., 2020). Asset turnover ratio of Bitmap Plc seems as
decreasing from one accounting period to another that is from 1.5 to 1.45. This indicates that an
entity is not making effective use of its assets in generating higher amount of revenue or sales.
4
⊘ This is a preview!⊘
Do you want full access?
Subscribe today to unlock all pages.
Trusted by 1+ million students worldwide
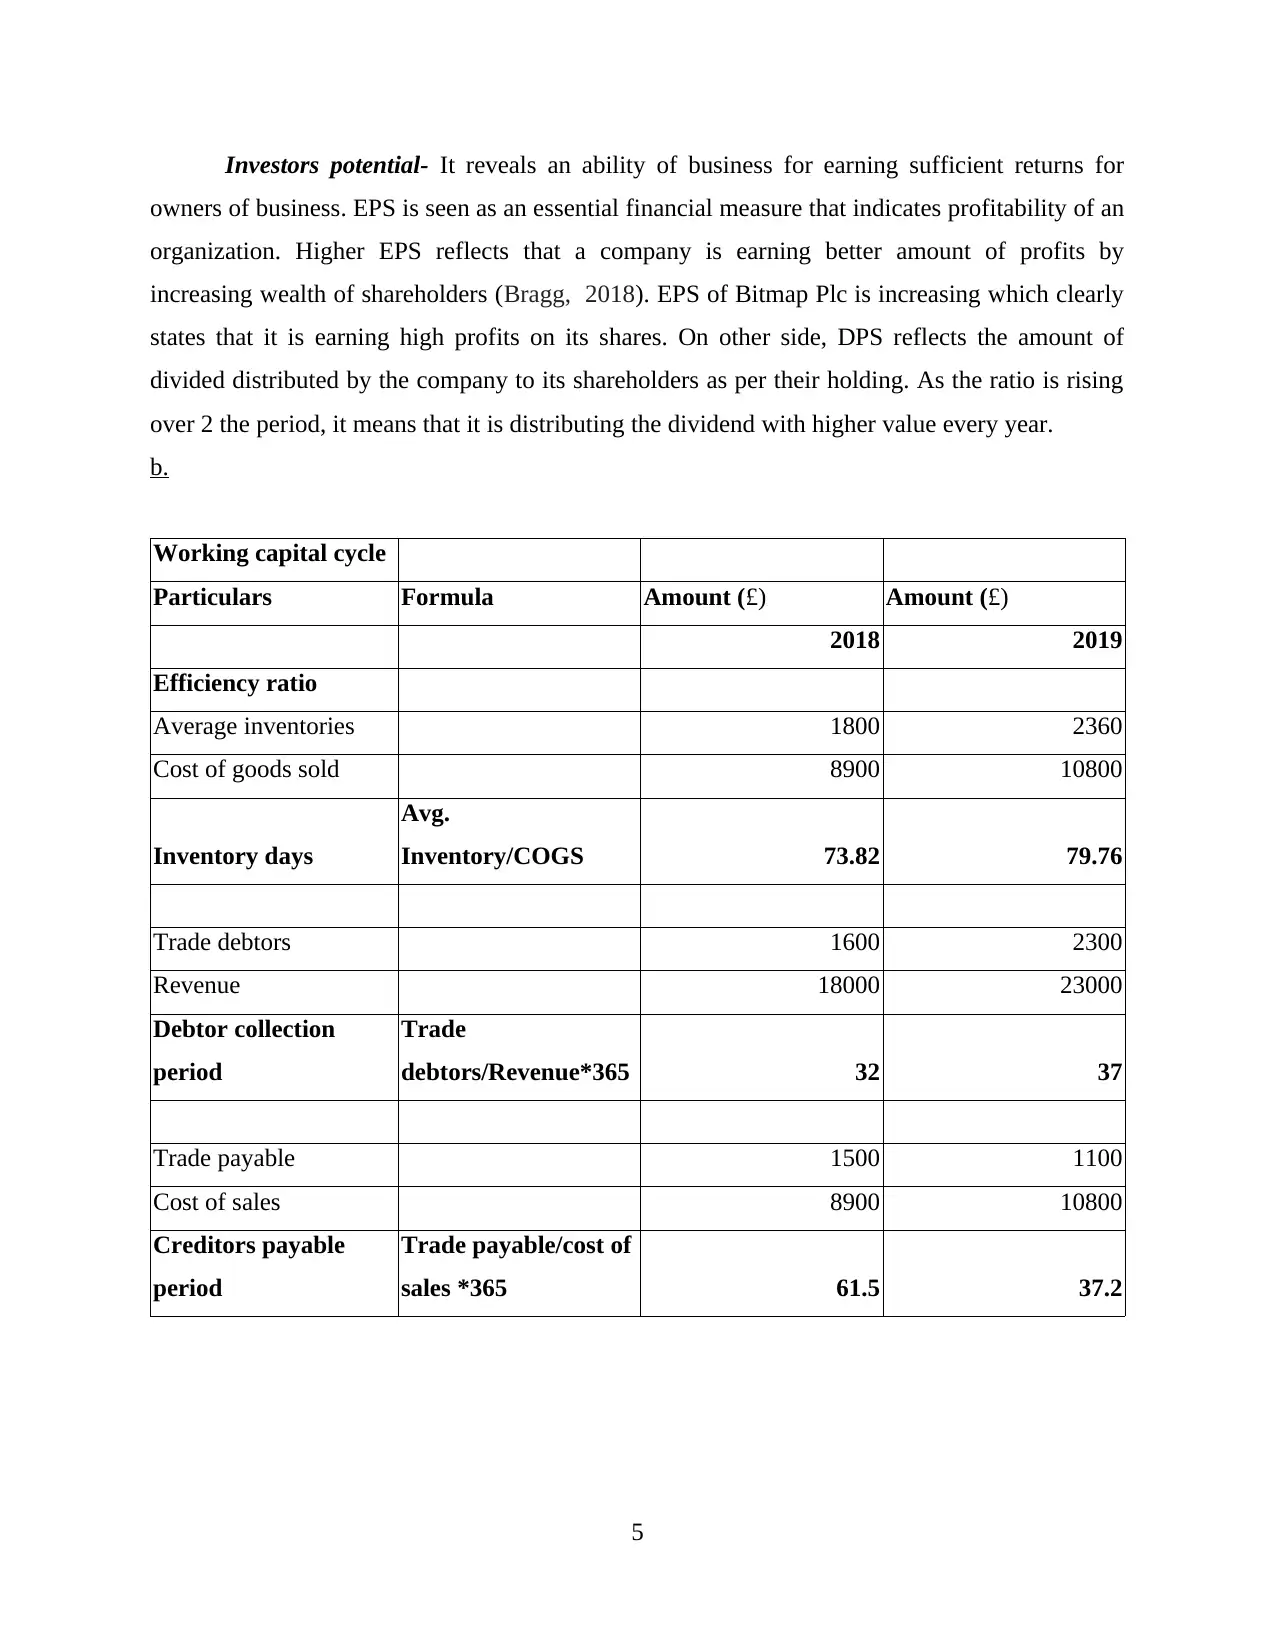
Investors potential- It reveals an ability of business for earning sufficient returns for
owners of business. EPS is seen as an essential financial measure that indicates profitability of an
organization. Higher EPS reflects that a company is earning better amount of profits by
increasing wealth of shareholders (Bragg, 2018). EPS of Bitmap Plc is increasing which clearly
states that it is earning high profits on its shares. On other side, DPS reflects the amount of
divided distributed by the company to its shareholders as per their holding. As the ratio is rising
over 2 the period, it means that it is distributing the dividend with higher value every year.
b.
Working capital cycle
Particulars Formula Amount (£) Amount (£)
2018 2019
Efficiency ratio
Average inventories 1800 2360
Cost of goods sold 8900 10800
Inventory days
Avg.
Inventory/COGS 73.82 79.76
Trade debtors 1600 2300
Revenue 18000 23000
Debtor collection
period
Trade
debtors/Revenue*365 32 37
Trade payable 1500 1100
Cost of sales 8900 10800
Creditors payable
period
Trade payable/cost of
sales *365 61.5 37.2
5
Paraphrase This Document
Need a fresh take? Get an instant paraphrase of this document with our AI Paraphraser
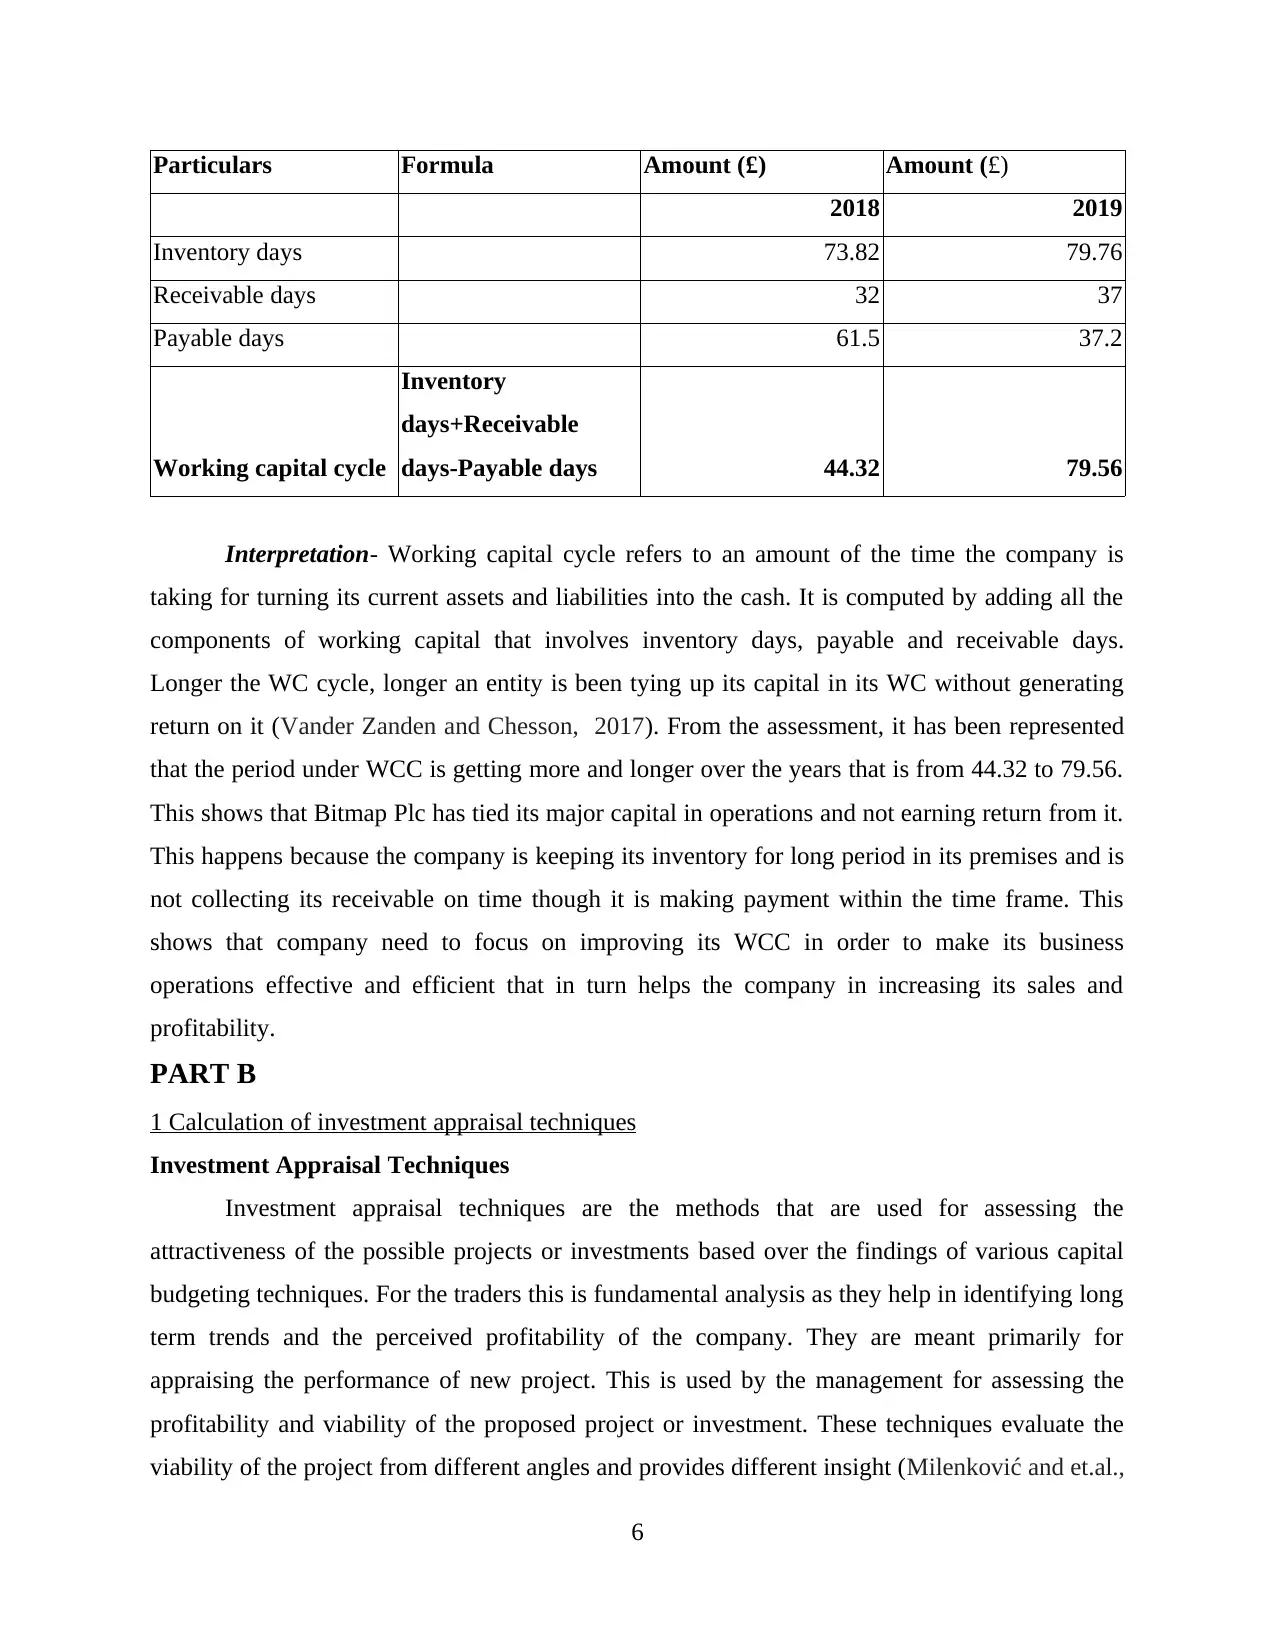
Particulars Formula Amount (£) Amount (£)
2018 2019
Inventory days 73.82 79.76
Receivable days 32 37
Payable days 61.5 37.2
Working capital cycle
Inventory
days+Receivable
days-Payable days 44.32 79.56
Interpretation- Working capital cycle refers to an amount of the time the company is
taking for turning its current assets and liabilities into the cash. It is computed by adding all the
components of working capital that involves inventory days, payable and receivable days.
Longer the WC cycle, longer an entity is been tying up its capital in its WC without generating
return on it (Vander Zanden and Chesson, 2017). From the assessment, it has been represented
that the period under WCC is getting more and longer over the years that is from 44.32 to 79.56.
This shows that Bitmap Plc has tied its major capital in operations and not earning return from it.
This happens because the company is keeping its inventory for long period in its premises and is
not collecting its receivable on time though it is making payment within the time frame. This
shows that company need to focus on improving its WCC in order to make its business
operations effective and efficient that in turn helps the company in increasing its sales and
profitability.
PART B
1 Calculation of investment appraisal techniques
Investment Appraisal Techniques
Investment appraisal techniques are the methods that are used for assessing the
attractiveness of the possible projects or investments based over the findings of various capital
budgeting techniques. For the traders this is fundamental analysis as they help in identifying long
term trends and the perceived profitability of the company. They are meant primarily for
appraising the performance of new project. This is used by the management for assessing the
profitability and viability of the proposed project or investment. These techniques evaluate the
viability of the project from different angles and provides different insight (Milenković and et.al.,
6
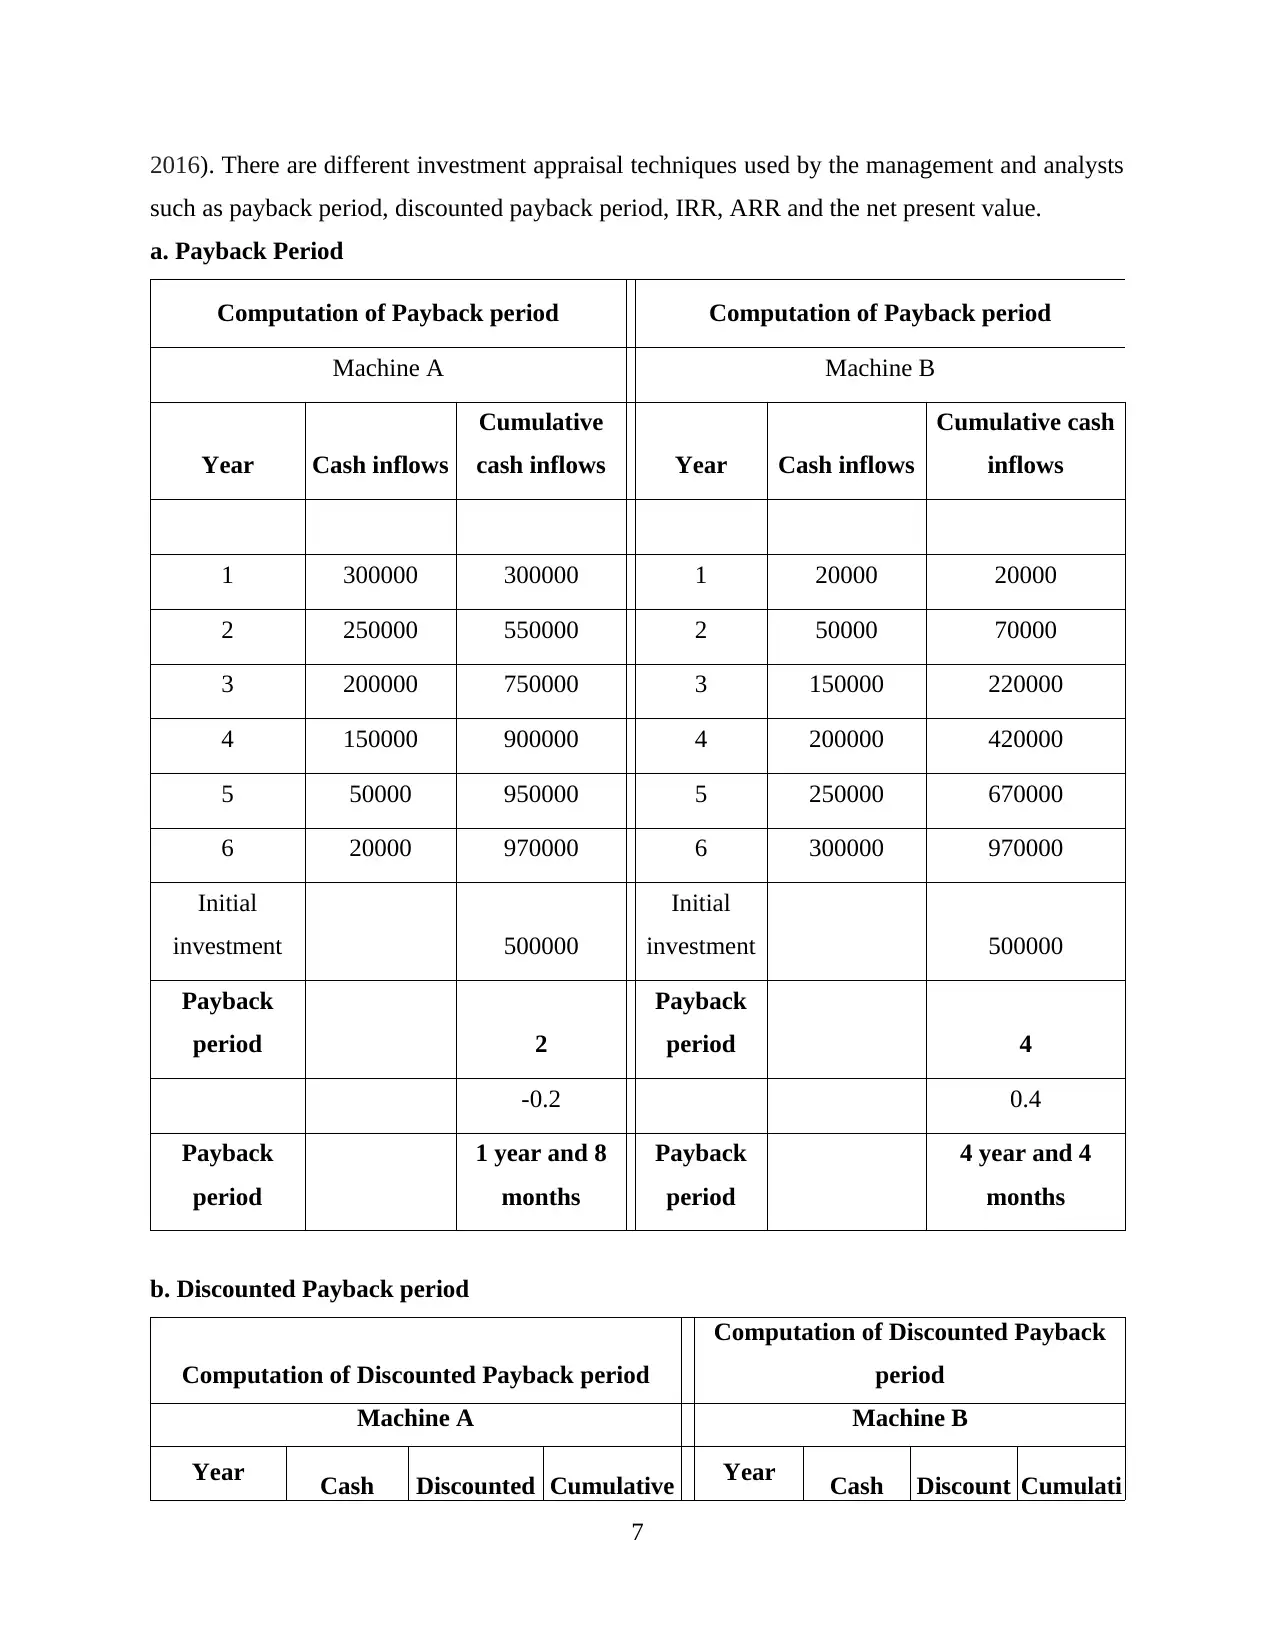
2016). There are different investment appraisal techniques used by the management and analysts
such as payback period, discounted payback period, IRR, ARR and the net present value.
a. Payback Period
Computation of Payback period Computation of Payback period
Machine A Machine B
Year Cash inflows
Cumulative
cash inflows Year Cash inflows
Cumulative cash
inflows
1 300000 300000 1 20000 20000
2 250000 550000 2 50000 70000
3 200000 750000 3 150000 220000
4 150000 900000 4 200000 420000
5 50000 950000 5 250000 670000
6 20000 970000 6 300000 970000
Initial
investment 500000
Initial
investment 500000
Payback
period 2
Payback
period 4
-0.2 0.4
Payback
period
1 year and 8
months
Payback
period
4 year and 4
months
b. Discounted Payback period
Computation of Discounted Payback period
Computation of Discounted Payback
period
Machine A Machine B
Year Cash Discounted Cumulative Year Cash Discount Cumulati
7
⊘ This is a preview!⊘
Do you want full access?
Subscribe today to unlock all pages.
Trusted by 1+ million students worldwide
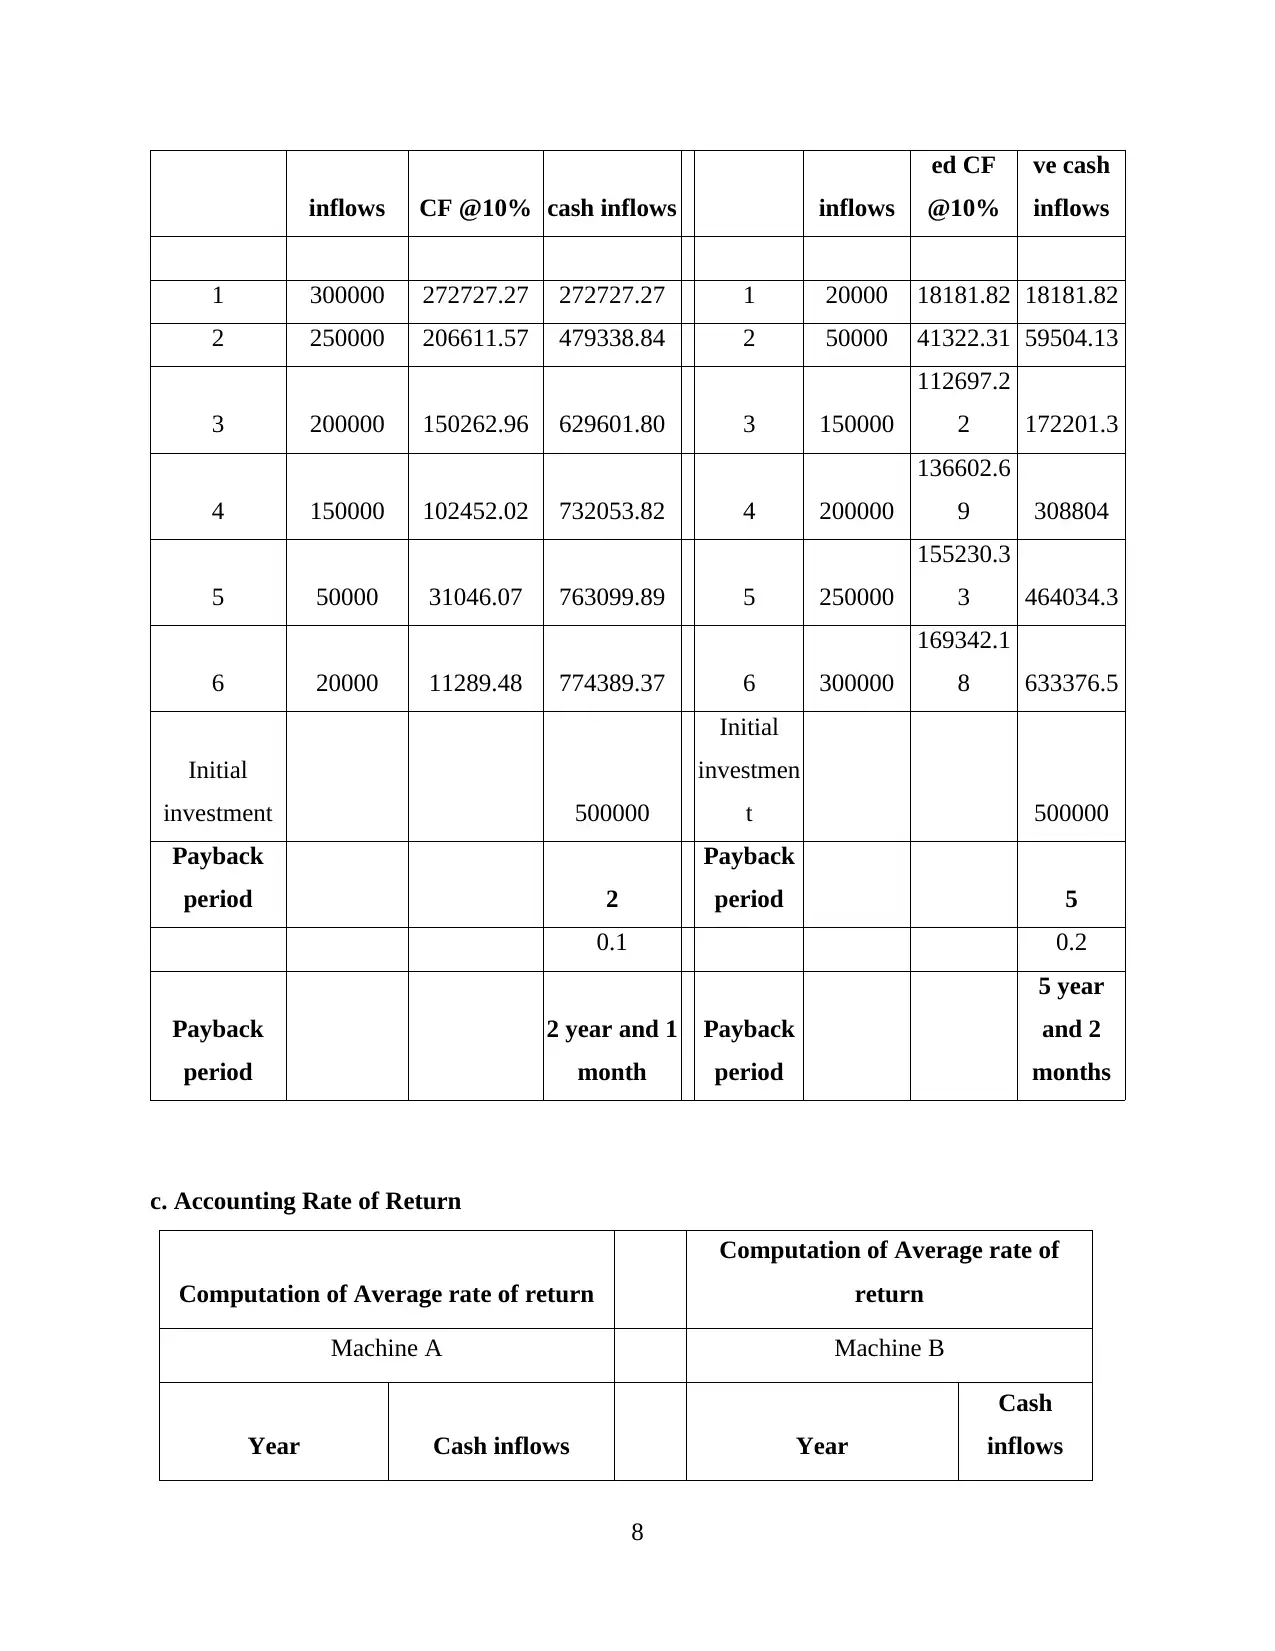
inflows CF @10% cash inflows inflows
ed CF
@10%
ve cash
inflows
1 300000 272727.27 272727.27 1 20000 18181.82 18181.82
2 250000 206611.57 479338.84 2 50000 41322.31 59504.13
3 200000 150262.96 629601.80 3 150000
112697.2
2 172201.3
4 150000 102452.02 732053.82 4 200000
136602.6
9 308804
5 50000 31046.07 763099.89 5 250000
155230.3
3 464034.3
6 20000 11289.48 774389.37 6 300000
169342.1
8 633376.5
Initial
investment 500000
Initial
investmen
t 500000
Payback
period 2
Payback
period 5
0.1 0.2
Payback
period
2 year and 1
month
Payback
period
5 year
and 2
months
c. Accounting Rate of Return
Computation of Average rate of return
Computation of Average rate of
return
Machine A Machine B
Year Cash inflows Year
Cash
inflows
8
Paraphrase This Document
Need a fresh take? Get an instant paraphrase of this document with our AI Paraphraser
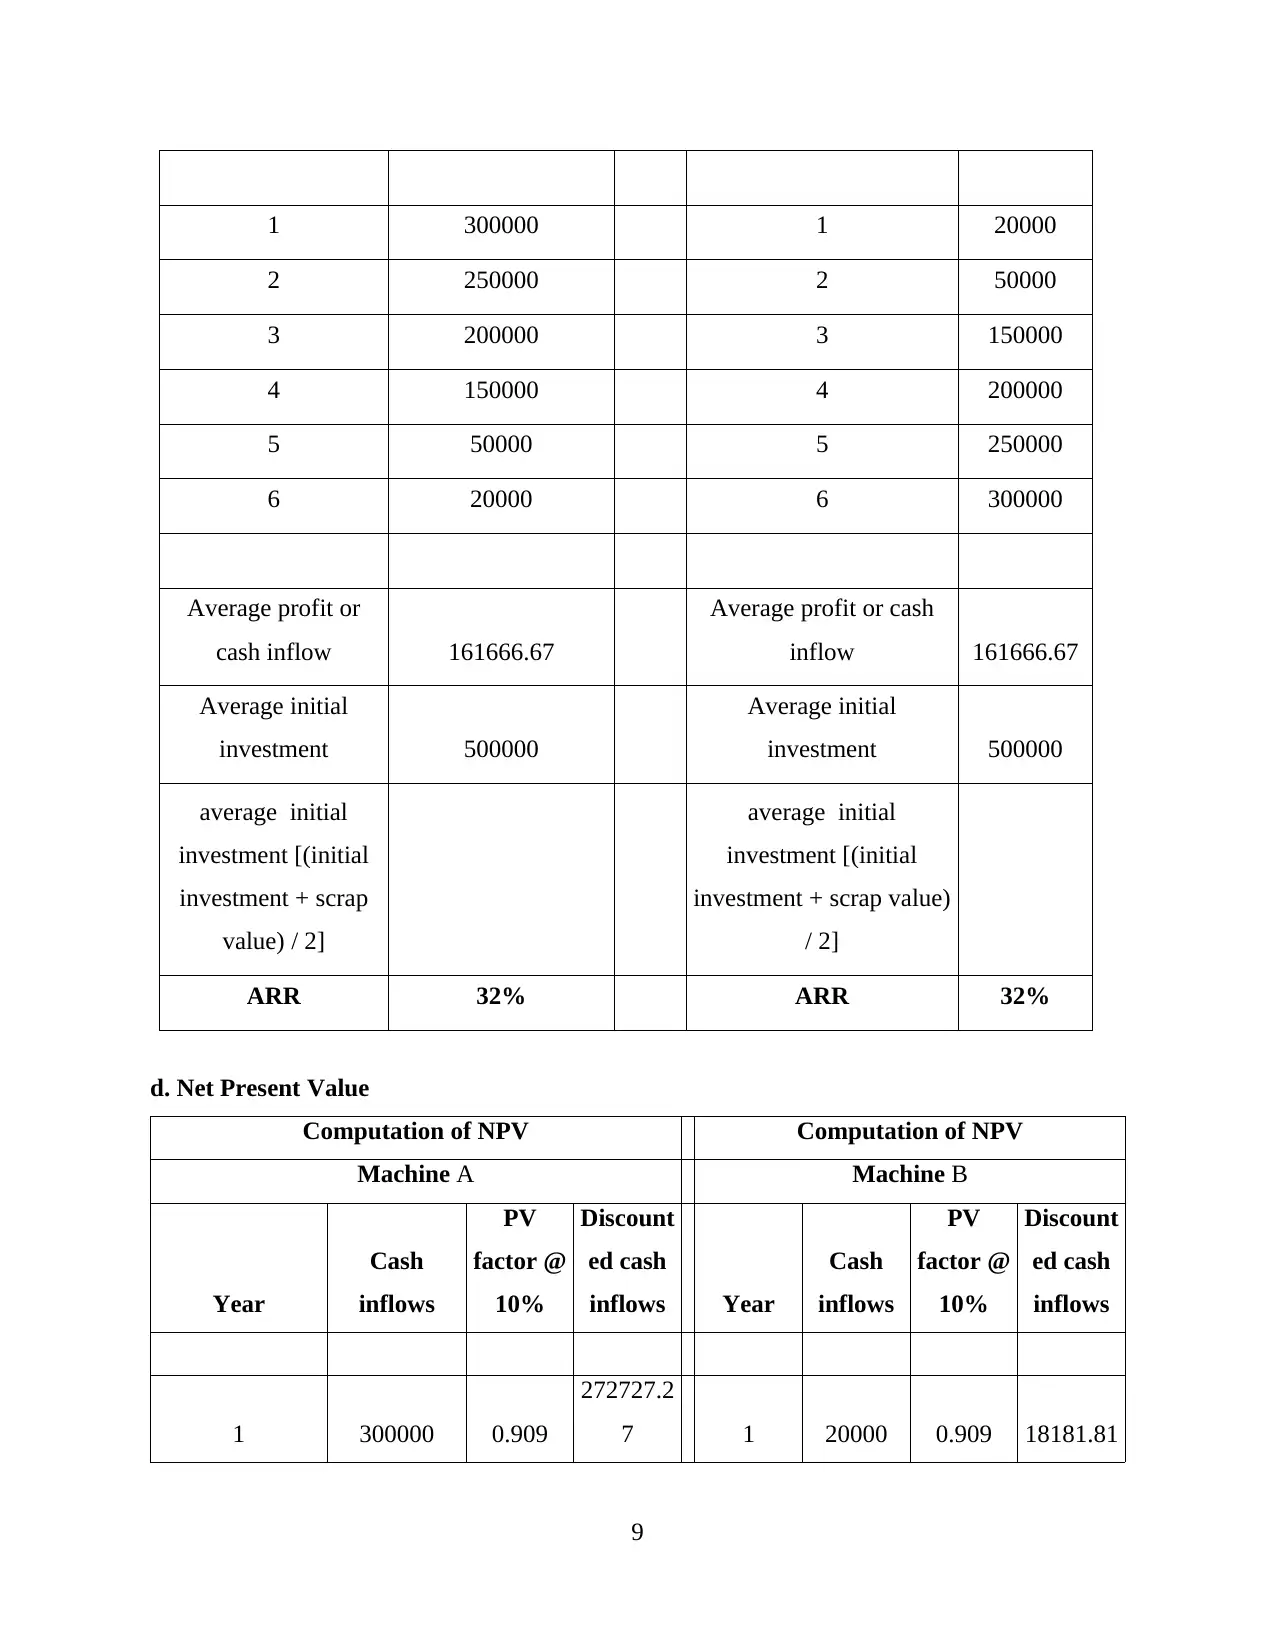
1 300000 1 20000
2 250000 2 50000
3 200000 3 150000
4 150000 4 200000
5 50000 5 250000
6 20000 6 300000
Average profit or
cash inflow 161666.67
Average profit or cash
inflow 161666.67
Average initial
investment 500000
Average initial
investment 500000
average initial
investment [(initial
investment + scrap
value) / 2]
average initial
investment [(initial
investment + scrap value)
/ 2]
ARR 32% ARR 32%
d. Net Present Value
Computation of NPV Computation of NPV
Machine A Machine B
Year
Cash
inflows
PV
factor @
10%
Discount
ed cash
inflows Year
Cash
inflows
PV
factor @
10%
Discount
ed cash
inflows
1 300000 0.909
272727.2
7 1 20000 0.909 18181.81
9
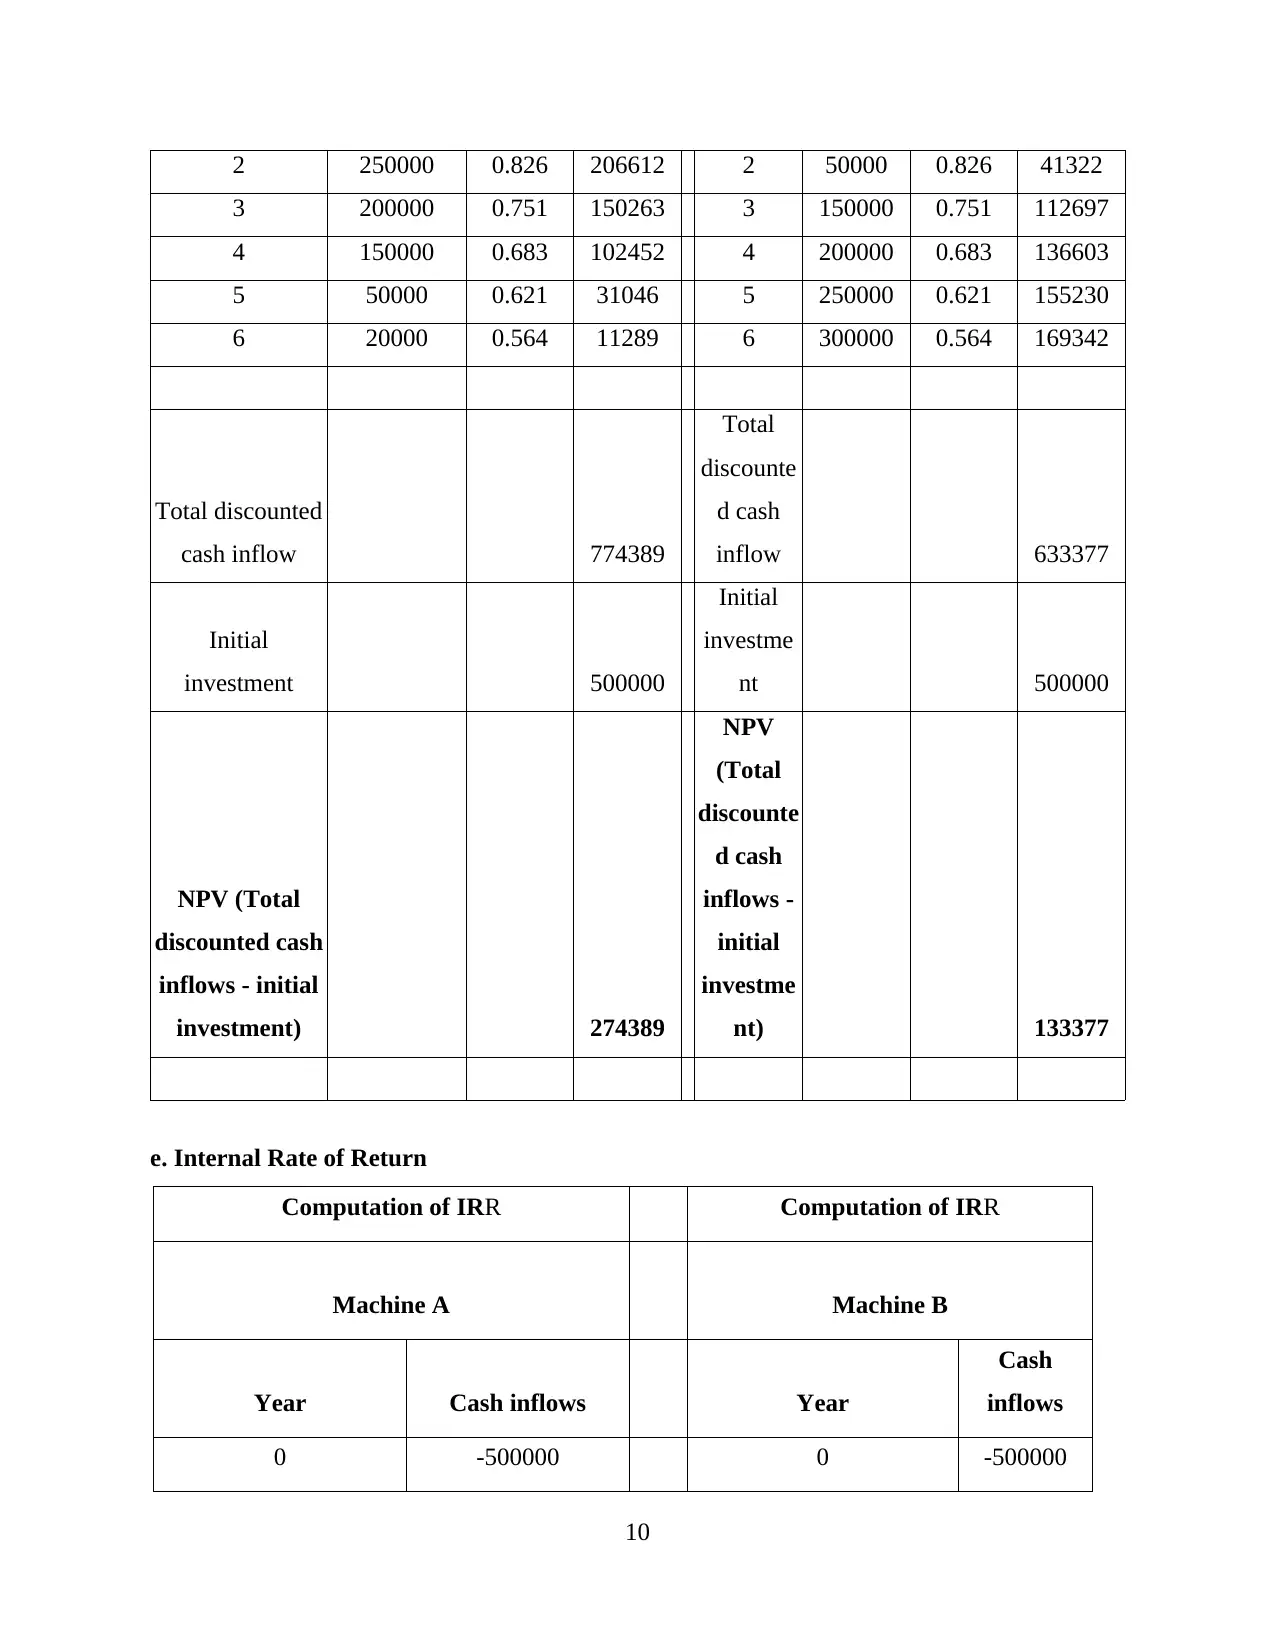
2 250000 0.826 206612 2 50000 0.826 41322
3 200000 0.751 150263 3 150000 0.751 112697
4 150000 0.683 102452 4 200000 0.683 136603
5 50000 0.621 31046 5 250000 0.621 155230
6 20000 0.564 11289 6 300000 0.564 169342
Total discounted
cash inflow 774389
Total
discounte
d cash
inflow 633377
Initial
investment 500000
Initial
investme
nt 500000
NPV (Total
discounted cash
inflows - initial
investment) 274389
NPV
(Total
discounte
d cash
inflows -
initial
investme
nt) 133377
e. Internal Rate of Return
Computation of IRR Computation of IRR
Machine A Machine B
Year Cash inflows Year
Cash
inflows
0 -500000 0 -500000
10
⊘ This is a preview!⊘
Do you want full access?
Subscribe today to unlock all pages.
Trusted by 1+ million students worldwide
1 out of 19
Related Documents


Your All-in-One AI-Powered Toolkit for Academic Success.
+13062052269
info@desklib.com
Available 24*7 on WhatsApp / Email
![[object Object]](/_next/static/media/star-bottom.7253800d.svg)
Unlock your academic potential
Copyright © 2020–2026 A2Z Services. All Rights Reserved. Developed and managed by ZUCOL.