Financial Management Project: Highsky Company, Cost of Capital

Verified

Added on  2023/06/05

|16
|2391
|346
Project
AI Summary
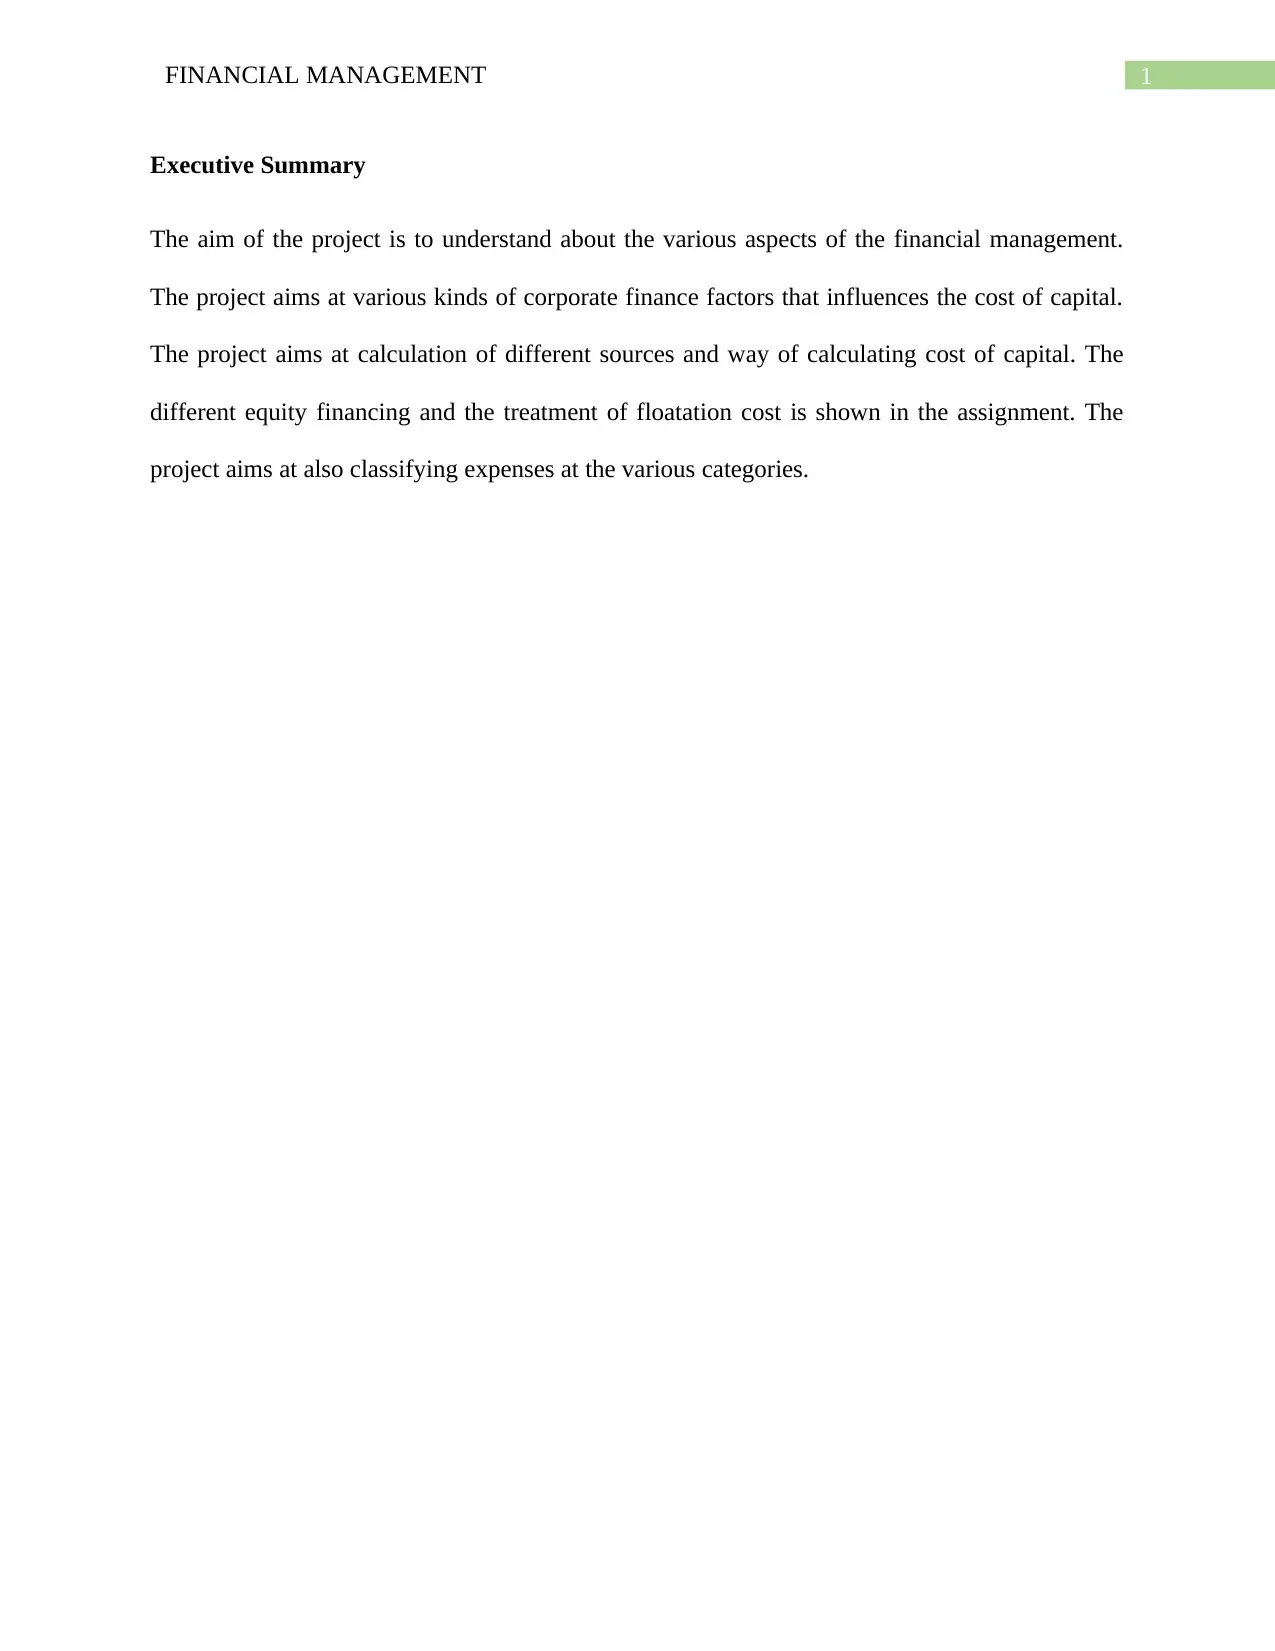
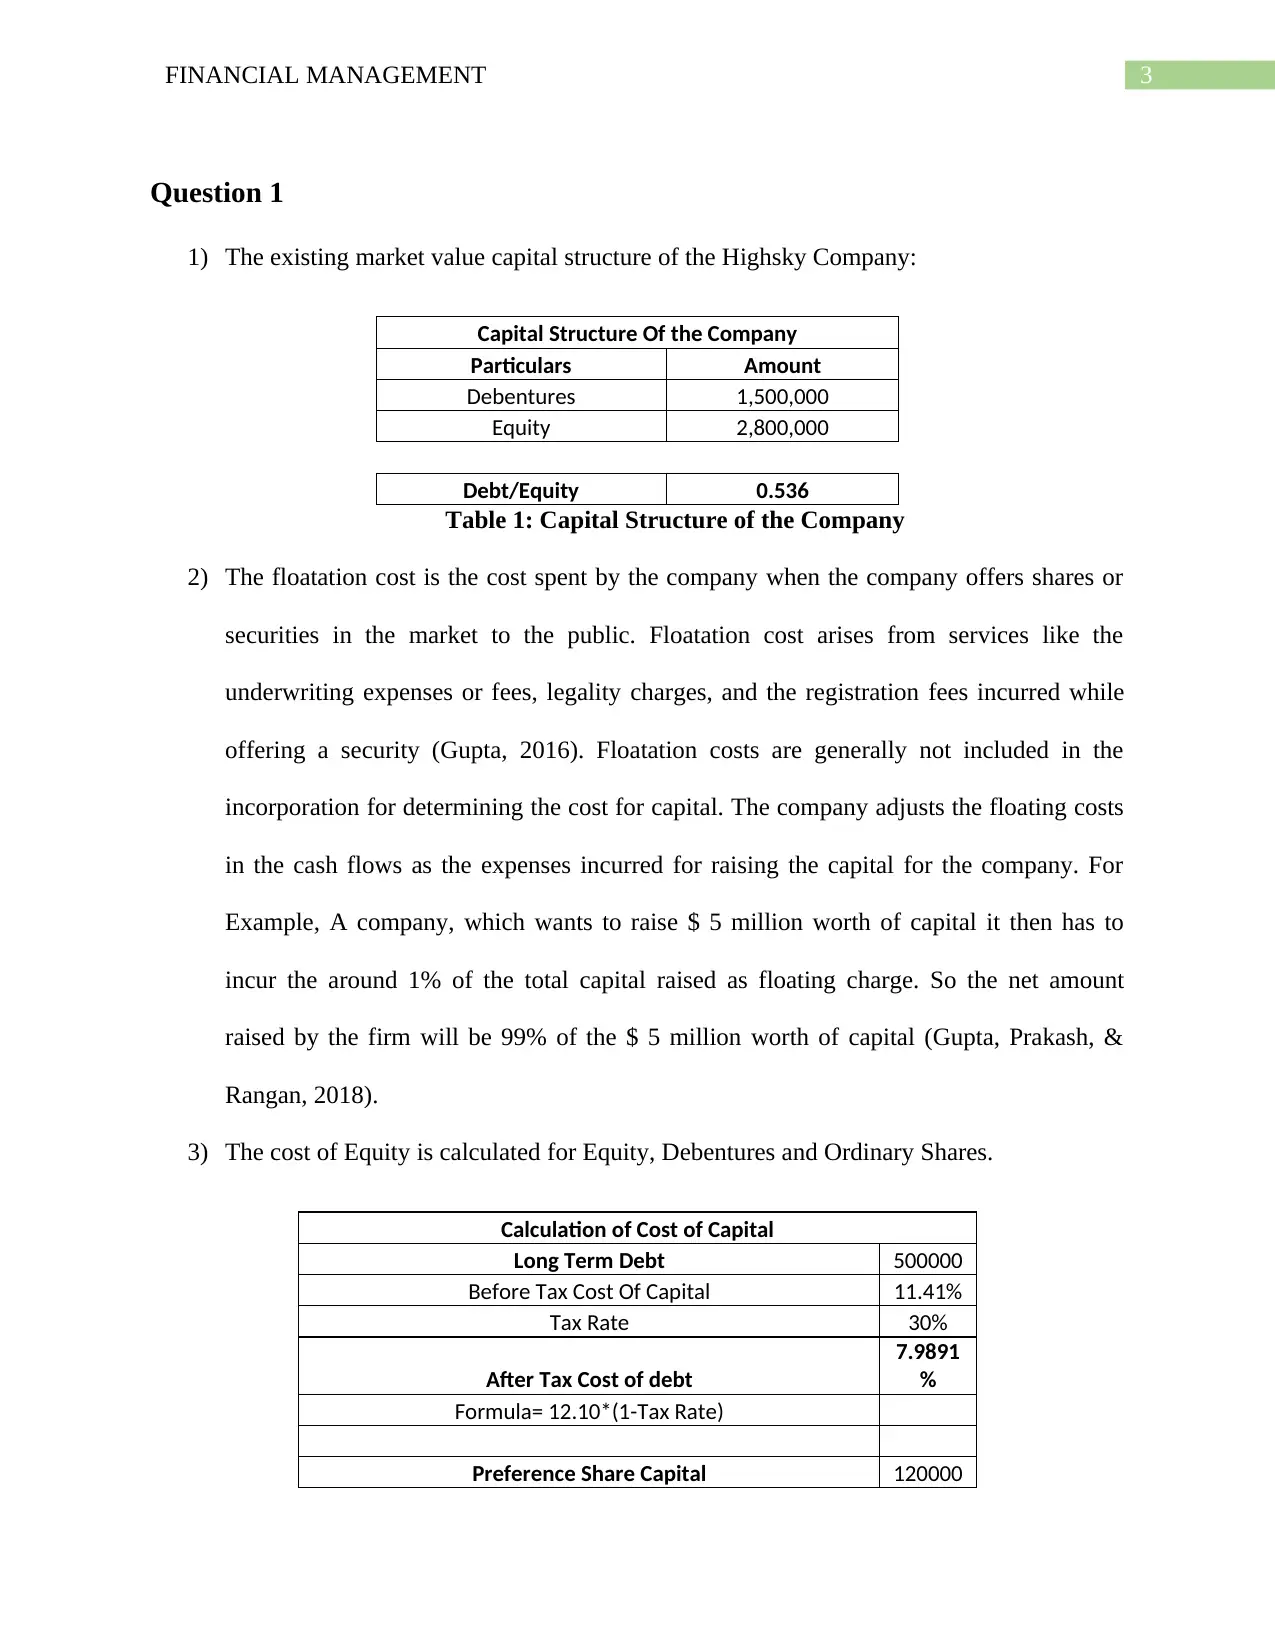
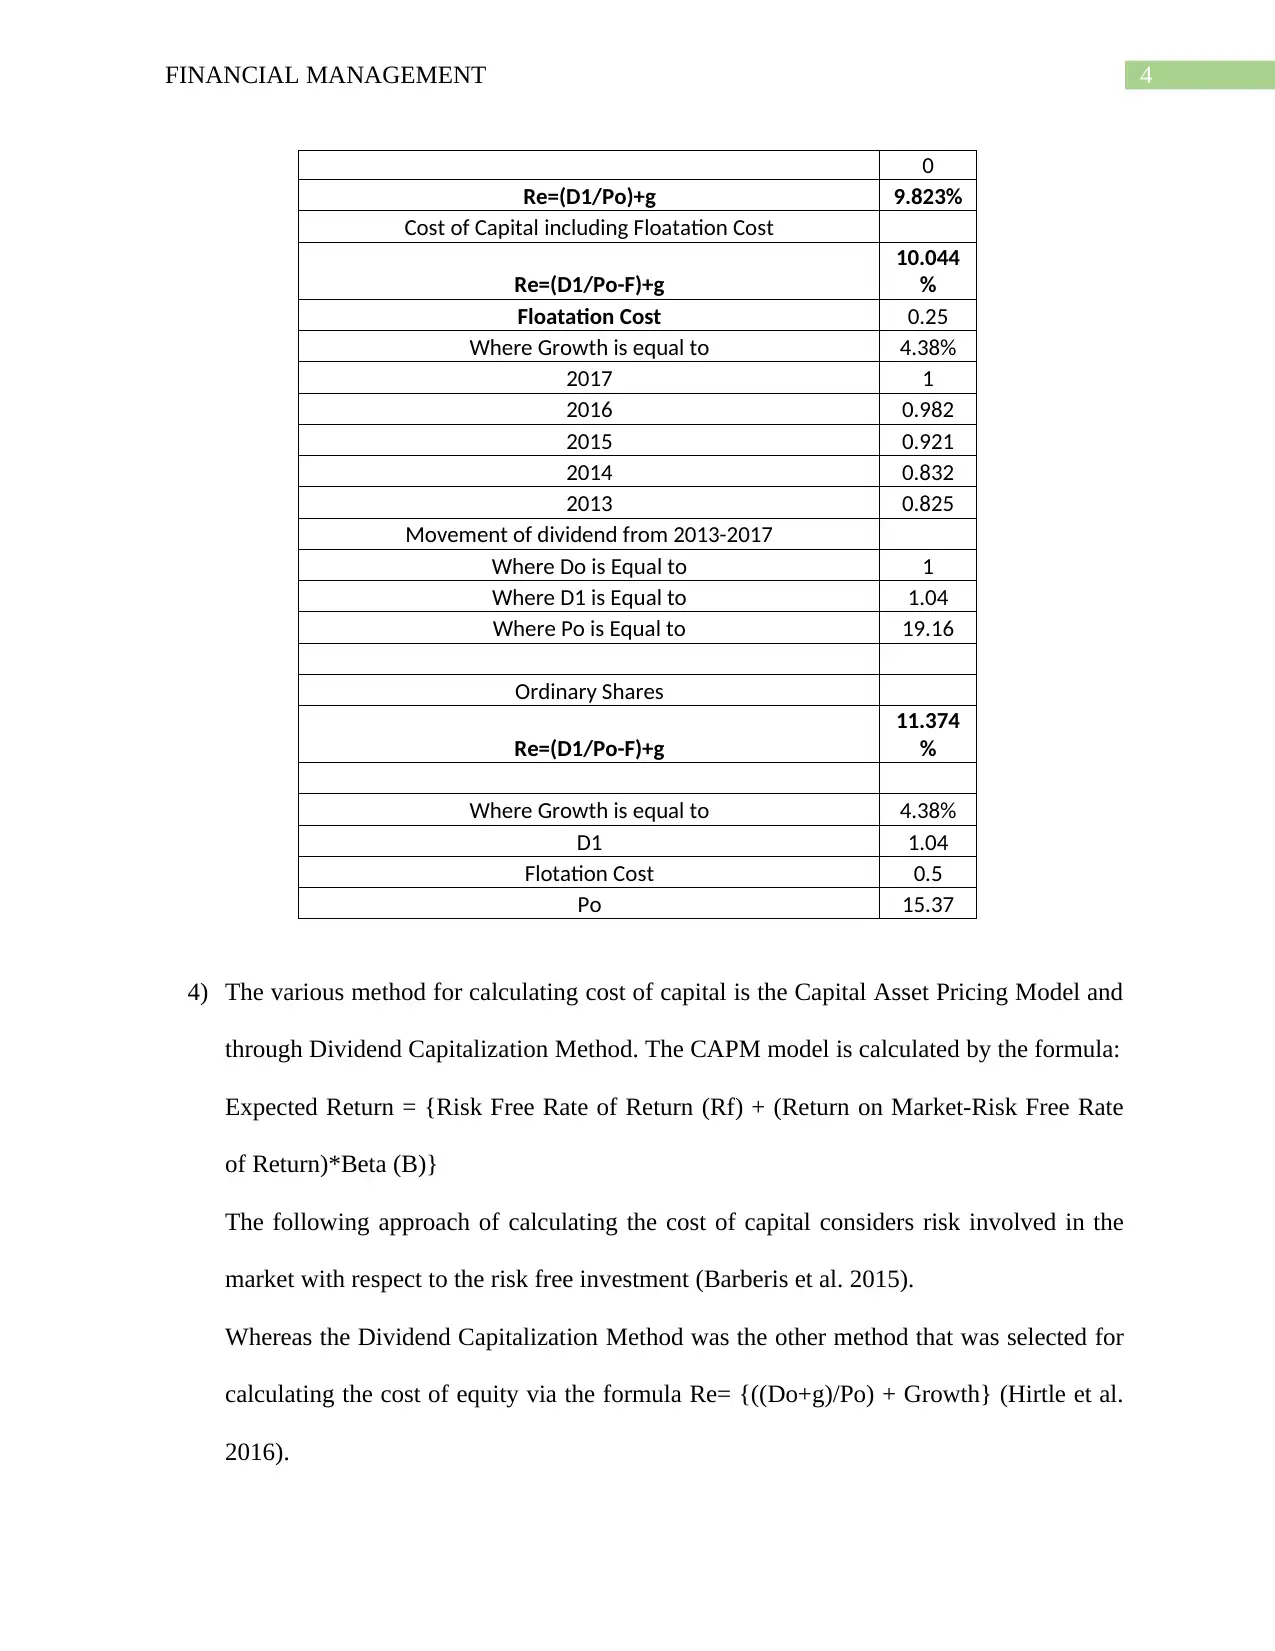
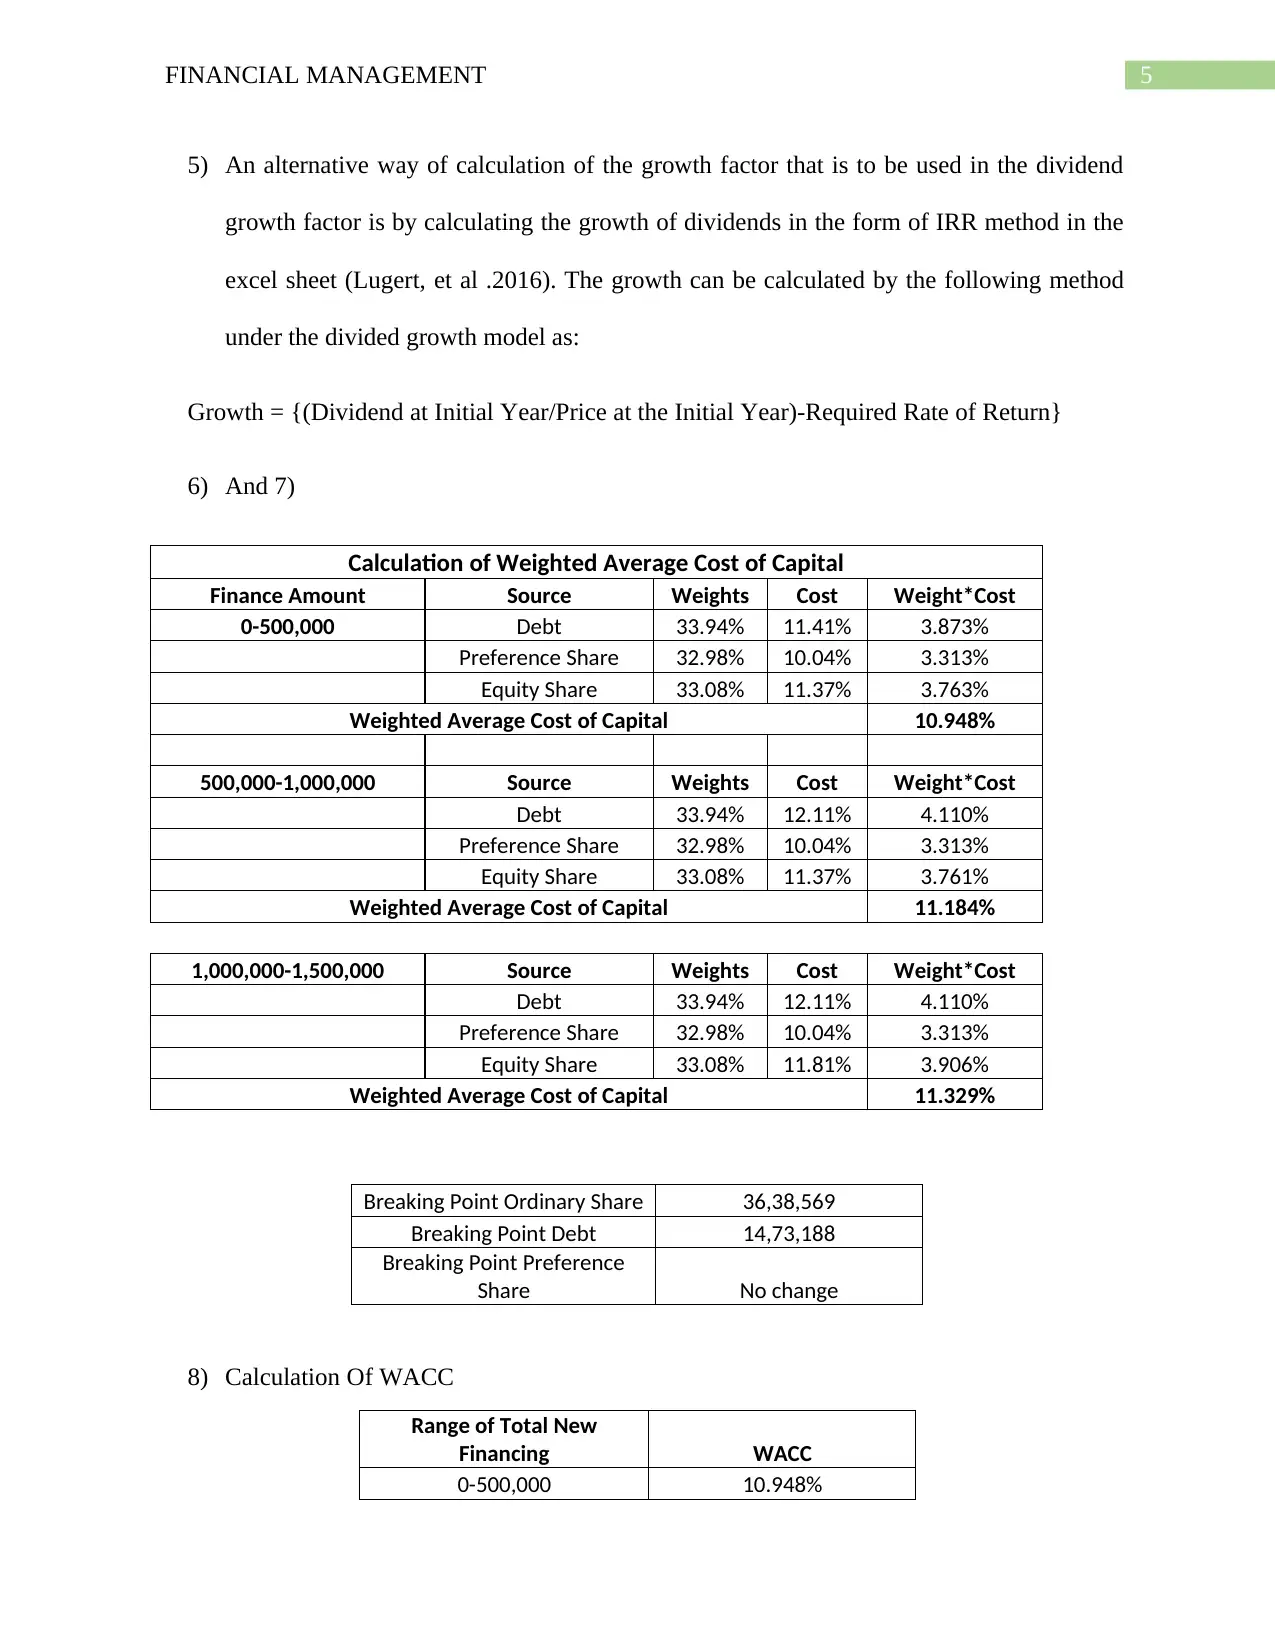
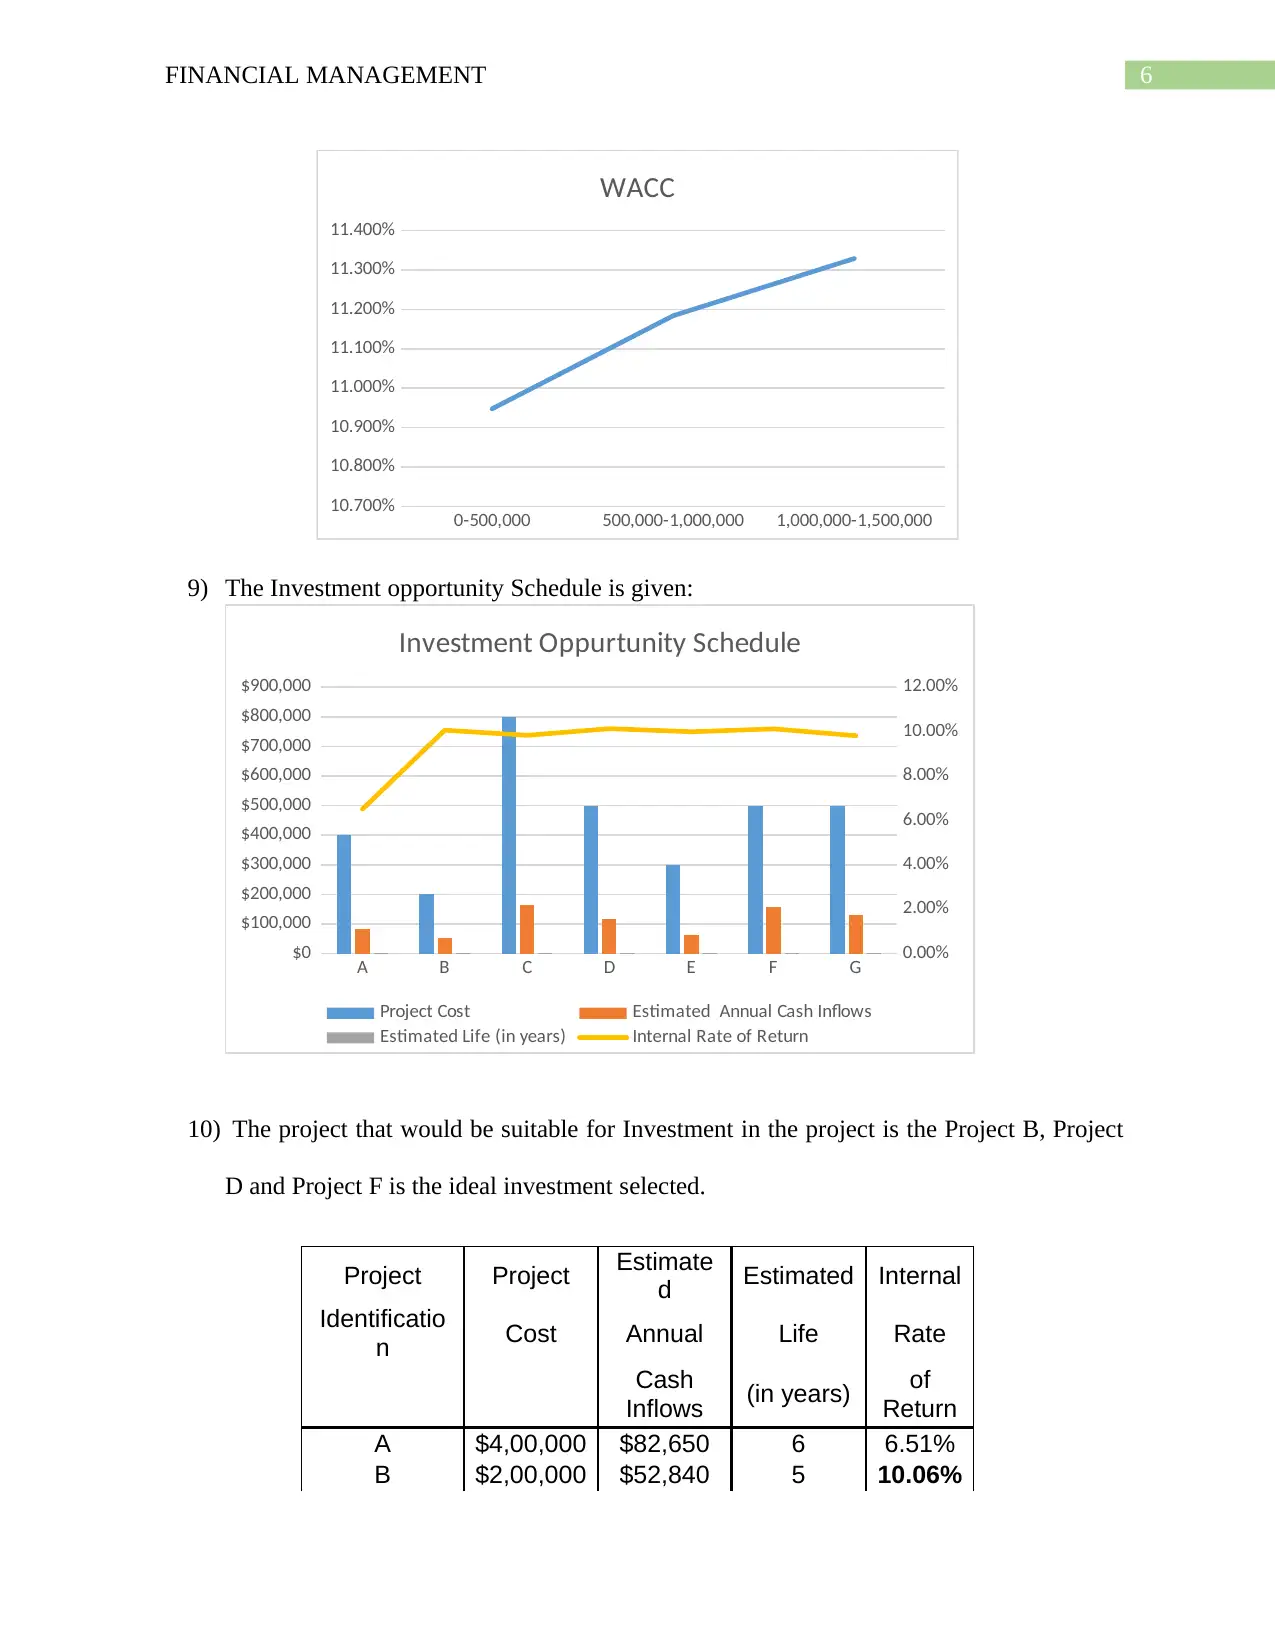
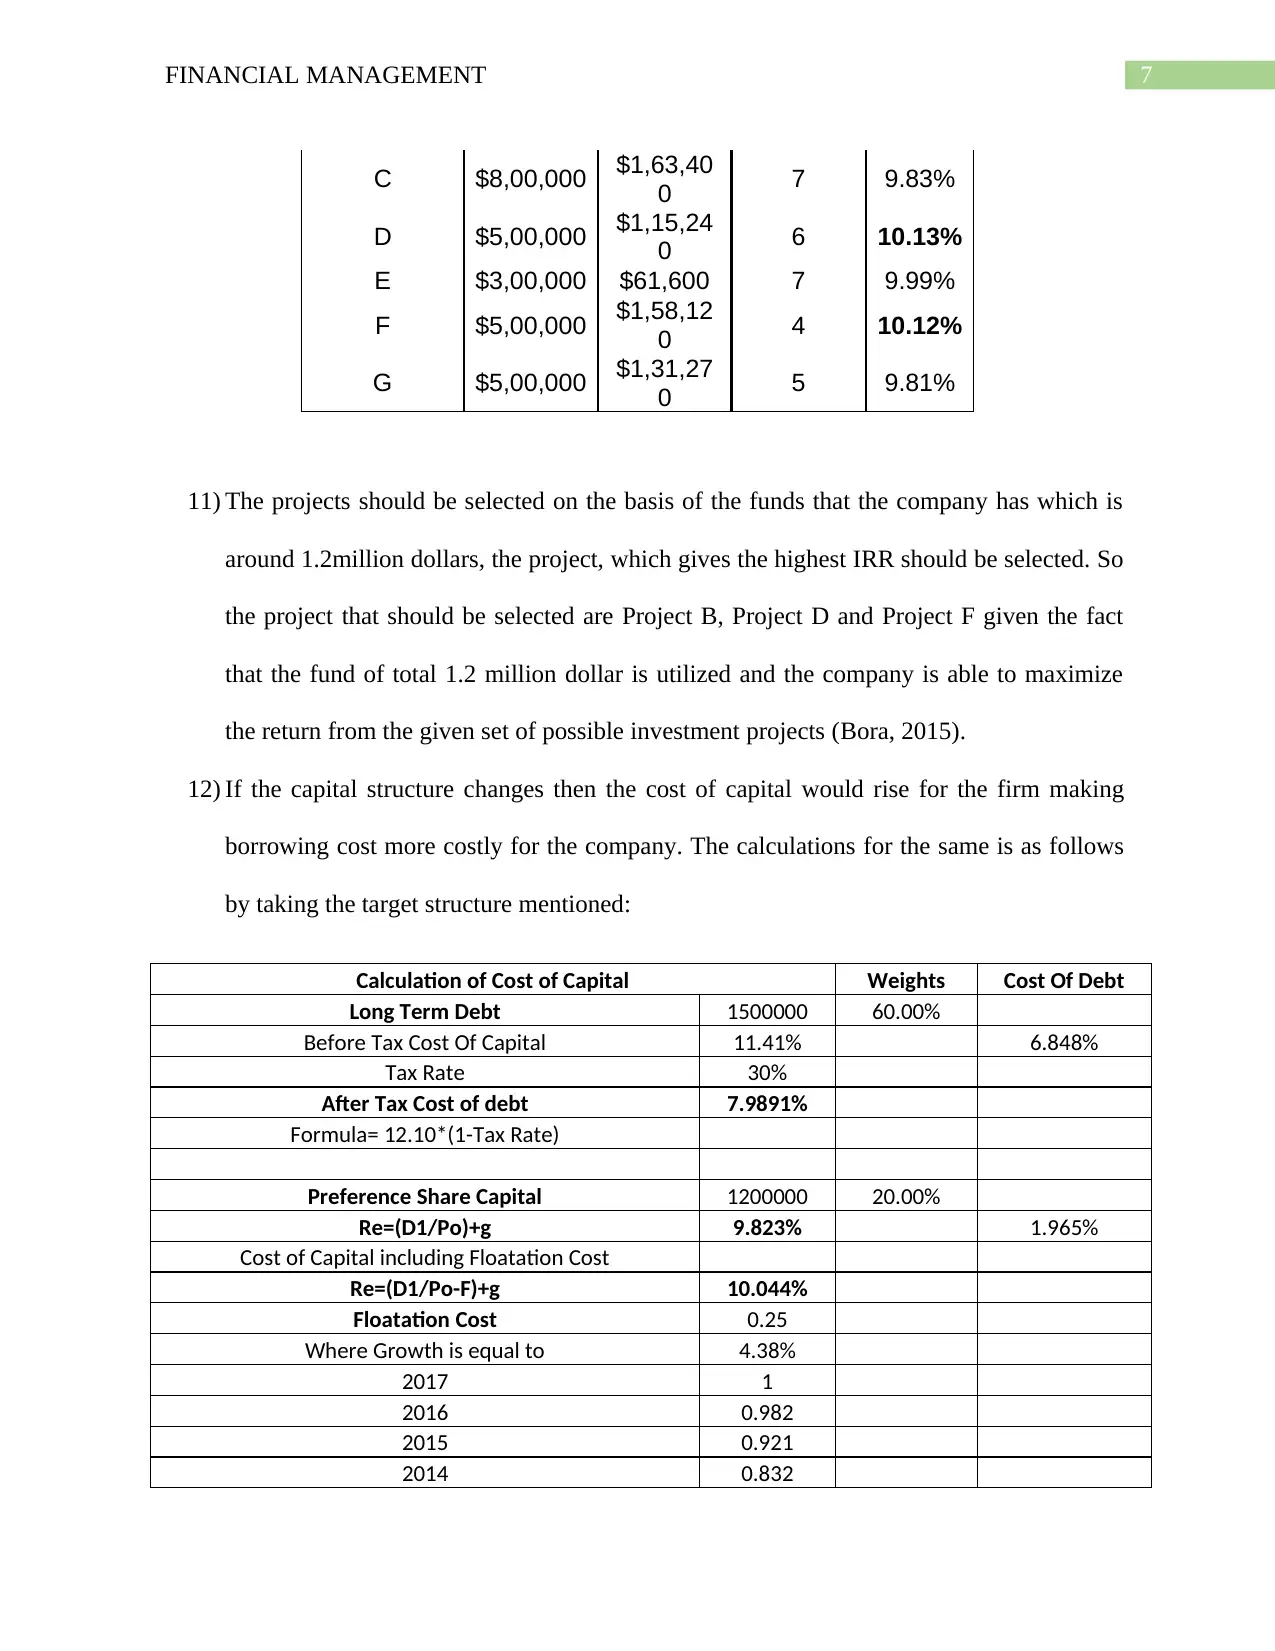
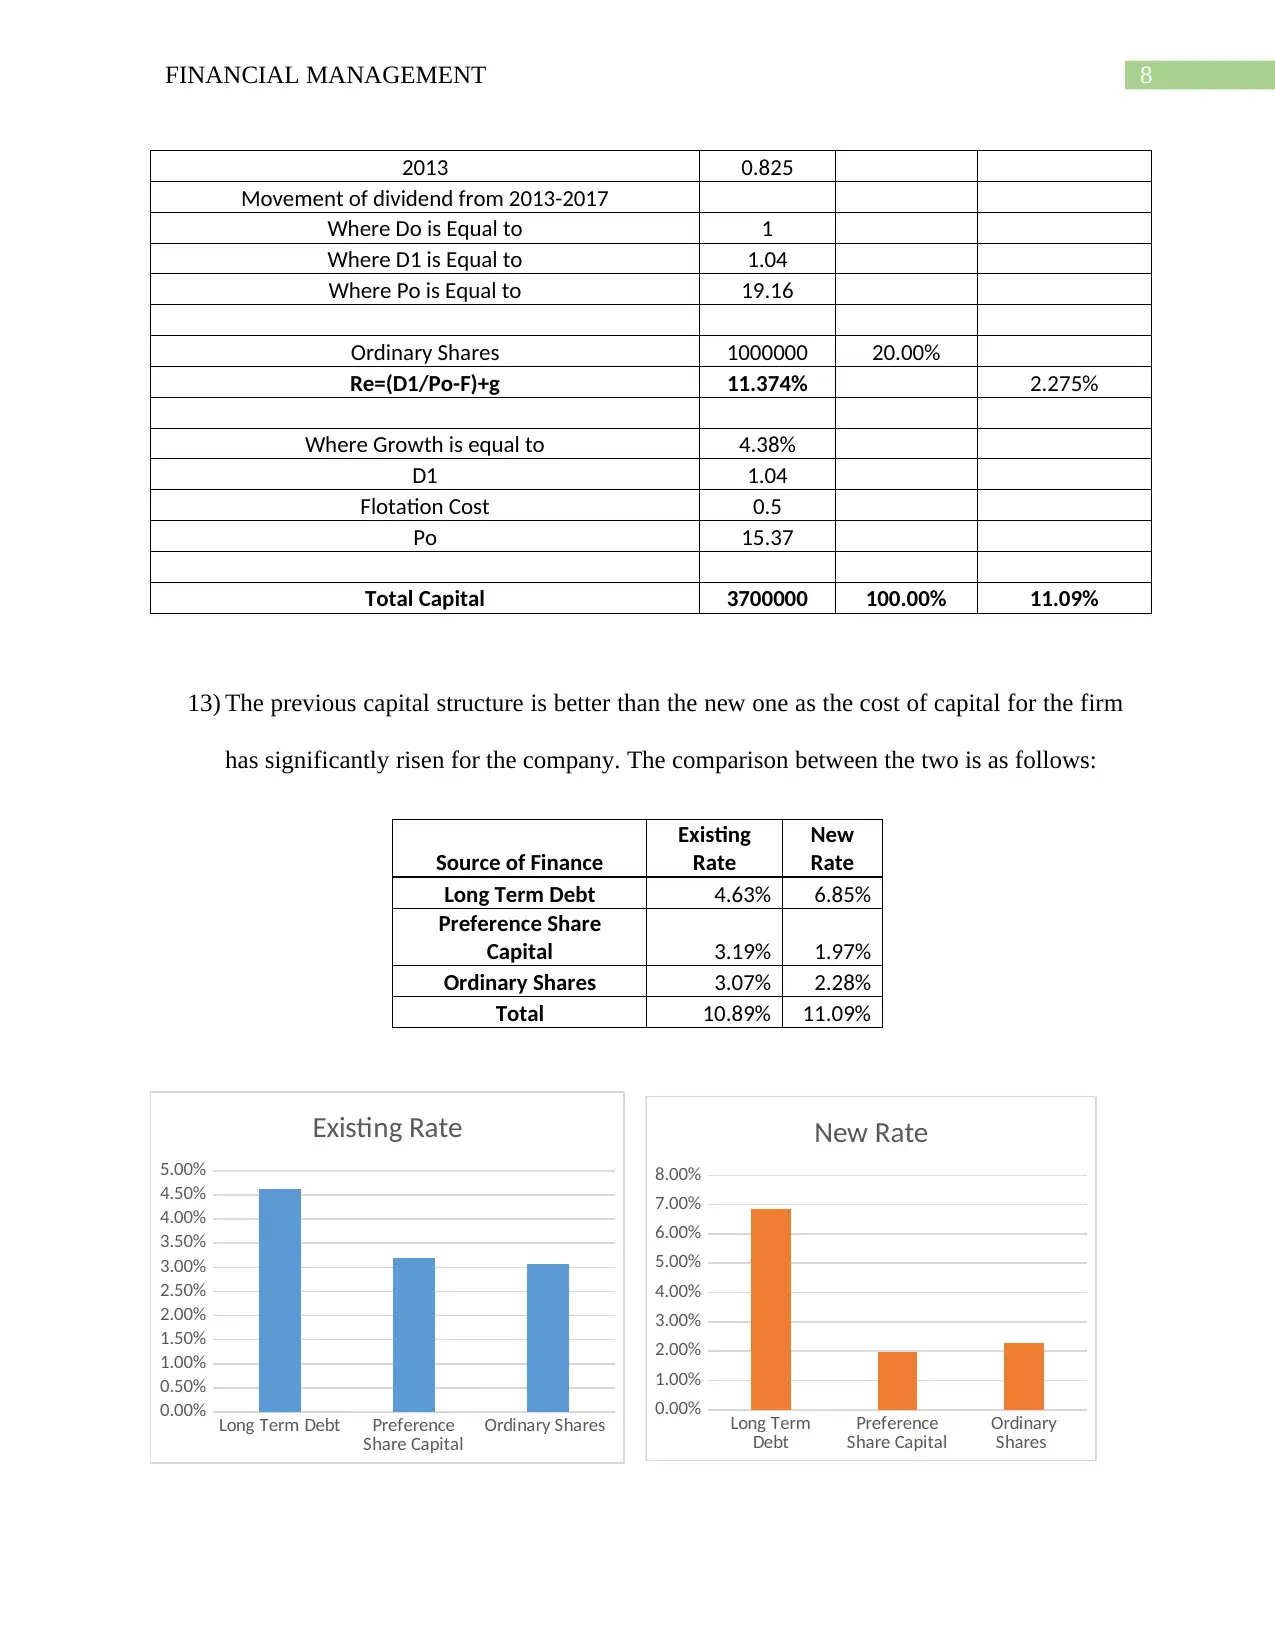
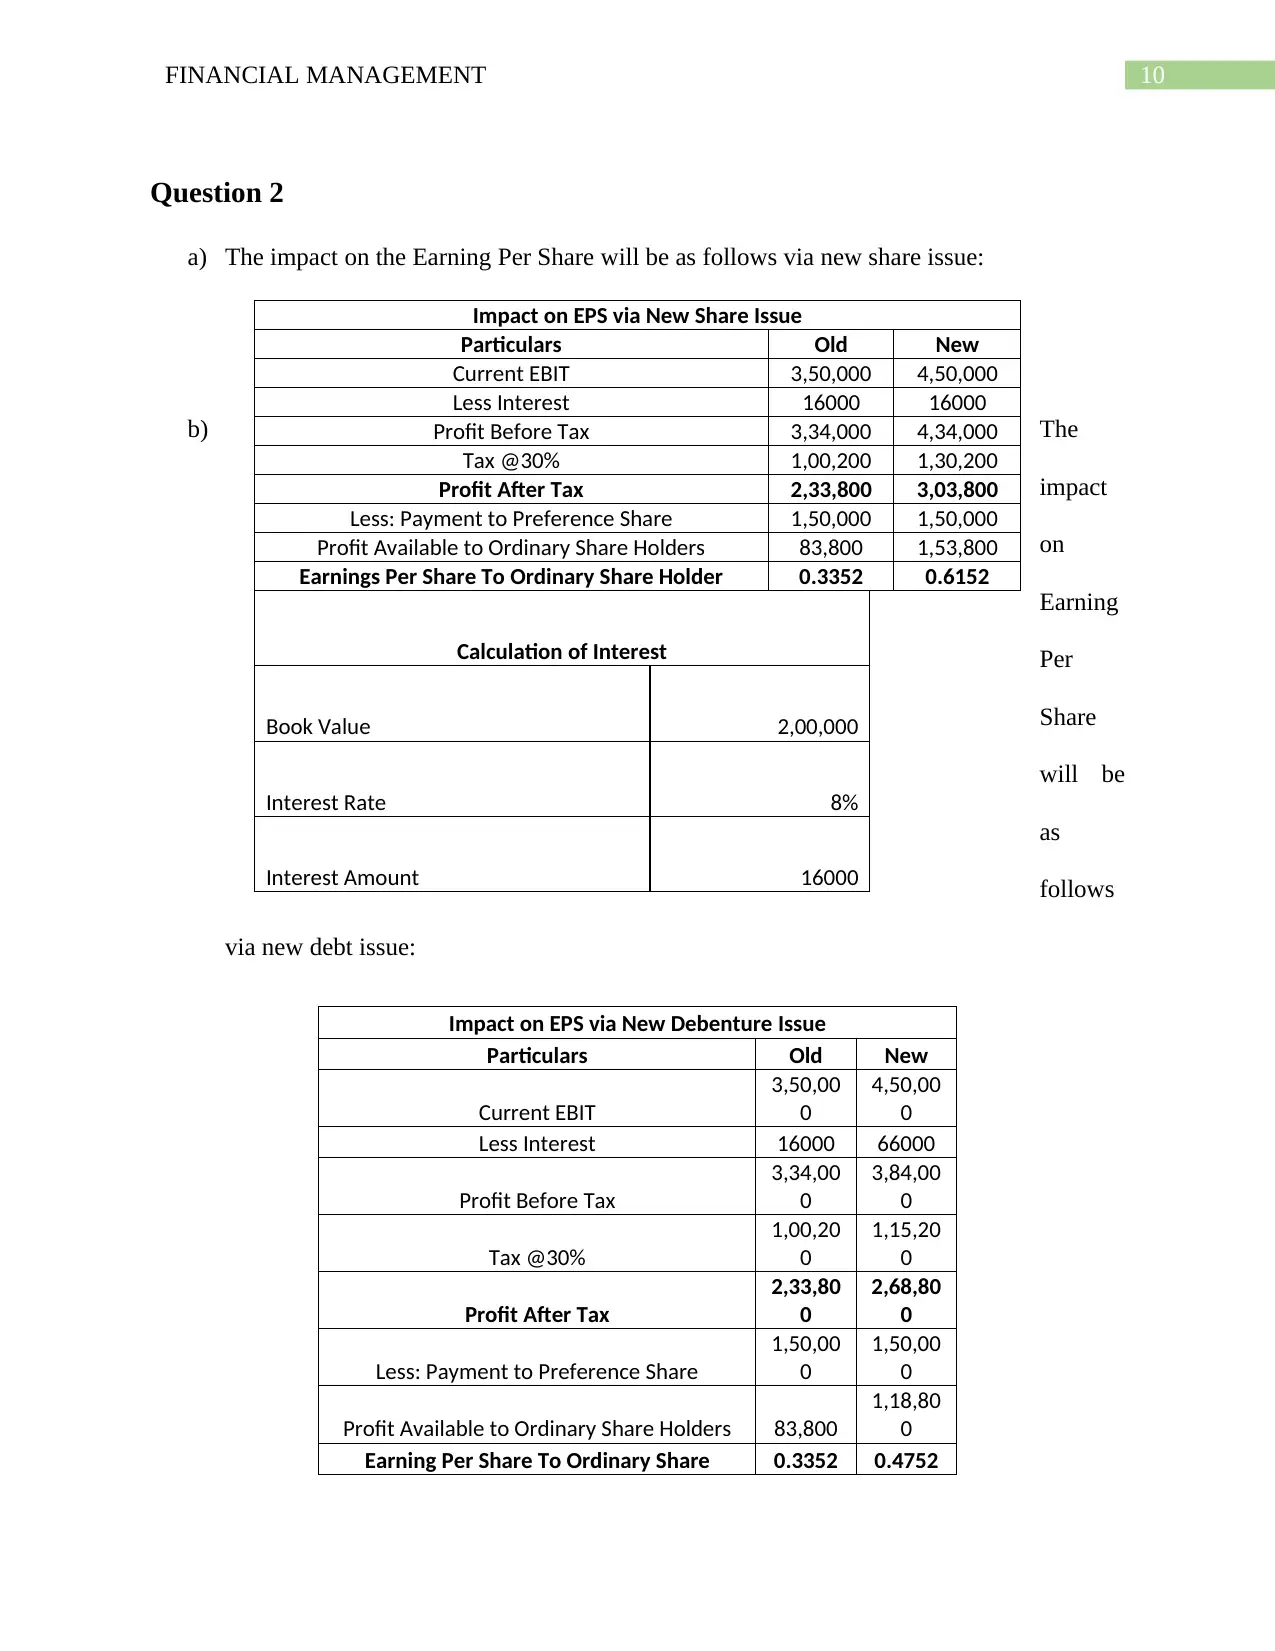
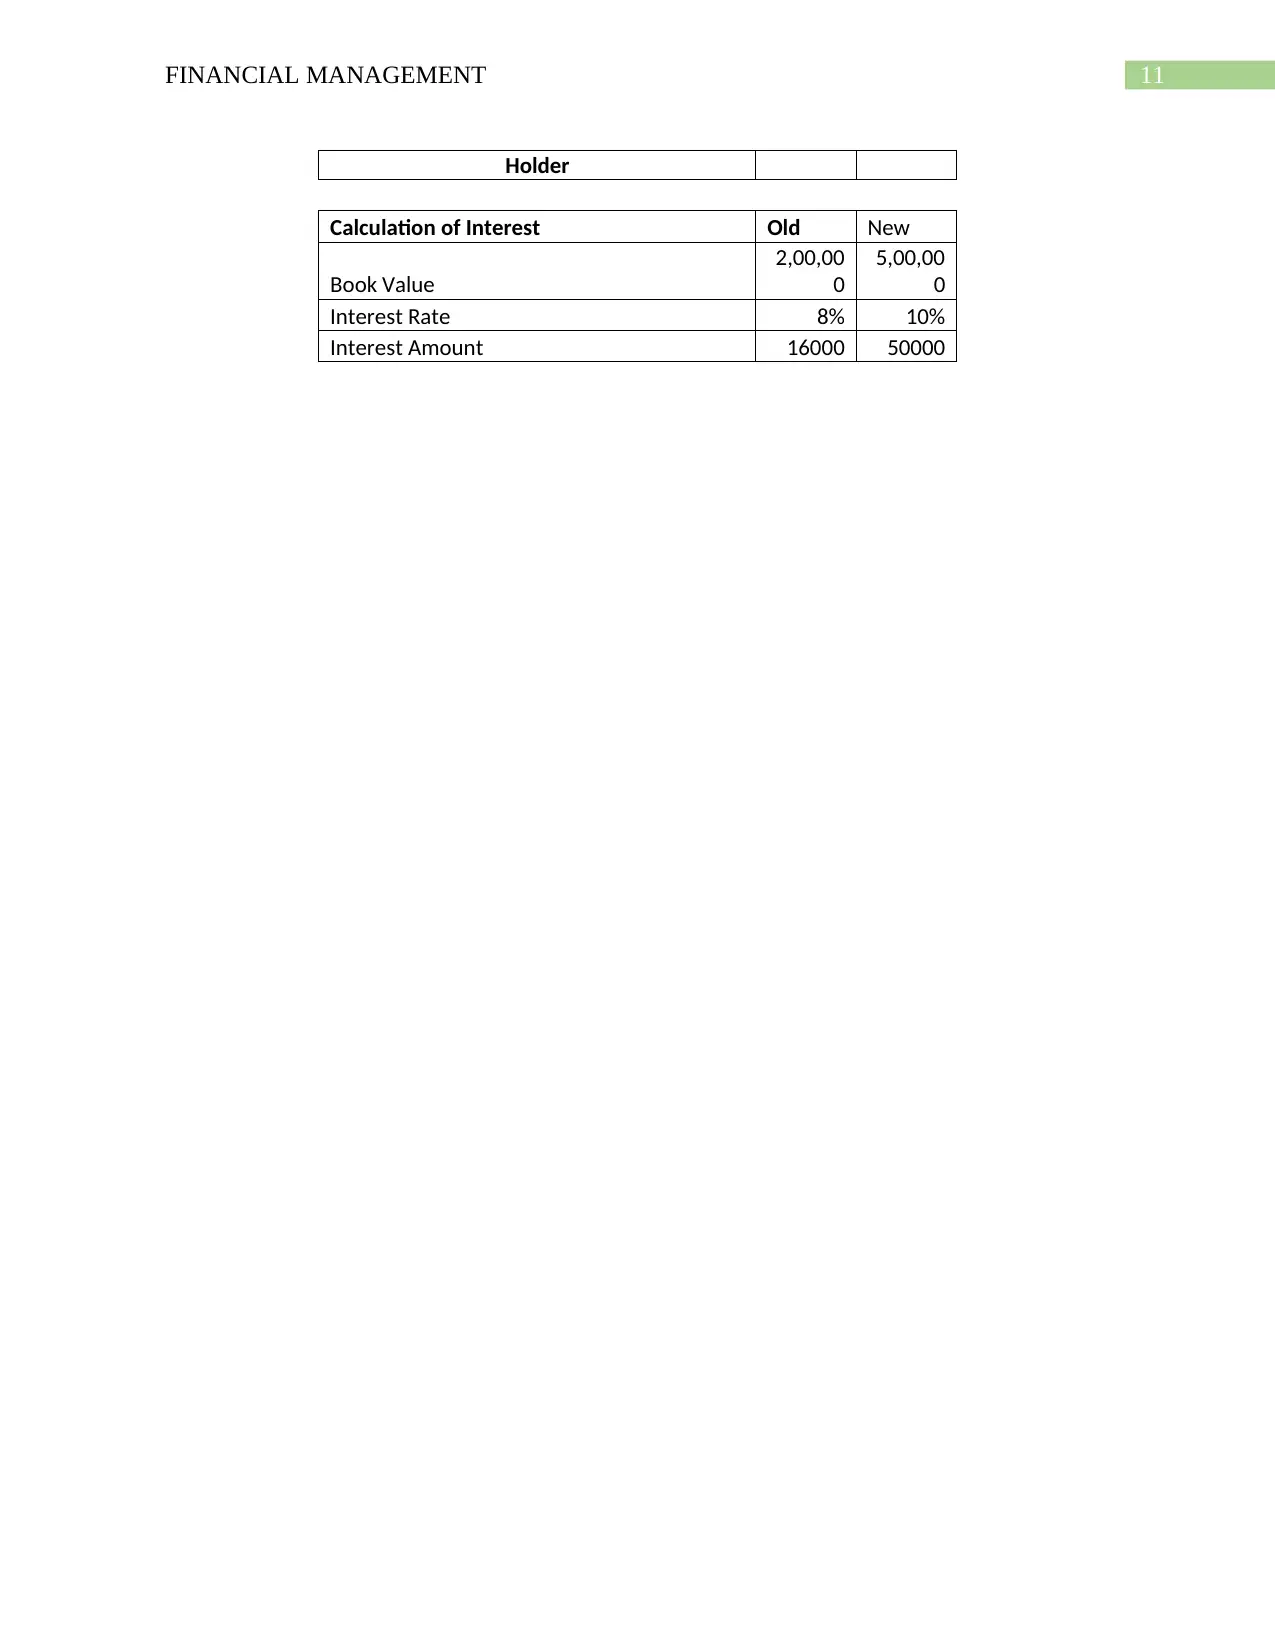
This financial management project delves into various corporate finance aspects influencing the cost of capital, including calculations for different sources and methods. It examines equity financing, the treatment of floatation costs, and expense classification. The project analyzes the Highsky Company's capital structure, calculates the cost of equity, debentures, and ordinary shares using methods like CAPM and dividend capitalization. It also explores an alternative growth factor calculation using the IRR method. The project determines the weighted average cost of capital (WACC) across different financing ranges and evaluates an investment opportunity schedule, recommending suitable projects based on IRR and available funds. Finally, it assesses the impact of changes in capital structure on the cost of capital and compares existing and new capital structures. Furthermore, the impact on Earning Per Share (EPS) via new share issue and debt issue under good and poor weather conditions is analyzed. The document concludes with probability analysis in different scenarios.
Document Page
Running head: FINANCIAL MANAGEMENT
Financial Management
Name of the Student:
Name of the University:
Author’s Note:
tabler-icon-diamond-filled.svg

Paraphrase This Document

Need a fresh take? Get an instant paraphrase of this document with our AI Paraphraser
Document Page
1FINANCIAL MANAGEMENT
Executive Summary
The aim of the project is to understand about the various aspects of the financial management.
The project aims at various kinds of corporate finance factors that influences the cost of capital.
The project aims at calculation of different sources and way of calculating cost of capital. The
different equity financing and the treatment of floatation cost is shown in the assignment. The
project aims at also classifying expenses at the various categories.
Document Page
2FINANCIAL MANAGEMENT
Table of Contents
Question 1........................................................................................................................................3
Question 2......................................................................................................................................10
Question 3......................................................................................................................................11
Reference.......................................................................................................................................13
Document Page
3FINANCIAL MANAGEMENT
Question 1
1) The existing market value capital structure of the Highsky Company:
Capital Structure Of the Company
Particulars Amount
Debentures 1,500,000
Equity 2,800,000
Debt/Equity 0.536
Table 1: Capital Structure of the Company
2) The floatation cost is the cost spent by the company when the company offers shares or
securities in the market to the public. Floatation cost arises from services like the
underwriting expenses or fees, legality charges, and the registration fees incurred while
offering a security (Gupta, 2016). Floatation costs are generally not included in the
incorporation for determining the cost for capital. The company adjusts the floating costs
in the cash flows as the expenses incurred for raising the capital for the company. For
Example, A company, which wants to raise $ 5 million worth of capital it then has to
incur the around 1% of the total capital raised as floating charge. So the net amount
raised by the firm will be 99% of the $ 5 million worth of capital (Gupta, Prakash, &
Rangan, 2018).
3) The cost of Equity is calculated for Equity, Debentures and Ordinary Shares.
Calculation of Cost of Capital
Long Term Debt 500000
Before Tax Cost Of Capital 11.41%
Tax Rate 30%
After Tax Cost of debt
7.9891
%
Formula= 12.10*(1-Tax Rate)
Preference Share Capital 120000
tabler-icon-diamond-filled.svg

Paraphrase This Document

Need a fresh take? Get an instant paraphrase of this document with our AI Paraphraser
Document Page
4FINANCIAL MANAGEMENT
0
Re=(D1/Po)+g 9.823%
Cost of Capital including Floatation Cost
Re=(D1/Po-F)+g
10.044
%
Floatation Cost 0.25
Where Growth is equal to 4.38%
2017 1
2016 0.982
2015 0.921
2014 0.832
2013 0.825
Movement of dividend from 2013-2017
Where Do is Equal to 1
Where D1 is Equal to 1.04
Where Po is Equal to 19.16
Ordinary Shares
Re=(D1/Po-F)+g
11.374
%
Where Growth is equal to 4.38%
D1 1.04
Flotation Cost 0.5
Po 15.37
4) The various method for calculating cost of capital is the Capital Asset Pricing Model and
through Dividend Capitalization Method. The CAPM model is calculated by the formula:
Expected Return = {Risk Free Rate of Return (Rf) + (Return on Market-Risk Free Rate
of Return)*Beta (B)}
The following approach of calculating the cost of capital considers risk involved in the
market with respect to the risk free investment (Barberis et al. 2015).
Whereas the Dividend Capitalization Method was the other method that was selected for
calculating the cost of equity via the formula Re= {((Do+g)/Po) + Growth} (Hirtle et al.
2016).
Document Page
5FINANCIAL MANAGEMENT
5) An alternative way of calculation of the growth factor that is to be used in the dividend
growth factor is by calculating the growth of dividends in the form of IRR method in the
excel sheet (Lugert, et al .2016). The growth can be calculated by the following method
under the divided growth model as:
Growth = {(Dividend at Initial Year/Price at the Initial Year)-Required Rate of Return}
6) And 7)
Calculation of Weighted Average Cost of Capital
Finance Amount Source Weights Cost Weight*Cost
0-500,000 Debt 33.94% 11.41% 3.873%
Preference Share 32.98% 10.04% 3.313%
Equity Share 33.08% 11.37% 3.763%
Weighted Average Cost of Capital 10.948%
500,000-1,000,000 Source Weights Cost Weight*Cost
Debt 33.94% 12.11% 4.110%
Preference Share 32.98% 10.04% 3.313%
Equity Share 33.08% 11.37% 3.761%
Weighted Average Cost of Capital 11.184%
1,000,000-1,500,000 Source Weights Cost Weight*Cost
Debt 33.94% 12.11% 4.110%
Preference Share 32.98% 10.04% 3.313%
Equity Share 33.08% 11.81% 3.906%
Weighted Average Cost of Capital 11.329%
Breaking Point Ordinary Share 36,38,569
Breaking Point Debt 14,73,188
Breaking Point Preference
Share No change
8) Calculation Of WACC
Range of Total New
Financing WACC
0-500,000 10.948%
Document Page
6FINANCIAL MANAGEMENT
500,000-1,000,000 11.184%
1,000,000-1,500,000 11.329%
9) The Investment opportunity Schedule is given:
A B C D E F G
$0
$100,000
$200,000
$300,000
$400,000
$500,000
$600,000
$700,000
$800,000
$900,000
0.00%
2.00%
4.00%
6.00%
8.00%
10.00%
12.00%
Investment Oppurtunity Schedule
Project Cost Estimated Annual Cash Inflows
Estimated Life (in years) Internal Rate of Return
10) The project that would be suitable for Investment in the project is the Project B, Project
D and Project F is the ideal investment selected.
Project Project Estimate
d Estimated Internal
Identificatio
n Cost Annual Life Rate
Cash
Inflows (in years) of
Return
A $4,00,000 $82,650 6 6.51%
B $2,00,000 $52,840 5 10.06%
0-500,000 500,000-1,000,000 1,000,000-1,500,000
10.700%
10.800%
10.900%
11.000%
11.100%
11.200%
11.300%
11.400%
WACC
tabler-icon-diamond-filled.svg

Paraphrase This Document

Need a fresh take? Get an instant paraphrase of this document with our AI Paraphraser
Document Page
7FINANCIAL MANAGEMENT
C $8,00,000 $1,63,40
0 7 9.83%
D $5,00,000 $1,15,24
0 6 10.13%
E $3,00,000 $61,600 7 9.99%
F $5,00,000 $1,58,12
0 4 10.12%
G $5,00,000 $1,31,27
0 5 9.81%
11) The projects should be selected on the basis of the funds that the company has which is
around 1.2million dollars, the project, which gives the highest IRR should be selected. So
the project that should be selected are Project B, Project D and Project F given the fact
that the fund of total 1.2 million dollar is utilized and the company is able to maximize
the return from the given set of possible investment projects (Bora, 2015).
12) If the capital structure changes then the cost of capital would rise for the firm making
borrowing cost more costly for the company. The calculations for the same is as follows
by taking the target structure mentioned:
Calculation of Cost of Capital Weights Cost Of Debt
Long Term Debt 1500000 60.00%
Before Tax Cost Of Capital 11.41% 6.848%
Tax Rate 30%
After Tax Cost of debt 7.9891%
Formula= 12.10*(1-Tax Rate)
Preference Share Capital 1200000 20.00%
Re=(D1/Po)+g 9.823% 1.965%
Cost of Capital including Floatation Cost
Re=(D1/Po-F)+g 10.044%
Floatation Cost 0.25
Where Growth is equal to 4.38%
2017 1
2016 0.982
2015 0.921
2014 0.832
Document Page
8FINANCIAL MANAGEMENT
2013 0.825
Movement of dividend from 2013-2017
Where Do is Equal to 1
Where D1 is Equal to 1.04
Where Po is Equal to 19.16
Ordinary Shares 1000000 20.00%
Re=(D1/Po-F)+g 11.374% 2.275%
Where Growth is equal to 4.38%
D1 1.04
Flotation Cost 0.5
Po 15.37
Total Capital 3700000 100.00% 11.09%
13) The previous capital structure is better than the new one as the cost of capital for the firm
has significantly risen for the company. The comparison between the two is as follows:
Source of Finance
Existing
Rate
New
Rate
Long Term Debt 4.63% 6.85%
Preference Share
Capital 3.19% 1.97%
Ordinary Shares 3.07% 2.28%
Total 10.89% 11.09%
Long Term Debt Preference
Share Capital Ordinary Shares
0.00%
0.50%
1.00%
1.50%
2.00%
2.50%
3.00%
3.50%
4.00%
4.50%
5.00%
Existing Rate
Long Term
Debt Preference
Share Capital Ordinary
Shares
0.00%
1.00%
2.00%
3.00%
4.00%
5.00%
6.00%
7.00%
8.00%
New Rate
Document Page
9FINANCIAL MANAGEMENT
tabler-icon-diamond-filled.svg

Paraphrase This Document

Need a fresh take? Get an instant paraphrase of this document with our AI Paraphraser
Document Page
10FINANCIAL MANAGEMENT
Question 2
a) The impact on the Earning Per Share will be as follows via new share issue:
b) The
impact
on
Earning
Per
Share
will be
as
follows
via new debt issue:
Impact on EPS via New Debenture Issue
Particulars Old New
Current EBIT
3,50,00
0
4,50,00
0
Less Interest 16000 66000
Profit Before Tax
3,34,00
0
3,84,00
0
Tax @30%
1,00,20
0
1,15,20
0
Profit After Tax
2,33,80
0
2,68,80
0
Less: Payment to Preference Share
1,50,00
0
1,50,00
0
Profit Available to Ordinary Share Holders 83,800
1,18,80
0
Earning Per Share To Ordinary Share 0.3352 0.4752
Impact on EPS via New Share Issue
Particulars Old New
Current EBIT 3,50,000 4,50,000
Less Interest 16000 16000
Profit Before Tax 3,34,000 4,34,000
Tax @30% 1,00,200 1,30,200
Profit After Tax 2,33,800 3,03,800
Less: Payment to Preference Share 1,50,000 1,50,000
Profit Available to Ordinary Share Holders 83,800 1,53,800
Earnings Per Share To Ordinary Share Holder 0.3352 0.6152
Calculation of Interest
Book Value 2,00,000
Interest Rate 8%
Interest Amount 16000
Document Page
11FINANCIAL MANAGEMENT
Holder
Calculation of Interest Old New
Book Value
2,00,00
0
5,00,00
0
Interest Rate 8% 10%
Interest Amount 16000 50000
chevron_up_icon
1 out of 16
circle_padding
hide_on_mobile
zoom_out_icon
[object Object]