CVP Analysis and Cash Budget: Managing Financial Resources

Verified

Added on  2023/02/03

|16
|901
|81
Presentation
AI Summary
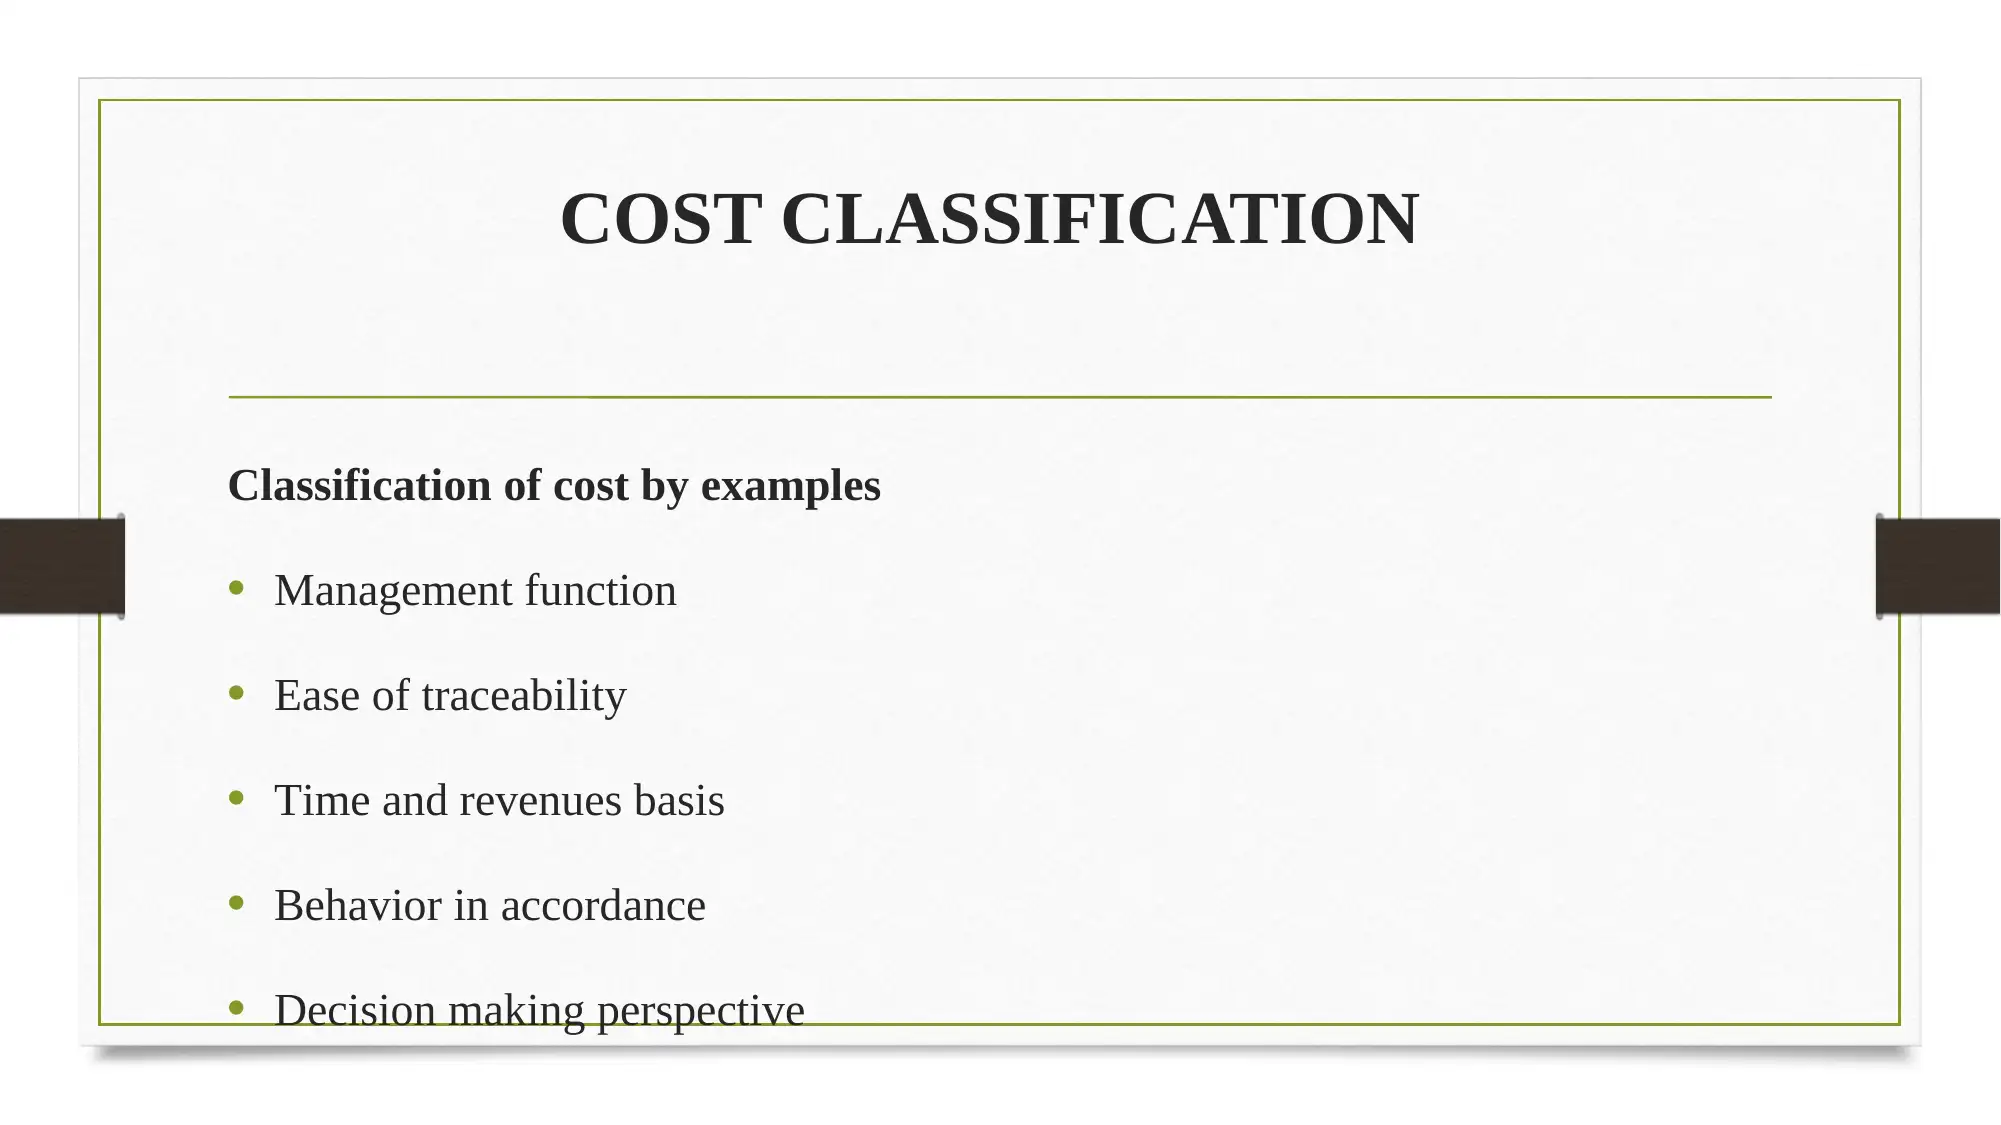
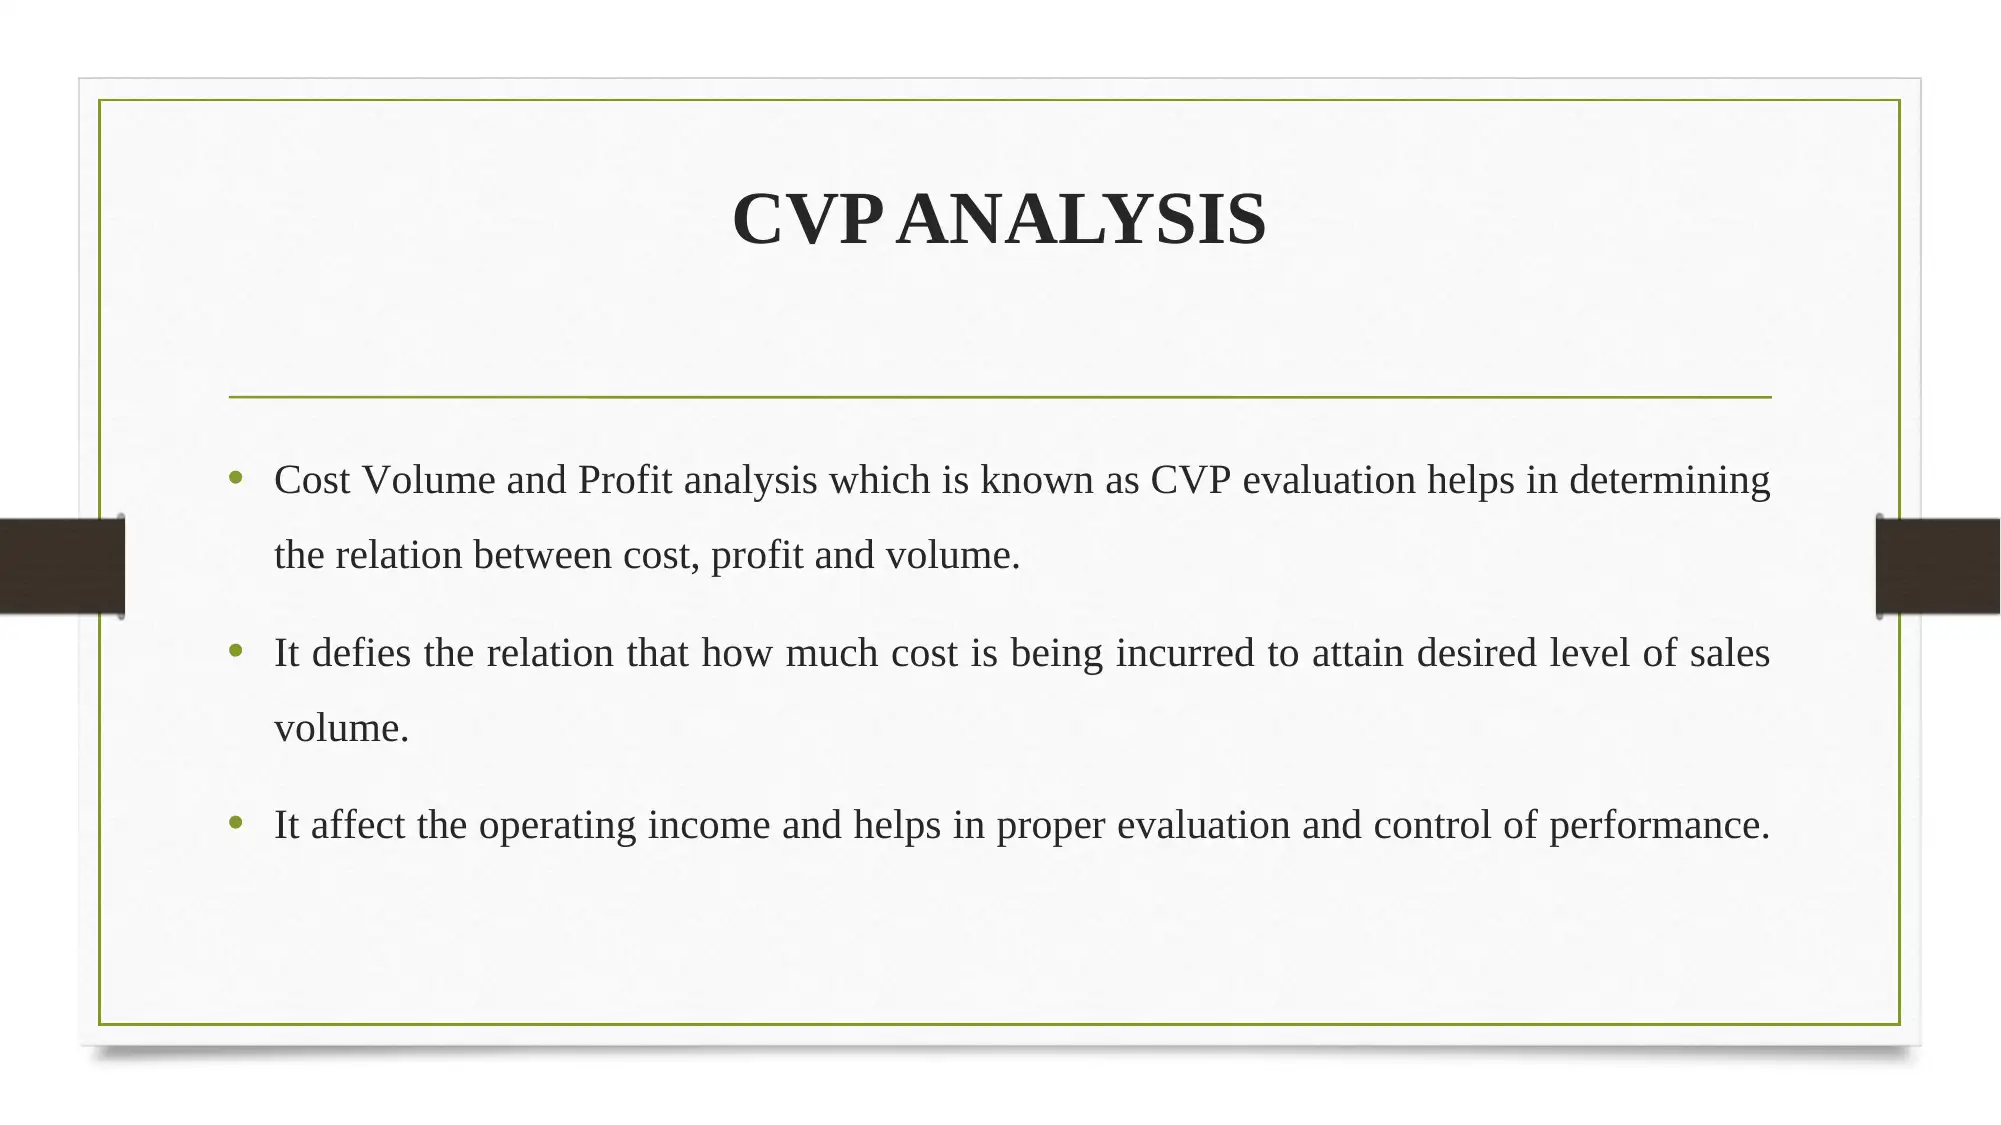
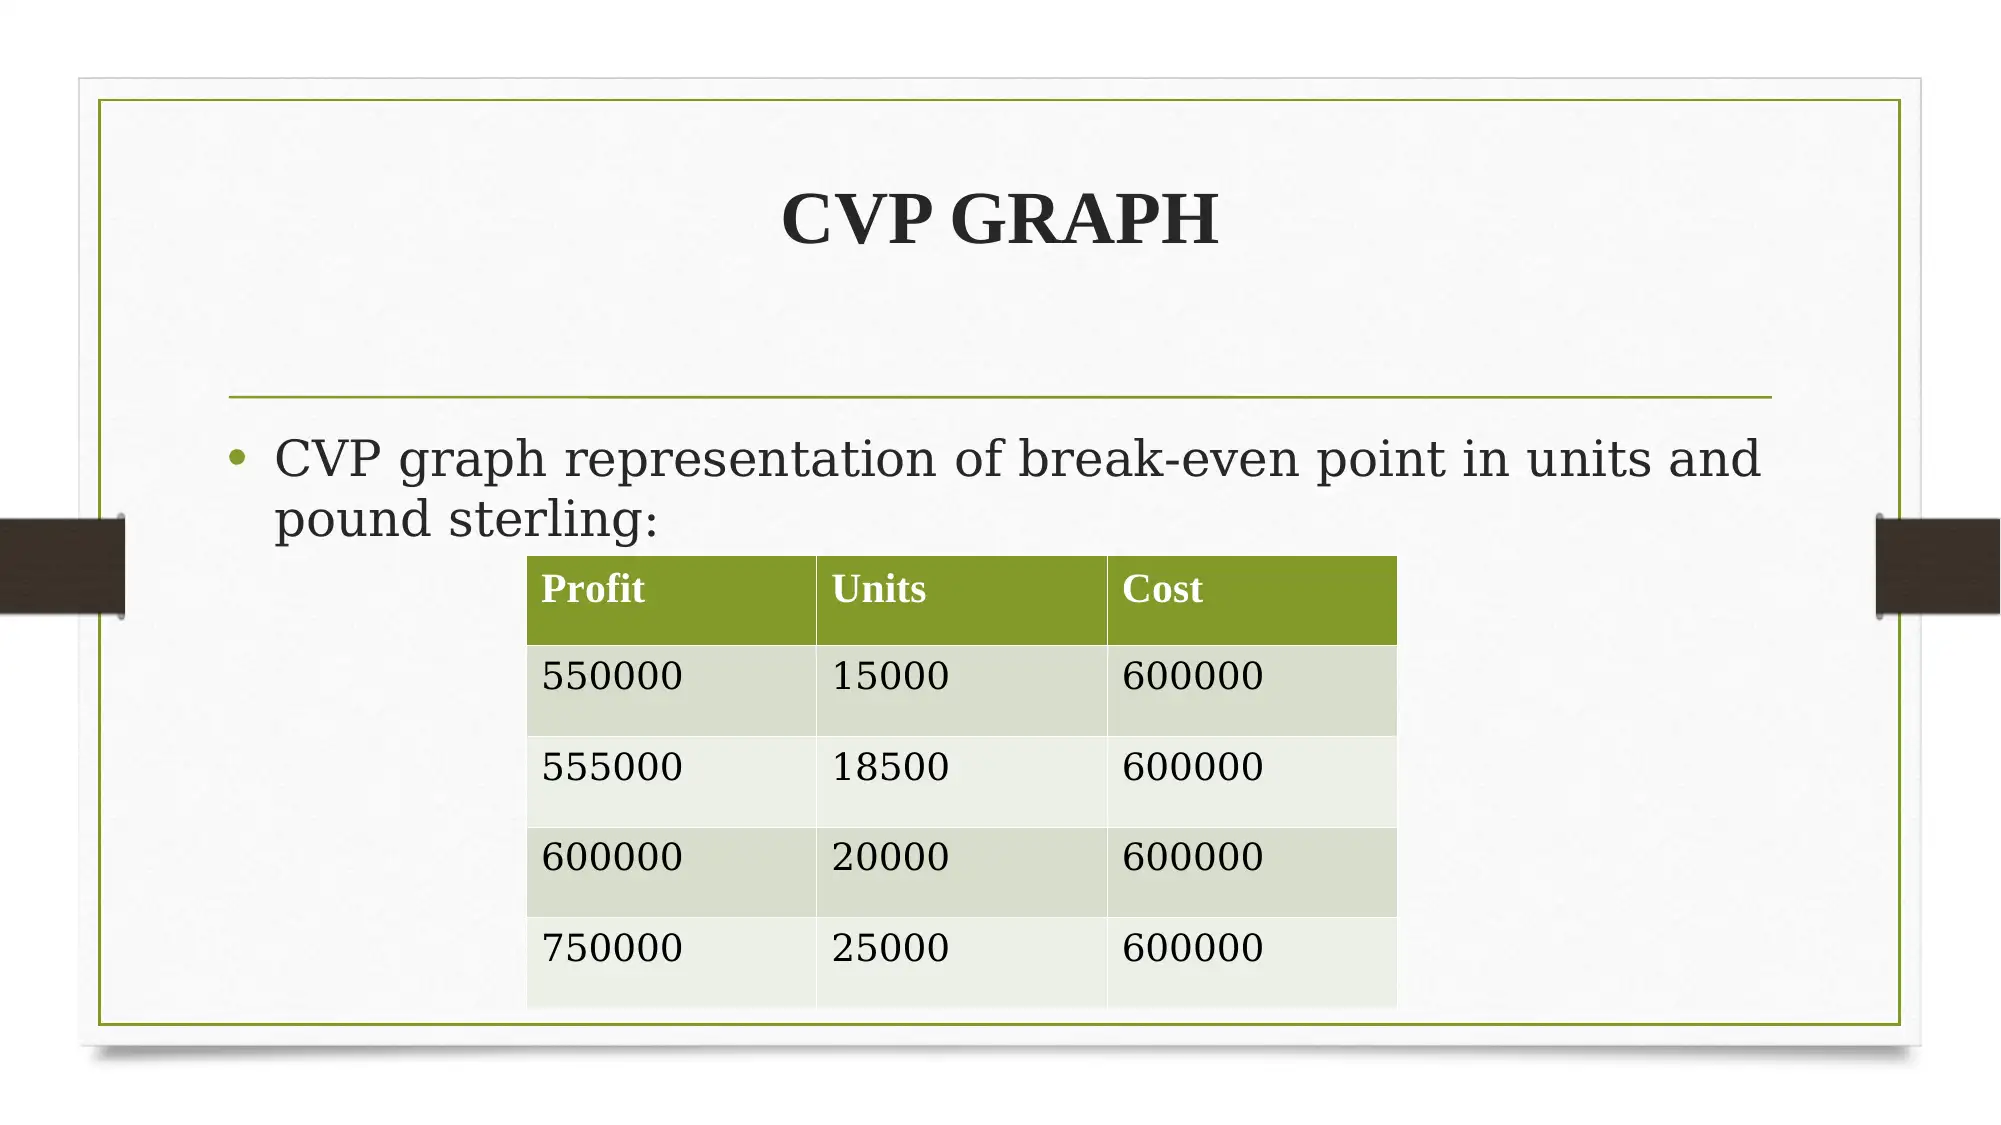
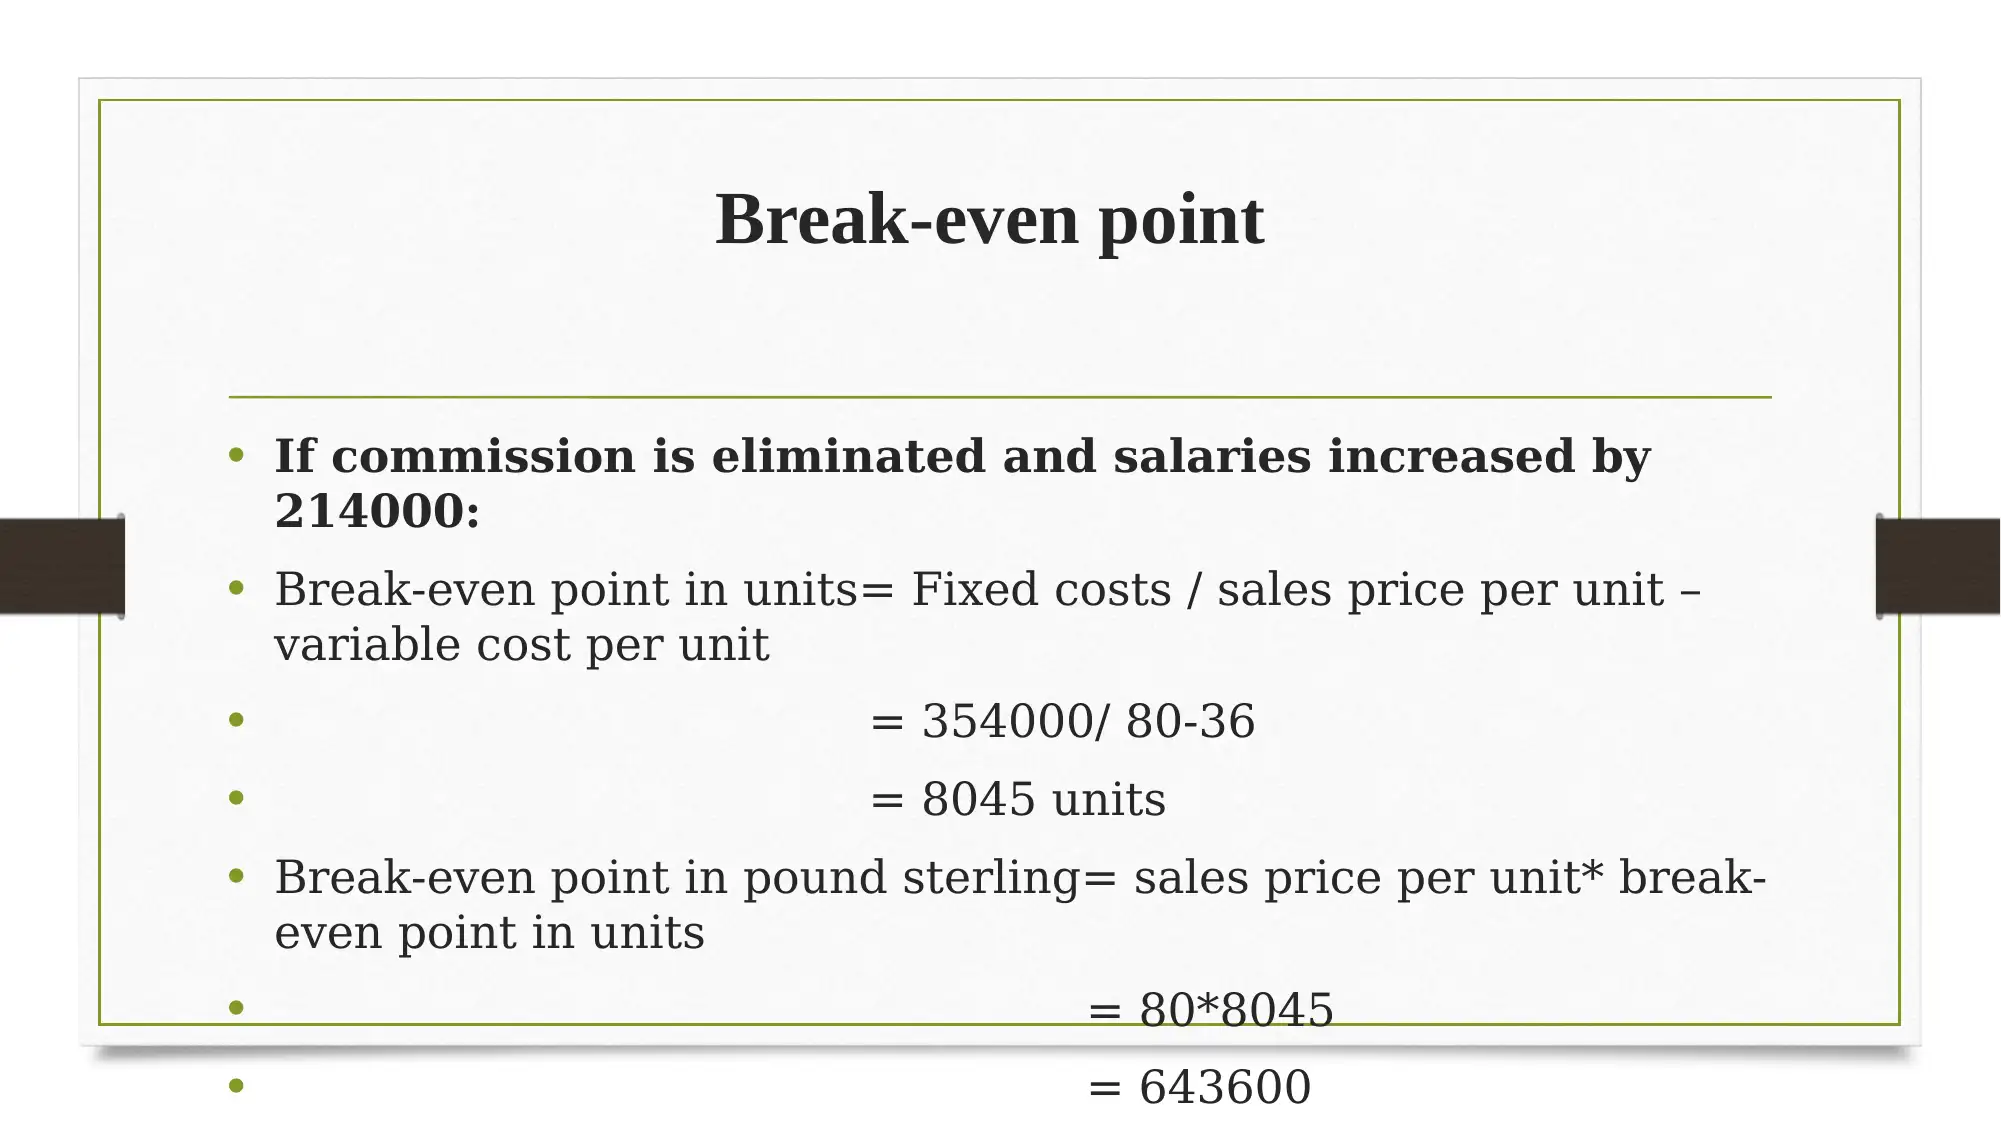
This presentation provides a comprehensive overview of managing financial resources, focusing on Cost-Volume-Profit (CVP) analysis and cash budgeting. It begins by classifying costs based on management function, traceability, time, and behavior. The presentation then delves into CVP analysis, explaining its role in determining the relationship between cost, profit, and volume, including break-even analysis in units and pound sterling, and a CVP graph. The analysis extends to calculating operating income or loss under different scenarios, such as changes in commission expenses. The presentation also includes a detailed cash budget for January, February, and March, outlining cash sales, collections from credit sales, payments for credit purchases, operating costs, and vehicle payments, with supporting working notes for credit sales and purchases. The conclusion summarizes the concepts of CVP analysis and the practical implications of cash budgeting, supported by relevant references. This presentation aims to equip the audience with the knowledge to make effective financial decisions.
tabler-icon-diamond-filled.svg

Contribute Materials

Your contribution can guide someone’s learning journey. Share your documents today.
Document Page
MANAGING FINANCIAL
RESOURCES
tabler-icon-diamond-filled.svg

Secure Best Marks with AI Grader

Need help grading? Try our AI Grader for instant feedback on your assignments.
Document Page
INTRODUCTION
This presentation is based upon analysis of CVP analysis and application of cash Budget.
Cost volume and profit analysis and cash budget is prepared to make effective decision
making.
The main objective of this report is to understood the importance of different accounting
terms in the process of effective management of financial resources.
Document Page
COST CLASSIFICATION
Classification of cost by examples
Management function
Ease of traceability
Time and revenues basis
Behavior in accordance
Decision making perspective
Document Page
CVP ANALYSIS
Cost Volume and Profit analysis which is known as CVP evaluation helps in determining
the relation between cost, profit and volume.
It defies the relation that how much cost is being incurred to attain desired level of sales
volume.
It affect the operating income and helps in proper evaluation and control of performance.
tabler-icon-diamond-filled.svg

Secure Best Marks with AI Grader

Need help grading? Try our AI Grader for instant feedback on your assignments.
Document Page
Break even analysis
Total fixed expenses = 600,000
Break-even point in units= Fixed costs / sales price per unit
– variable cost per unit
= 600,000 / 80-50
= 20000 units
Break-even point in pound sterling= sales price per unit*
break-even point in units
= 80*20000
=1600000
Document Page
CVP GRAPH
CVP graph representation of break-even point in units and
pound sterling:
Profit Units Cost
550000 15000 600000
555000 18500 600000
600000 20000 600000
750000 25000 600000
Document Page
CONTINUE…
1 2 3 4
0
100000
200000
300000
400000
500000
600000
700000
800000
550000 555000 600000
750000
15000 18500 20000 25000
600000 600000 600000 600000
Break even chart
profit
units
cost
Linear (cost)
break even units
co n trib u tio n
tabler-icon-diamond-filled.svg

Paraphrase This Document

Need a fresh take? Get an instant paraphrase of this document with our AI Paraphraser
Document Page
Operating loss or income for 18500
units
Net operating income or loss:
Number of units= 18,500
Particulars Amount
Sales (80*18,500) 1480000
-Variable cost (50*18500) 925000
Contribution margin 555000
(Fixed cost) 600000
Net operating loss -45000
Document Page
Calculation after additional commission £6
Break-even point if commission expenses rises to 20
Break-even point in units= Fixed costs / sales price per unit
– variable cost per unit
= 600000 / 80-56
= 25000 units
Break-even point in pound sterling= sales price per unit*
break-even point in units
= 80*25000
= 2000000
Document Page
Net operating income or loss if total commission
is 20 and units increased to 23500
Particulars Amount
Sales (80*23,500) 1880000
-Variable cost (56*23,500) 1316000
Contribution margin 564000
(Fixed cost) 600000
Net operating loss -36000
tabler-icon-diamond-filled.svg

Secure Best Marks with AI Grader

Need help grading? Try our AI Grader for instant feedback on your assignments.
Document Page
Break-even point
If commission is eliminated and salaries increased by
214000:
Break-even point in units= Fixed costs / sales price per unit –
variable cost per unit
= 354000/ 80-36
= 8045 units
Break-even point in pound sterling= sales price per unit* break-
even point in units
= 80*8045
= 643600
Document Page
CASH BUDGET
Particular January February March
Receipts
Balance b/d 25 98 44
Cash Sales 75 80 90
Collection from credit sales 300 285 282
Total (a) 400 463 416
Payment
Payment for credit purchase 180 196 200
Operating cost 122 123 123
Payment for vehicle - 100 -
Total (b) 302 419 323
closing balance 98 44 93
Document Page
WORKING NOTES
Credit Sales
January – 75% value of December+ 15% value of November + 10% value of October
= 300*75% + 300*15% + 300*10%
= 225 + 45 + 30 = 300
February - 75% value of January + 15% value of December + 10% value of November
= 280*75% + 300*15% + 300*10%
= 210 + 45 + 30 = 285
March - 75% value of February + 15% value of January + 10% value of December
= 280*75% + 280*15% + 300*10%
= 210 + 42 + 30 = 282
tabler-icon-diamond-filled.svg

Paraphrase This Document

Need a fresh take? Get an instant paraphrase of this document with our AI Paraphraser
Document Page
CONTINUE…
Credit purchase
January – 80% value of December + 20% value of November
= 180*80% + 180*20*
= 144 + 36 = 180
February - 80% value of January + 20% value of December
= 200*80% + 180*20%
= 160 + 36 = 196
March - 80% value of February + 20% value of January
= 200*80% + 200*20%
= 160 + 40 = 200
Document Page
CONCLUSION
The presentation summarized the concept of CVP analysis and classify the
cost in various segments.
In part a defines the CVP analysis and part b illustrate the practical
implication of cash budget for three months.
Document Page
REFERENCES
Choo, F. and Tan, K. B., 2011. An Income Statement Teaching Approach for
Cost-Volume-Profit (CVP) Analysis by Using a Company’s CVP Model.
Journal of Accounting and Finance. 11(4). pp.23-36.
Marik, P. E. and Cavallazzi, R., 2013. Does the central venous pressure
predict fluid responsiveness? An updated meta-analysis and a plea for
some common sense. Critical care medicine. 41(7). pp.1774-1781.
chevron_up_icon
1 out of 16
circle_padding
hide_on_mobile
zoom_out_icon
logo.png

Your All-in-One AI-Powered Toolkit for Academic Success.

Available 24*7 on WhatsApp / Email

[object Object]