Financial Management Report: Dura Bike's Financial Strategies
VerifiedAdded on 2023/01/10
|13
|3216
|32
Report
AI Summary
This financial management report analyzes Dura Bike's performance, focusing on the impacts of increased payment periods on the operating and cash conversion cycles. It calculates cash and accounting break-even points, determines the weighted average cost of capital (WACC), and evaluates capital budgeting methodologies such as payback period, net present value (NPV), and internal rate of return (IRR). The report includes a detailed analysis of the company's financial decisions, like focusing on treasury bonds, and discusses the limitations of the analysis. The report provides insights into Dura Bike's financial strategies, offering a comprehensive overview of its financial health and decision-making processes.

Financial Management
Paraphrase This Document
Need a fresh take? Get an instant paraphrase of this document with our AI Paraphraser
Contents
INTRODUCTION.......................................................................................................................................3
MAIN BODY..............................................................................................................................................3
1. Impacts on operating cycle and cash conversation cycle due to increase in the payment period.........3
2. Cash and accounting break even points...............................................................................................4
3. Calculate of weighted average cost of capital......................................................................................5
4. Capital budgeting methodologies........................................................................................................6
5. Reason behind the decision................................................................................................................10
6. Discuss the limitation of the above analysis......................................................................................11
CONCLUSION.........................................................................................................................................12
REFERENCES..........................................................................................................................................13
INTRODUCTION
Financial management concentrates on long-term success, as compared to "tactical"
managerial decisions that contribute to short-term placement. When a corporation is strategic
rather than positional, it just helps make financial choices predicated on what it likes to think will
also inevitably produce things that is in the long term, which indicates that a business often has
to accept failures in the current situation, in order to accomplish these other outcomes
(Bartolacci, Quaranta and Soverchia, 2018). Financial management also visually impaired and
maintaining appropriate, assigning and receiving the assets and liabilities in the balance sheet,
while tracking functional finance products such as investment, sales, receivable and accounts
payable records, working capital and profitability. This report has been based on the Dura bike
which is manufacturing company and set up in New York and due to Covid 19 faces various
problems in regard of revenues. This report involves various topics such as, average collection
period, payback period, NPV, weight age average cost of capital, treasury bonds and many
others.
MAIN BODY
1. Impacts on operating cycle and cash conversation cycle due to increase in the payment period
The average collection period is the amount of days from the day a payment contract is
made until the day the customer receives for that transaction. The average collection time of a
company is reflective of the usefulness of the deferred revenue working strategies in its
transactions. Companies need to be able to maintain their average collection time to make sure
proper functioning. In general, a lower average collection time is much more important than
having account receivable duration.
The operating cycle is the average time needed for an industry to create an original
amount of funds in order to deliver a product, deliver the stock and obtain money from clients in
terms for a product. This is important to estimate the level of working capital a firm would
require to preserve or expand the business. When payment period increase so it impact on the
operating cycle in negative manner and longer payment terms shorten the operating cycle due to
organisation can delay paying out the cash.
⊘ This is a preview!⊘
Do you want full access?
Subscribe today to unlock all pages.
Trusted by 1+ million students worldwide
The cash conversion cycle (CCC) indicates how effectively a firm can turn cash available
into further money on hand. This is achieved by the CCC accompanying the cash when it is first
translated into inventory and accounts paid (AP), into revenue and account receivable (AR), but
instead again into money. When payment period increase so it impact on the this cycle in
negative manner because the company collect payment late that create problem of money and
cycle remain back due to changes. The lower that number, the further productive it is for the
company to demand money from its clients. Increased levels can mean a range of things, the
much more common is that the clients don't pay their bills promptly. A high number, that being
said, can also signify more massive issues or potentials that can adversely influence the economy
(Constantinides, G.M., Czerwonko and Perrakis, 2020). A working capital loan is a loan which is
taken to fund the daily business operations. These funds should not be used for purchasing
lengthy-term assets or acquisitions that are used rather and provide the capital expenditure that
meets the brief-term financial needs of a business.
Dura bike can sell out about 100 bikes per day and recover from the average collection
period require increasing working capital financing in proper manner to change average
collection period. There is required to increase working finance about 250 per bike that helps to
recover all the payments from market and payment to suppliers on particular time period.
2. Cash and accounting break even points
A break-even analysis is an accounting instrument that enables users evaluates how cost
effective their business, or a fresh products or services, would be at. In other phrases, it is an
economic measurement to determine the products or service a business must advertise
(particularly fixed costs) to cover all the expenses. On the basis of forecasted 21900 bikes per
year sale by the Dura bikes so it will help to business to carry out at the break event point. From
the last 10 years the company follows the same strategies that impact on the operating cycle and
cash conversation cycle in negative manner. To recover from the losses company starting to
increase selling units and try to sell out more bikes on per day basis. Here is calculated break
even point
Selling price: 620 per unit
Fixed cost = 300
Paraphrase This Document
Need a fresh take? Get an instant paraphrase of this document with our AI Paraphraser
Breakeven point = Fixed cost/ Selling unit
= 620/300
= 2.067
The working capital increase necessary to accommodate the proposal from the marketing team is
given by 30 x 100 x 300, or $900,000.
· The cash breakeven point is given by ($5,600,000-$1,600,000)/$320, or 12,500 units.
· The accounting breakeven point is given by $5,600,000/$320, i.e., 17,500 units.
As per the calculation it is getting that the business can come on the track after the
analysis of breakeven point. When Dura bike increases selling units along with selling price so
they will achieve corresponding cash in a year. They will recover all the losses in certain period
of time. The accounting breakeven point is the total sales at which a company gets precisely zero
profits, provided the same proportion of extra costs for which it is forced to pay for each time
frame. This idea is often used to mold a firm's earnings framework (Choi, 2018). If a firm’s
accounting initial investment and a money breakeven point for a company were developed, they
will also probably announce slightly distinct breakeven points for purchases, as the duration of
the acknowledgement of expenses is distinct underneath the 2 techniques. In particular, the
financial reporting breakdown point would have been less probable to move around a lot than the
cash breakdown point, as the cash accounting usually leads towards a more sustainable revenue
acknowledgement
3. Calculate of weighted average cost of capital
The weighted average capital cost (WACC) is an indicator of the company's capital
expense, in which every investment type is expressed in proportion. A WACC method allocates
all financing costs, including such common stock, preferred stock, investment funds and any
other holding costs. A corporation's WACC is growing as the alpha and returning rate on capital
employed while a WACC development suggests a reduction in exposure to hazard increase.
V = E + D = 113
The equity linked with the cost of capital
(E/V) * Re = 77.86 / 113 * 6.16 = 0.04
The debt component is
(D/V) * Rd * (1 – Tc) = 36.83/113 * 6.61% * (1 - 20%)
Using the above two computed figure, WACC for Dura bike can be calculated as:
0.0449 + 0.016 = 6.1%
Cost of equity: 2.5% + 1.4 x (8.5% - 2.5%) = 10.90%, the after-tax cost of debt ends up being
8% x (1-30%) = 5.6%.
The weighted average cost of capital (WACC) is given by 20% x 5.6% + 80% x 10.90% =
9.84%
The cost of equity is an implicit return on capital or a price of development. In principle,
it is the level the return initial wealth to reimburse them for the money invested in the inventory.
The Variance is a function of the excess return in a market relative to the entire economy. This
can be determined by uploading statistical daily returns from Forbes and then using the constants
WACC and BETA. The easiest aspect of the WACC equation is possibly calculating the expense
of the loans and preferred stock. The debt cost is the rate of return to expiration on the loans of
the company and likewise, the cost of preferred shares is the rate of return on the preferred
company’s stock (Adams and et. al, 2019). Increase merely the deficit expense and produce on
ordinary shares with the overall debt and preferred stock in the capital structure of the firm, in
both.
4. Capital budgeting methodologies
There are analyzed various types of methodologies to analysis of returns from the
investment of particular project such as:
Payback period: The Payback Period largely determines the amount of time needed to regain
the program's original investment. Merely, this is the method for calculating the time needed by
subsequent cash inflows to recoup the costs accrued in the investment funds. A payback method
is the length of time it takes to recoup an investment manager expense.
Benefits: Good indicator of asset allocation is the payback period. It is widespread used because
money supply is a significant selection criteria for a project. Payback-period approach is
⊘ This is a preview!⊘
Do you want full access?
Subscribe today to unlock all pages.
Trusted by 1+ million students worldwide
beneficial for limited infrastructure projects. In these kind of project activities it is not good to
spend a great deal of time and money on complex financial evaluation.
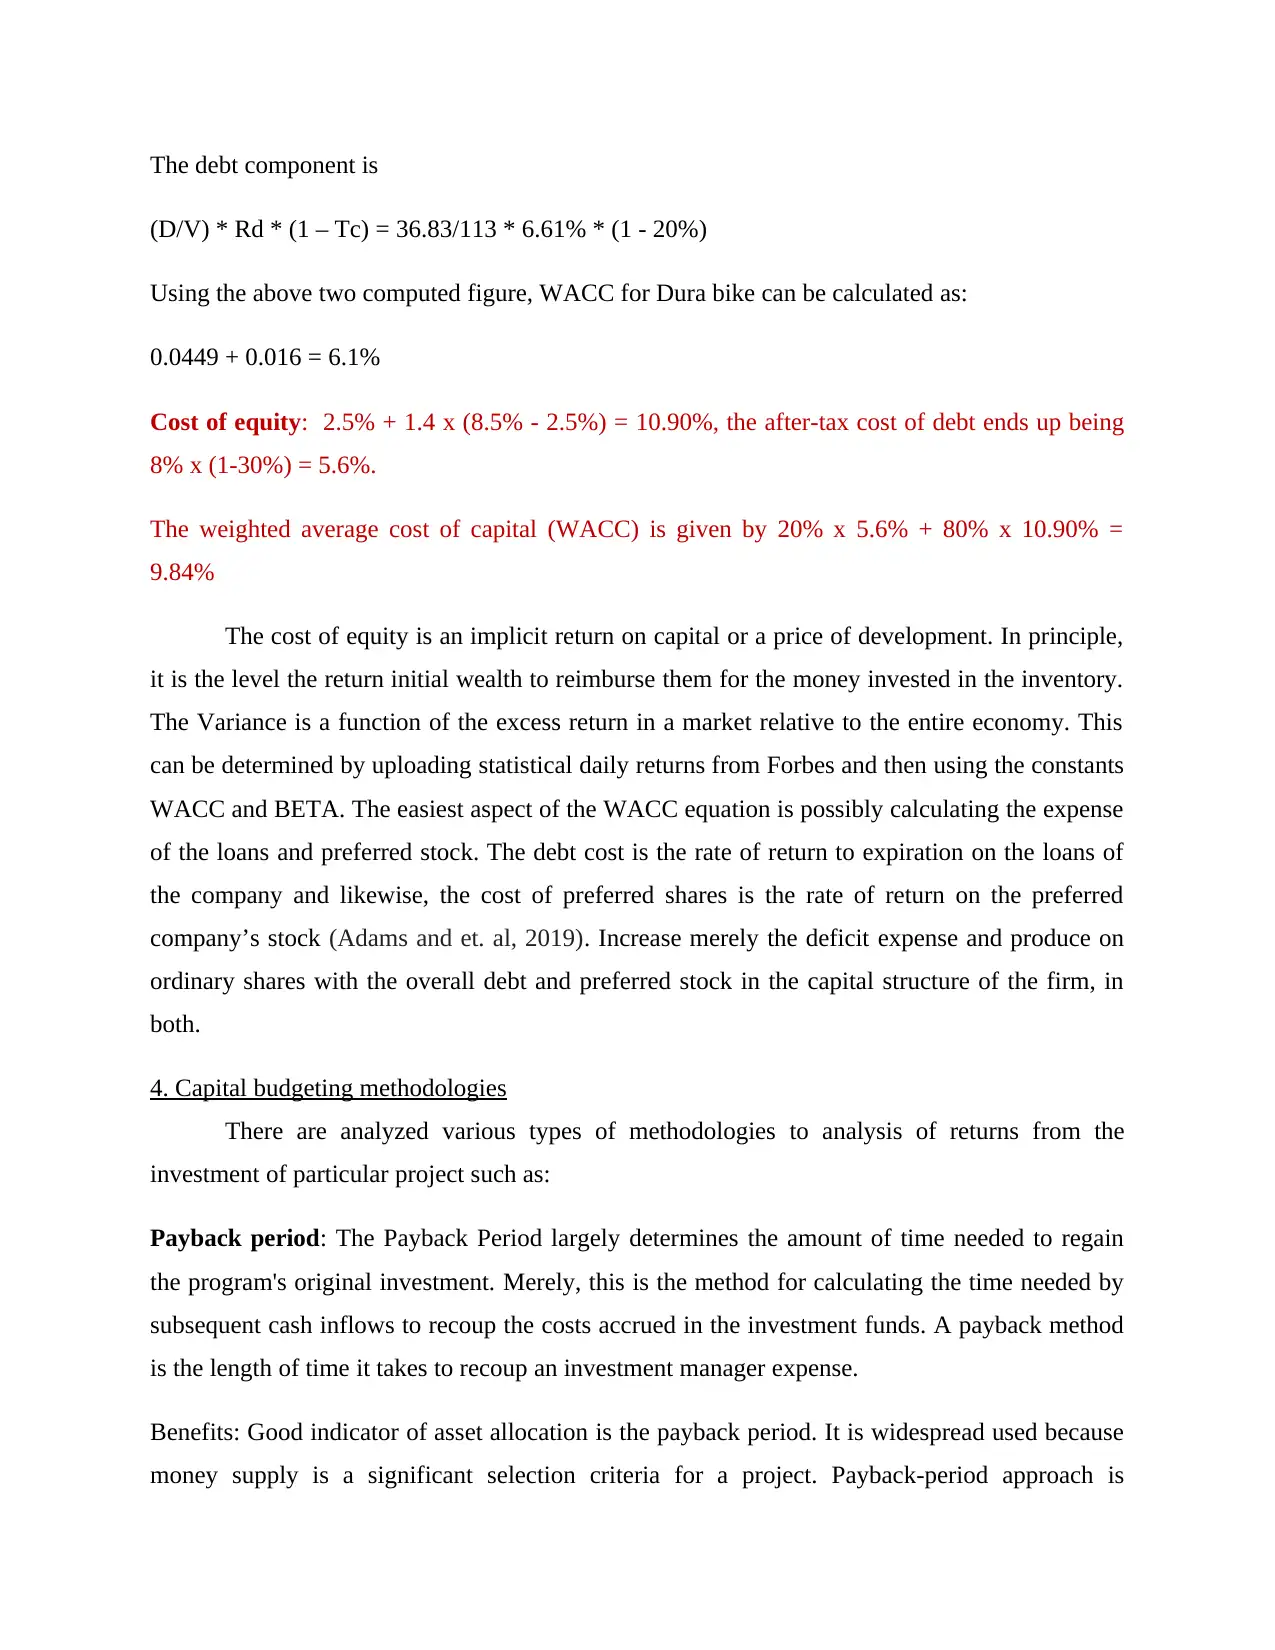
Calculation as accordance of investment appraisal techniques.
(I) Payback period
Initial investment 16000,000
Cash flow 2585600
Payback period 6.19 years
Net Present value: Net present value ( NPV) is the difference between most of the cash
inflows over time and sales, and cash outflow. The NPV is used to determine the financial
success or function of the industry with respect to returned on investment. A time value of
money makes the output provided by a venture or investment in the current dollars exceeds the
costs needed to pay (Devos, Elliott and Warr, 2018). An expense with a favorable NPV is
expected to be advantageous, and a net loss would result from intervention with a harmful NPV.
This concept forms the basis for the Net Present Value Act, what stipulates that only contracts
with positive Net present values can be considered.
Benefits: The obvious advantage of this concept-value approach is that it provides into
consideration the core principle that currently compensation is valuable less than one dollar. The
cash flows are estimated by yet another timeframe of return on capital in each timeframe.
Years
spend a great deal of time and money on complex financial evaluation.
Calculation as accordance of investment appraisal techniques.
(I) Payback period
Initial investment 16000,000
Cash flow 2585600
Payback period 6.19 years
Net Present value: Net present value ( NPV) is the difference between most of the cash
inflows over time and sales, and cash outflow. The NPV is used to determine the financial
success or function of the industry with respect to returned on investment. A time value of
money makes the output provided by a venture or investment in the current dollars exceeds the
costs needed to pay (Devos, Elliott and Warr, 2018). An expense with a favorable NPV is
expected to be advantageous, and a net loss would result from intervention with a harmful NPV.
This concept forms the basis for the Net Present Value Act, what stipulates that only contracts
with positive Net present values can be considered.
Benefits: The obvious advantage of this concept-value approach is that it provides into
consideration the core principle that currently compensation is valuable less than one dollar. The
cash flows are estimated by yet another timeframe of return on capital in each timeframe.
Years
Paraphrase This Document
Need a fresh take? Get an instant paraphrase of this document with our AI Paraphraser
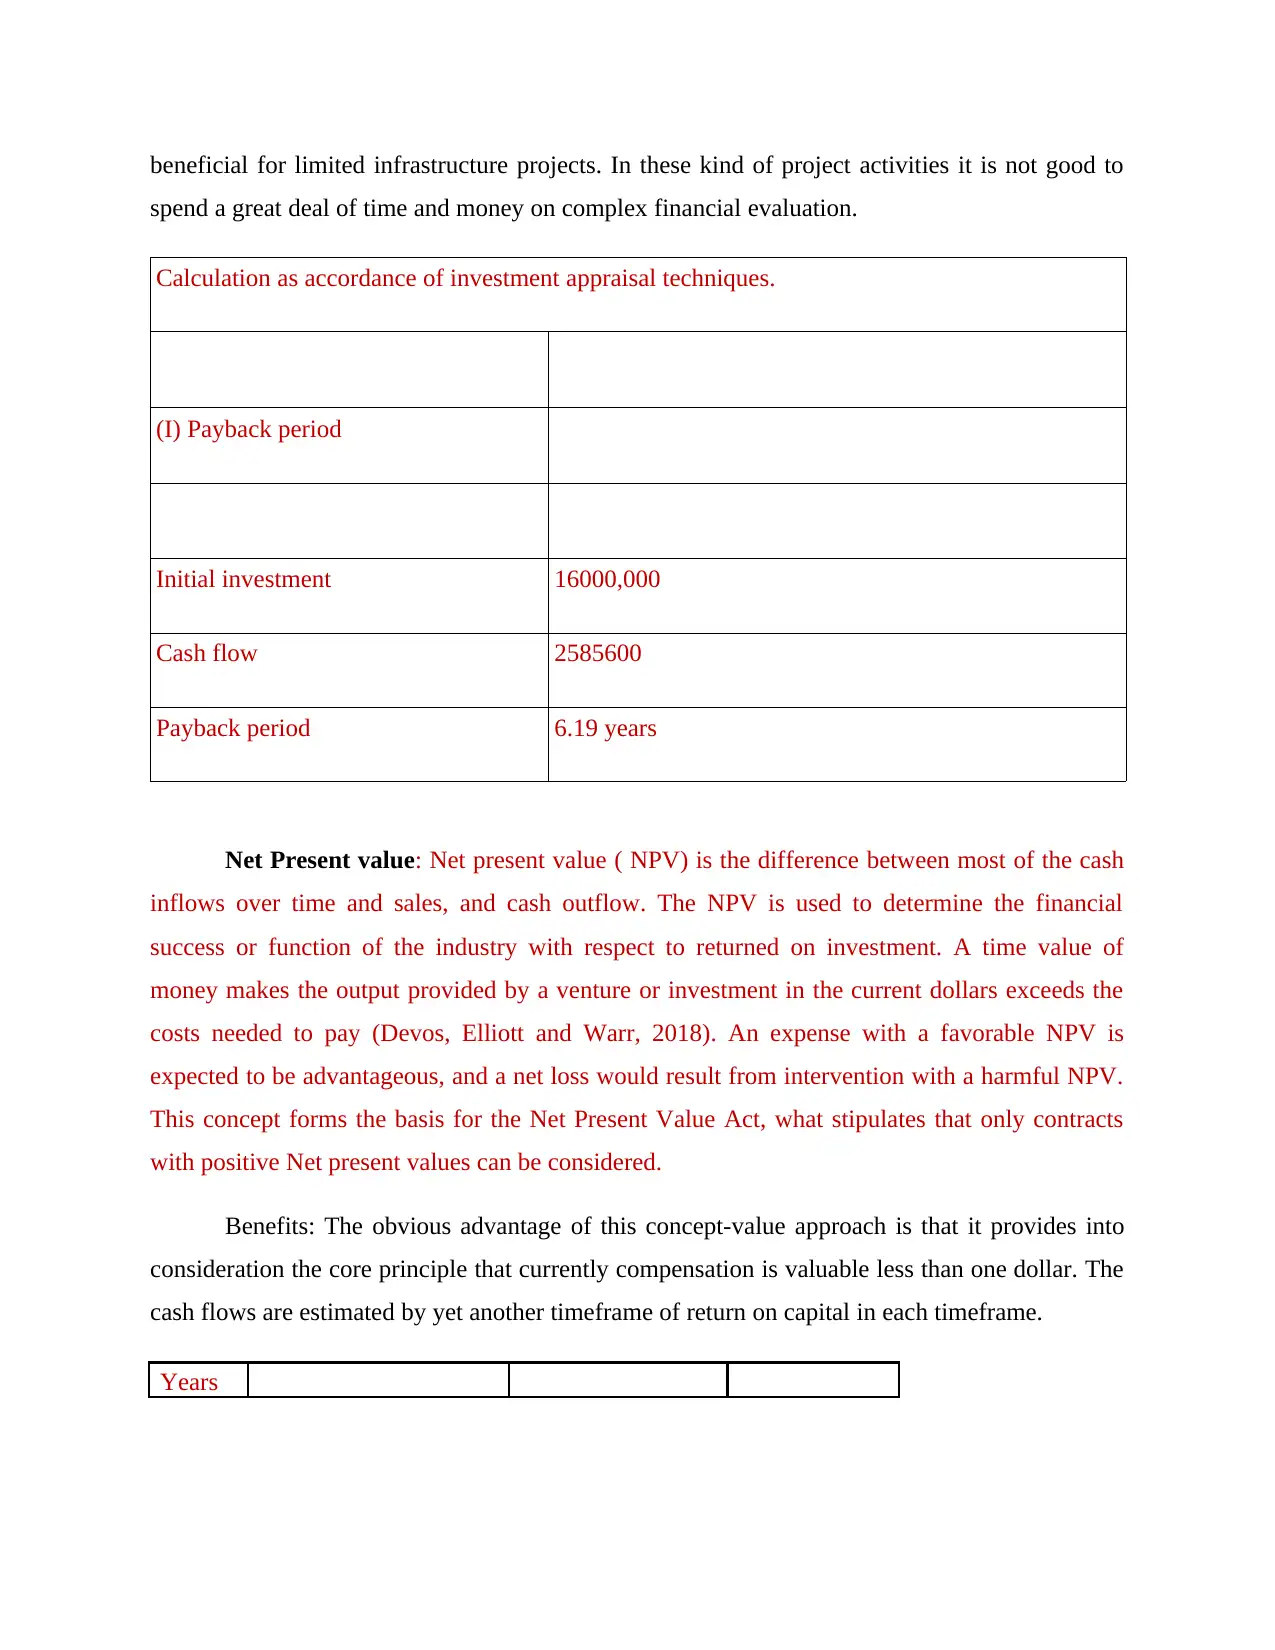
NPV= Discounted cash
flow – initial
investment
Initial investment= 16,000,000
Net Cash flow PV factor @ 12%
Discounted
cash flow
Year 1 2585600 0.892 2306355.2
Year 2 2585600 0.797 2060723.2
Year 3 2585600 0.711 1838361.6
Year 4 2585600 0.635 1641856
Year 5 2585600 0.567 1466035.2
Year 6 2585600 0.506 1308313.6
Scarp
Value 41250 0.506 20872
Discounted Cash Flow 16002817.5
Net Present value (NPV) = 16000000 – 16002817.5
= 28817.5
Internal rate of return: Internal Return Rate (IRR) is the standard rate of depreciation
used by managers to understand what capital assets or potential ventures would yield an adequate
answer and be worth consideration. The IRR for a particular project is the rate equating the net
expected cash flows currents from the proposal to nil. In other sentences, if we used the intake
manifold as the rate of return to calculate the expected cash flows flow pattern from a complex
product and removed the investment back, our net budget for the project would also be null
(Rodríguez, Dandapani and Lawrence, 2019).
Benefits: The benefits of the IRR approach would be that the process and definition are simple to
follow and that the IRR takes the duration value of the currency into consideration to provide a
more precise estimate. The IRR also lets the investment company want a overview of the
development's possible future financial returns.
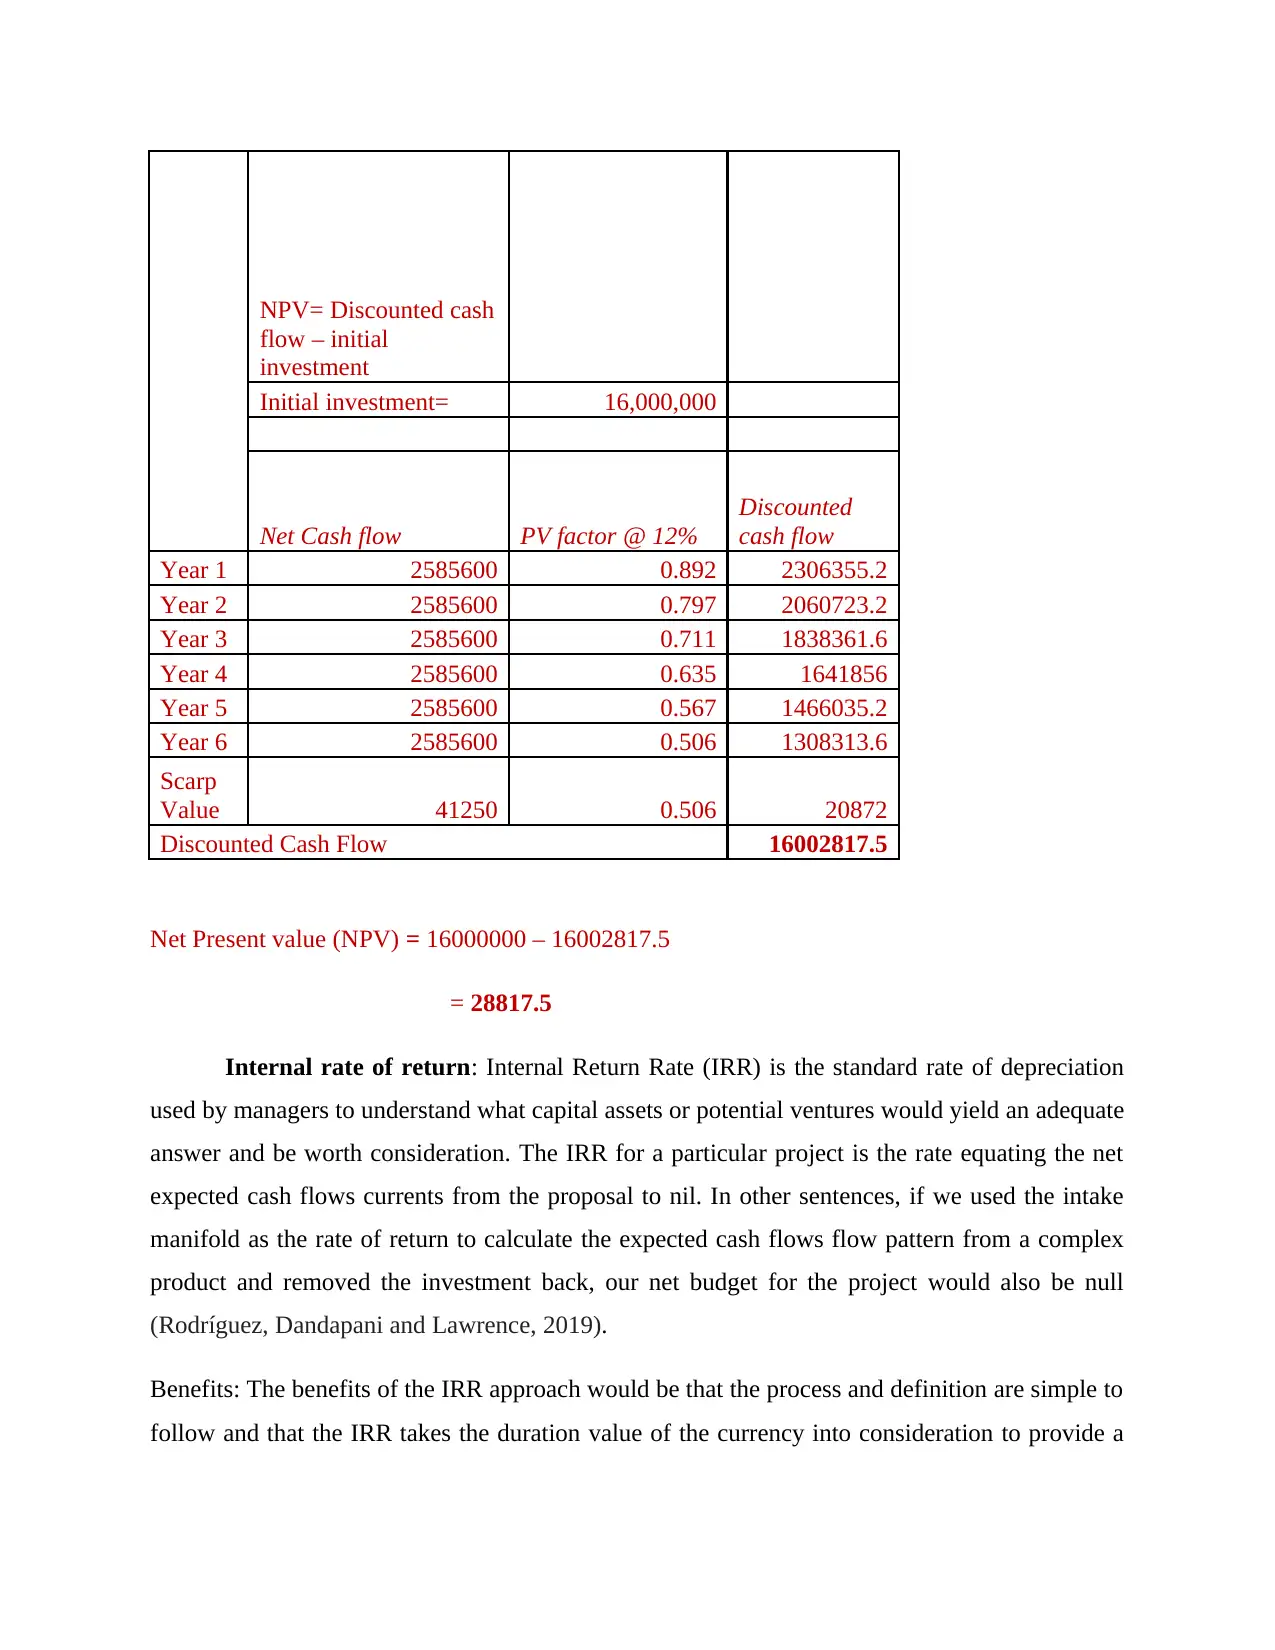
PV at 12%:
PV at 20%:
development's possible future financial returns.
PV at 12%:
PV at 20%:
⊘ This is a preview!⊘
Do you want full access?
Subscribe today to unlock all pages.
Trusted by 1+ million students worldwide
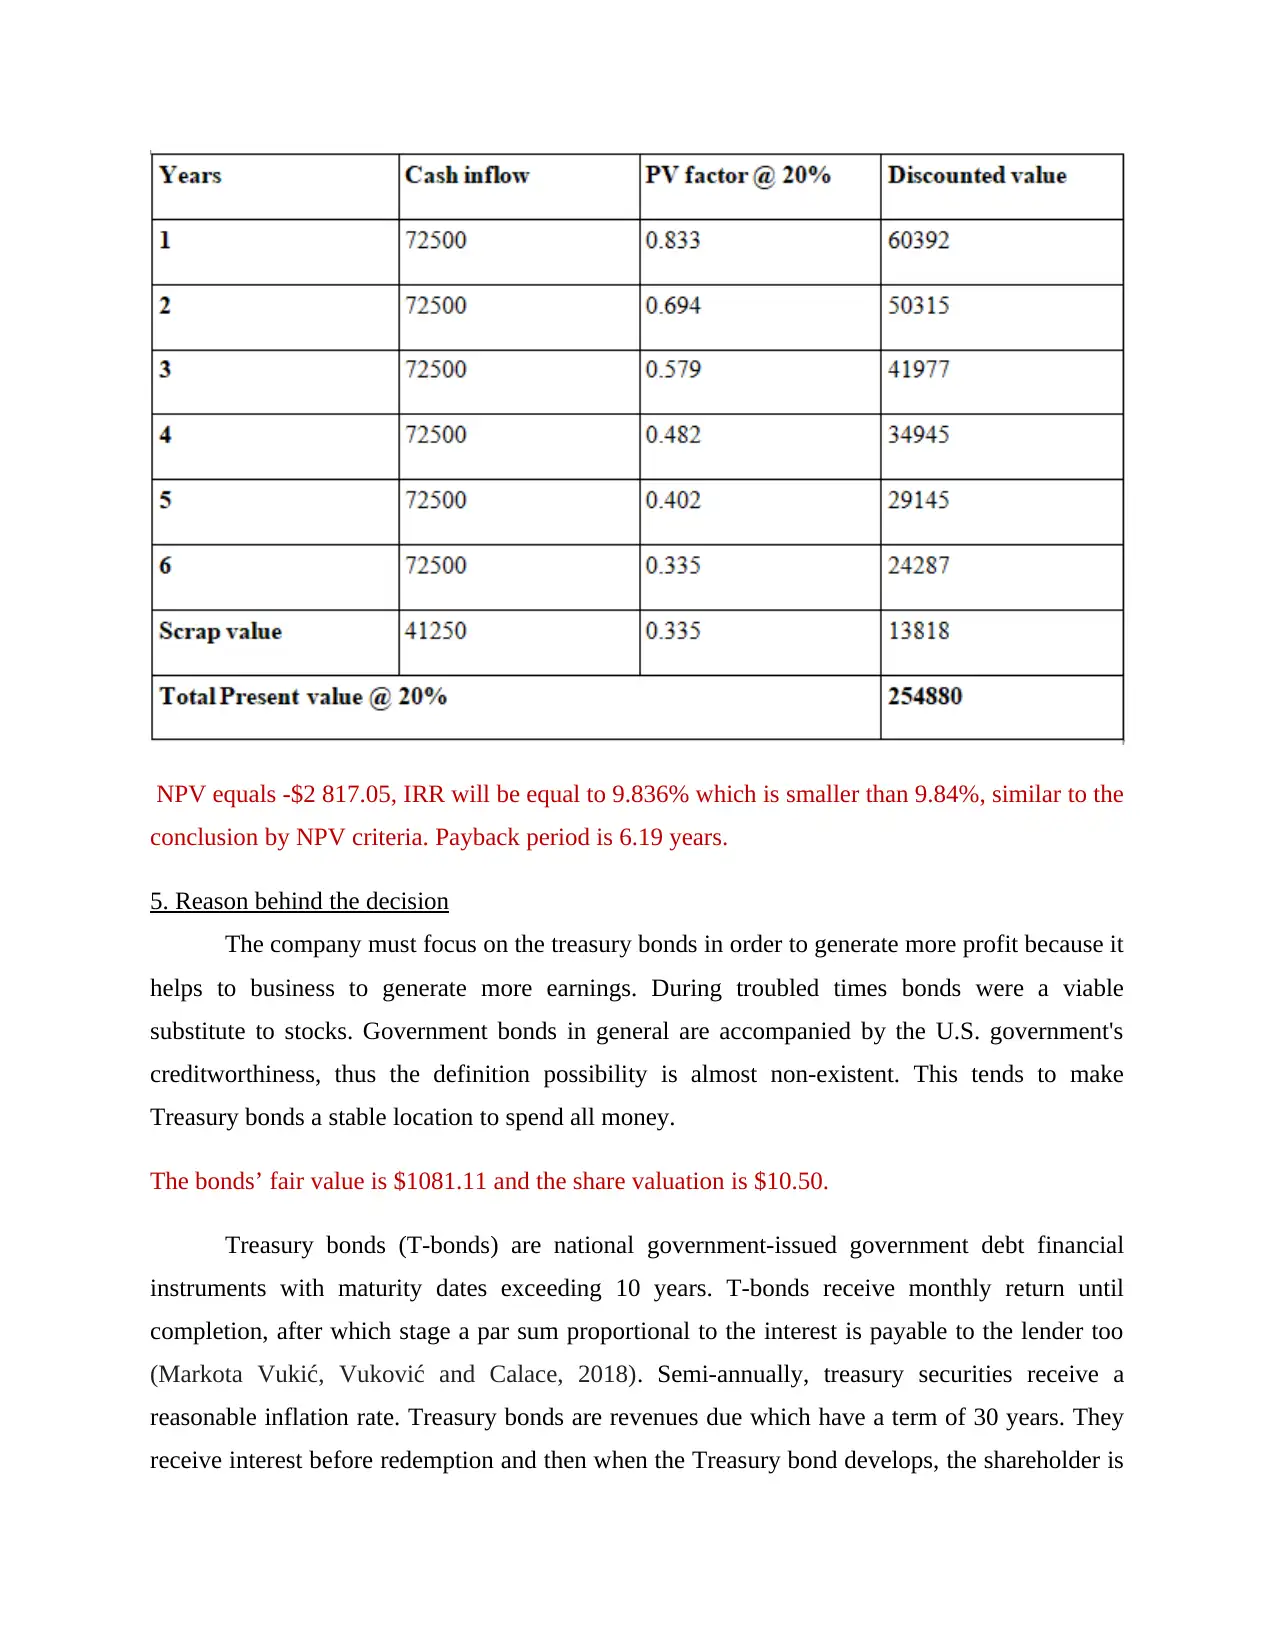
NPV equals -$2 817.05, IRR will be equal to 9.836% which is smaller than 9.84%, similar to the
conclusion by NPV criteria. Payback period is 6.19 years.
5. Reason behind the decision
The company must focus on the treasury bonds in order to generate more profit because it
helps to business to generate more earnings. During troubled times bonds were a viable
substitute to stocks. Government bonds in general are accompanied by the U.S. government's
creditworthiness, thus the definition possibility is almost non-existent. This tends to make
Treasury bonds a stable location to spend all money.
The bonds’ fair value is $1081.11 and the share valuation is $10.50.
Treasury bonds (T-bonds) are national government-issued government debt financial
instruments with maturity dates exceeding 10 years. T-bonds receive monthly return until
completion, after which stage a par sum proportional to the interest is payable to the lender too
(Markota Vukić, Vuković and Calace, 2018). Semi-annually, treasury securities receive a
reasonable inflation rate. Treasury bonds are revenues due which have a term of 30 years. They
receive interest before redemption and then when the Treasury bond develops, the shareholder is
Paraphrase This Document
Need a fresh take? Get an instant paraphrase of this document with our AI Paraphraser
often paid a par sum, or the principal. Treasury bonds are part of the greater segment of U.S.
public bonds known collectively as treasury bonds, normally considered nearly risk-free because
they are accompanied by the willingness of the United States government to tax them. Bond
yields (T-bonds) are one of 4 forms of borrowers report from the United States. Federal Reserve
to underwrite the expenditure actions of the organisation. Treasury bills, Treasury bills, Treasury
bonds and Treasury Inflation-Protected Bonds (TIPS) are the four forms of debt. The investment
funds vary according to foresight and voucher payments. They are also regarded standards for
their equivalent types of limited deposit, as they are practically risk-free, guaranteed by the U.S.
government, that can use to enhance taxes and revenues to assure for the full payments. The
reason behind the decision such as:
These are beneficial for longer period of time.
It supports to business and secure because these are based on government analysis.
6. Discuss the limitation of the above analysis
These are mentioned some limitation of above analysis such as:
Long-term investment: This U.S. bond may have to delay up to 30 years to maturity.
Limits and penalties: Limits and punishments may be correlated with repaying
government securities already when they reach maturity.
Tax liability: The involvement is exempt from federal income tax although would not pay
government or county taxation on the interest bonds accumulate.
Buying limits: When buy their securities via a sale price, users can only deductibles to 35
percent of the estimated deposit of the contract (Kisman and Krisandi, 2019).
Low yield: Treasuries are a secure investment but they're not going to deliver exciting
returns. The return on investment varies from one bond issue to another, and even if users
retain a connection to longer maturities, the yield is close to zero. Securities which offer
more risk than bond yields also give better returns.
CONCLUSION
As pr the above report it has been concluded that a business need to finance to conduct
various activities in the business. For this require to financial management is essential for the

business that helps to manage different business activities in order to maintain various things.
From the above analysis it is getting that different capital budgeting techniques can help take
decision in regard of business investment. Along with analysis different benefits of various
methodologies. Moreover, take the decision of investment for treasury bonds in order to generate
more earnings.
⊘ This is a preview!⊘
Do you want full access?
Subscribe today to unlock all pages.
Trusted by 1+ million students worldwide
1 out of 13
Related Documents


Your All-in-One AI-Powered Toolkit for Academic Success.
+13062052269
info@desklib.com
Available 24*7 on WhatsApp / Email
![[object Object]](/_next/static/media/star-bottom.7253800d.svg)
Unlock your academic potential
Copyright © 2020–2026 A2Z Services. All Rights Reserved. Developed and managed by ZUCOL.