Financial Management Homework: Investment and Bond Valuation Analysis
VerifiedAdded on  2019/10/30
|8
|1022
|128
Homework Assignment
AI Summary
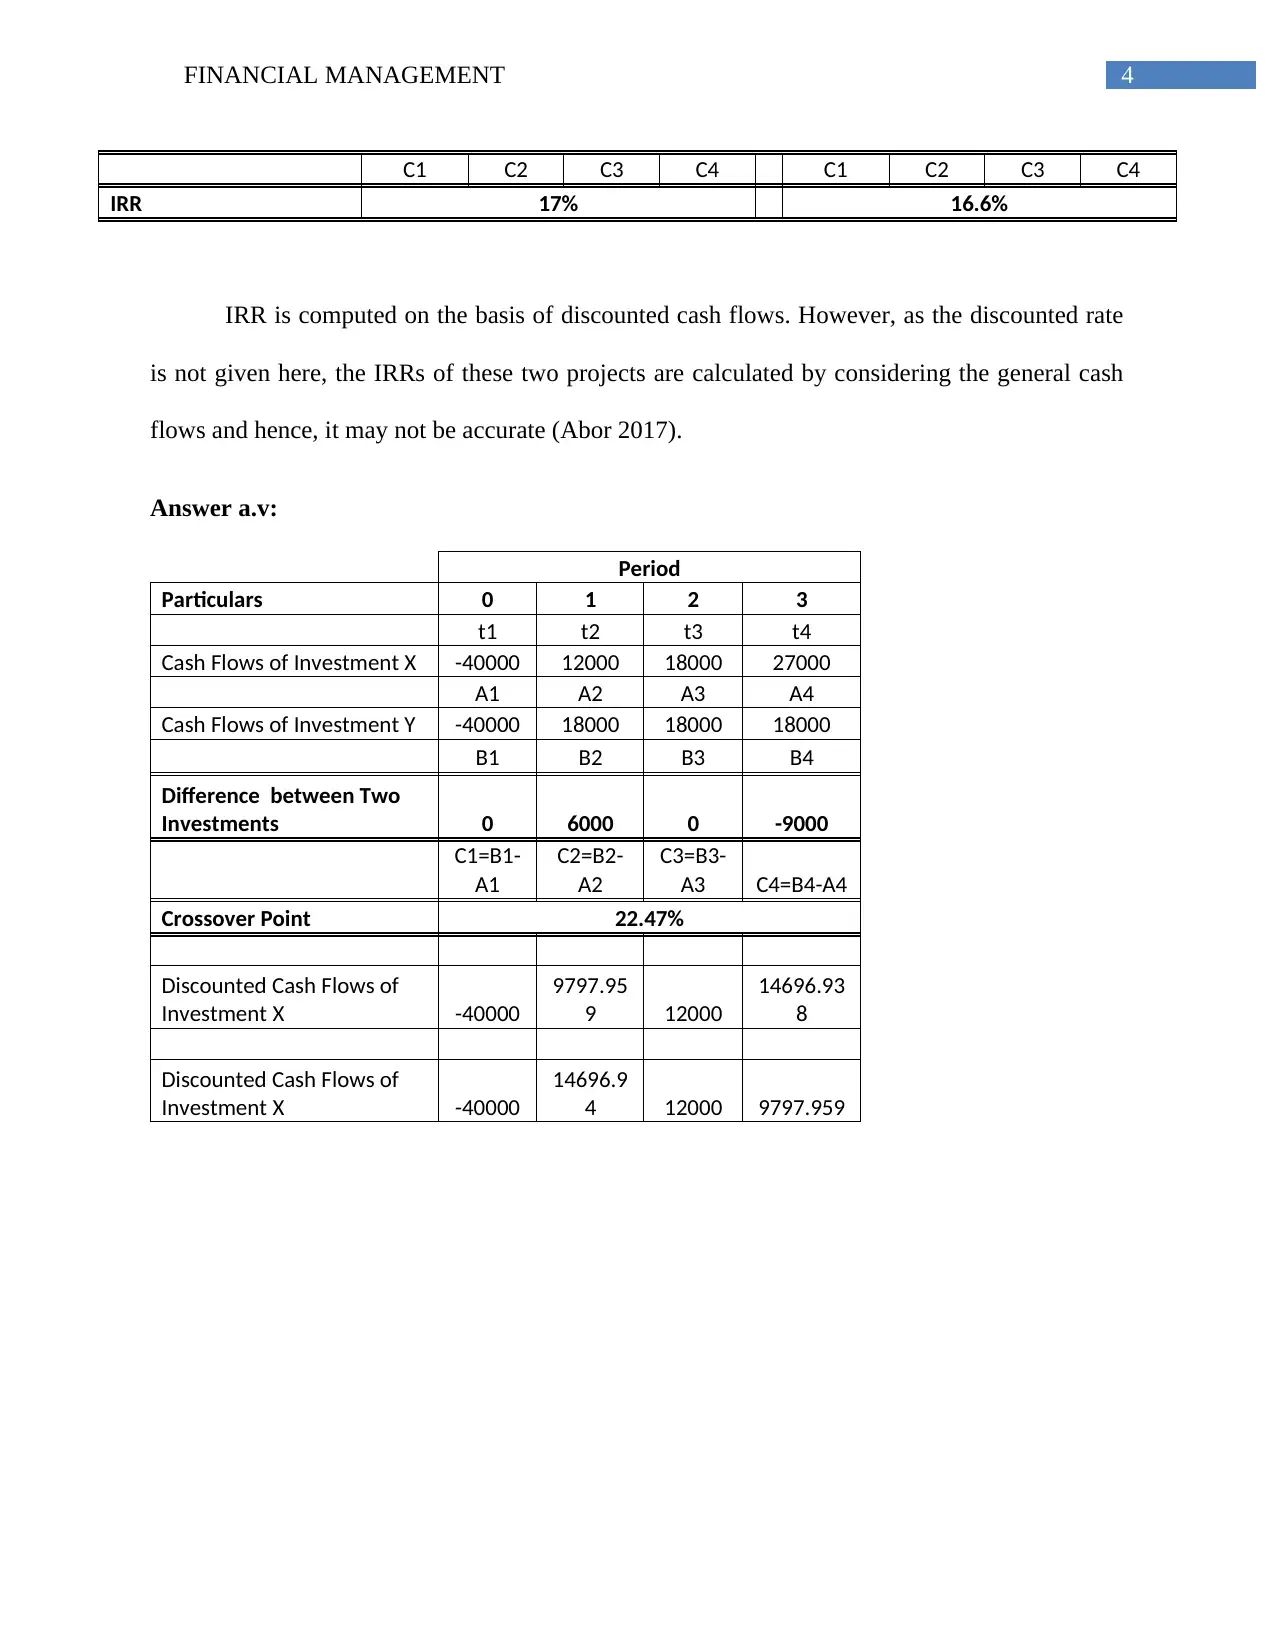
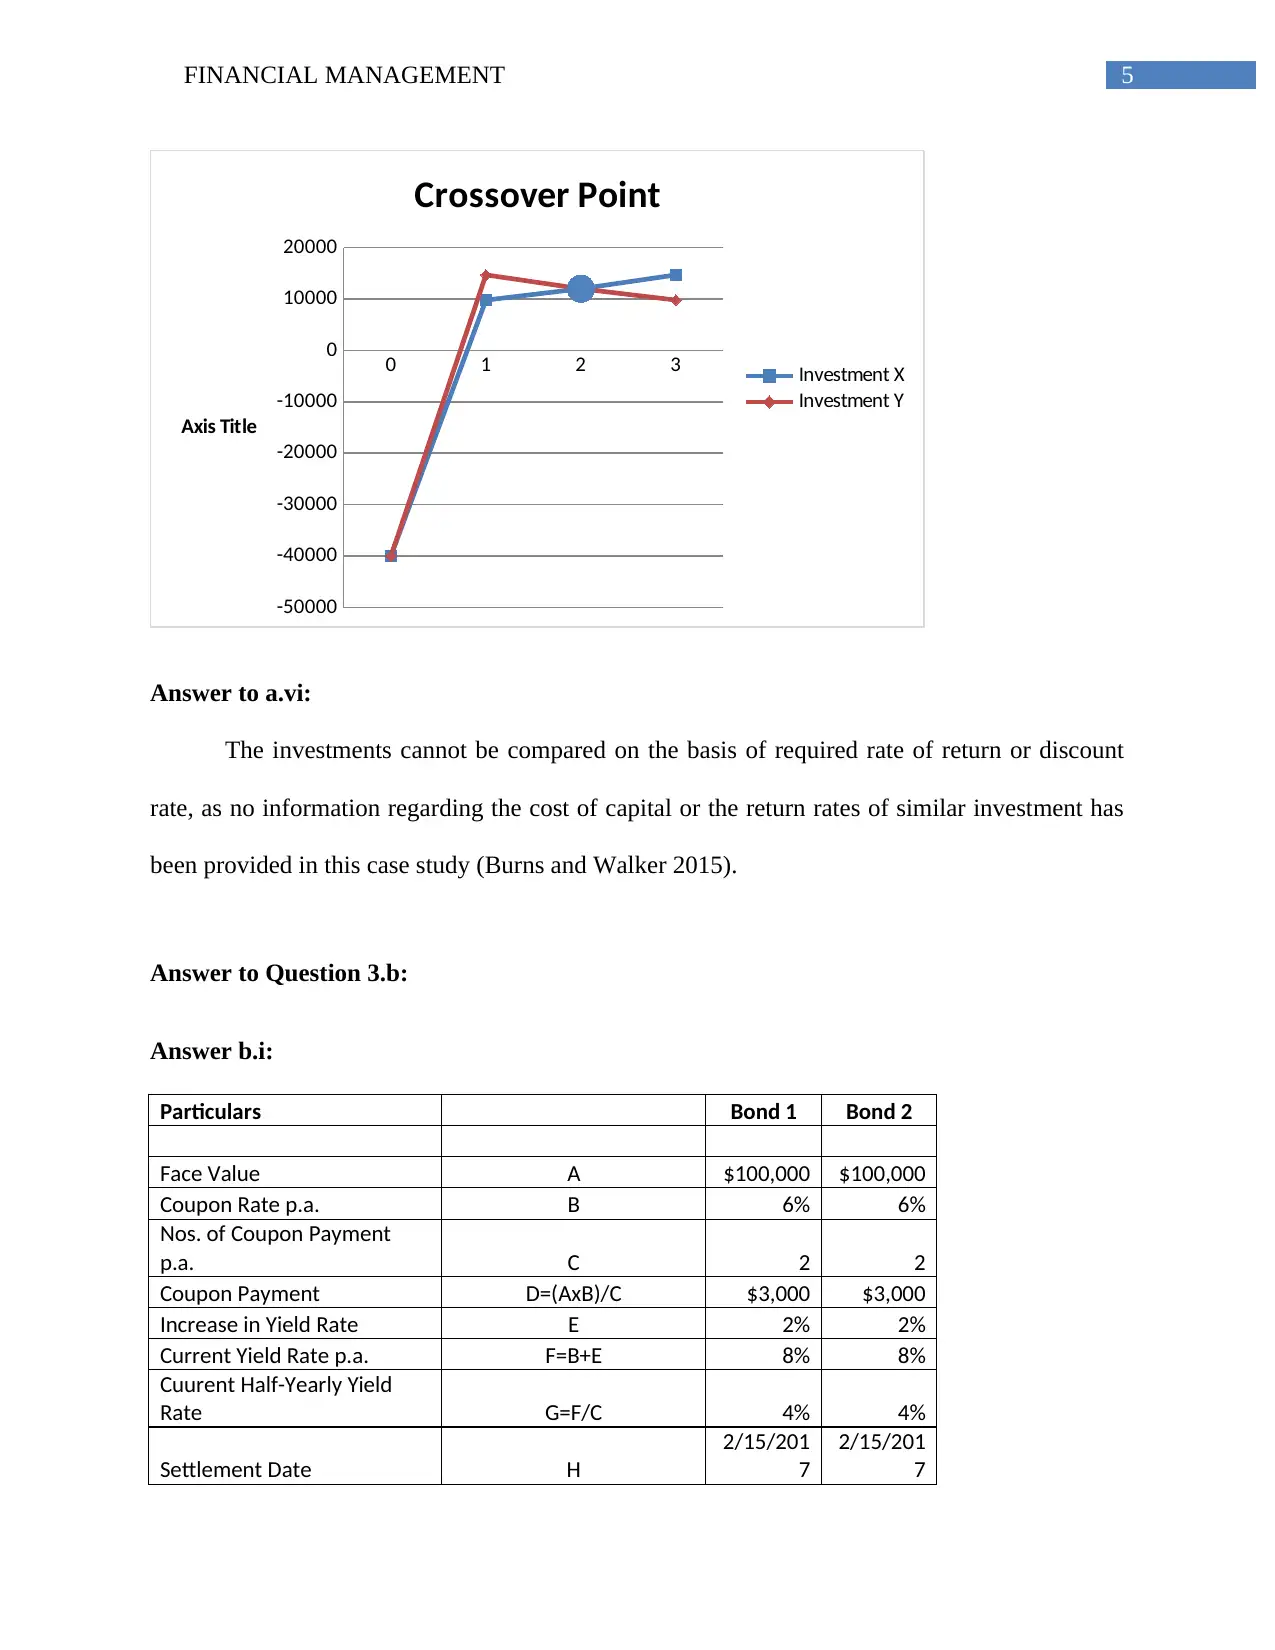
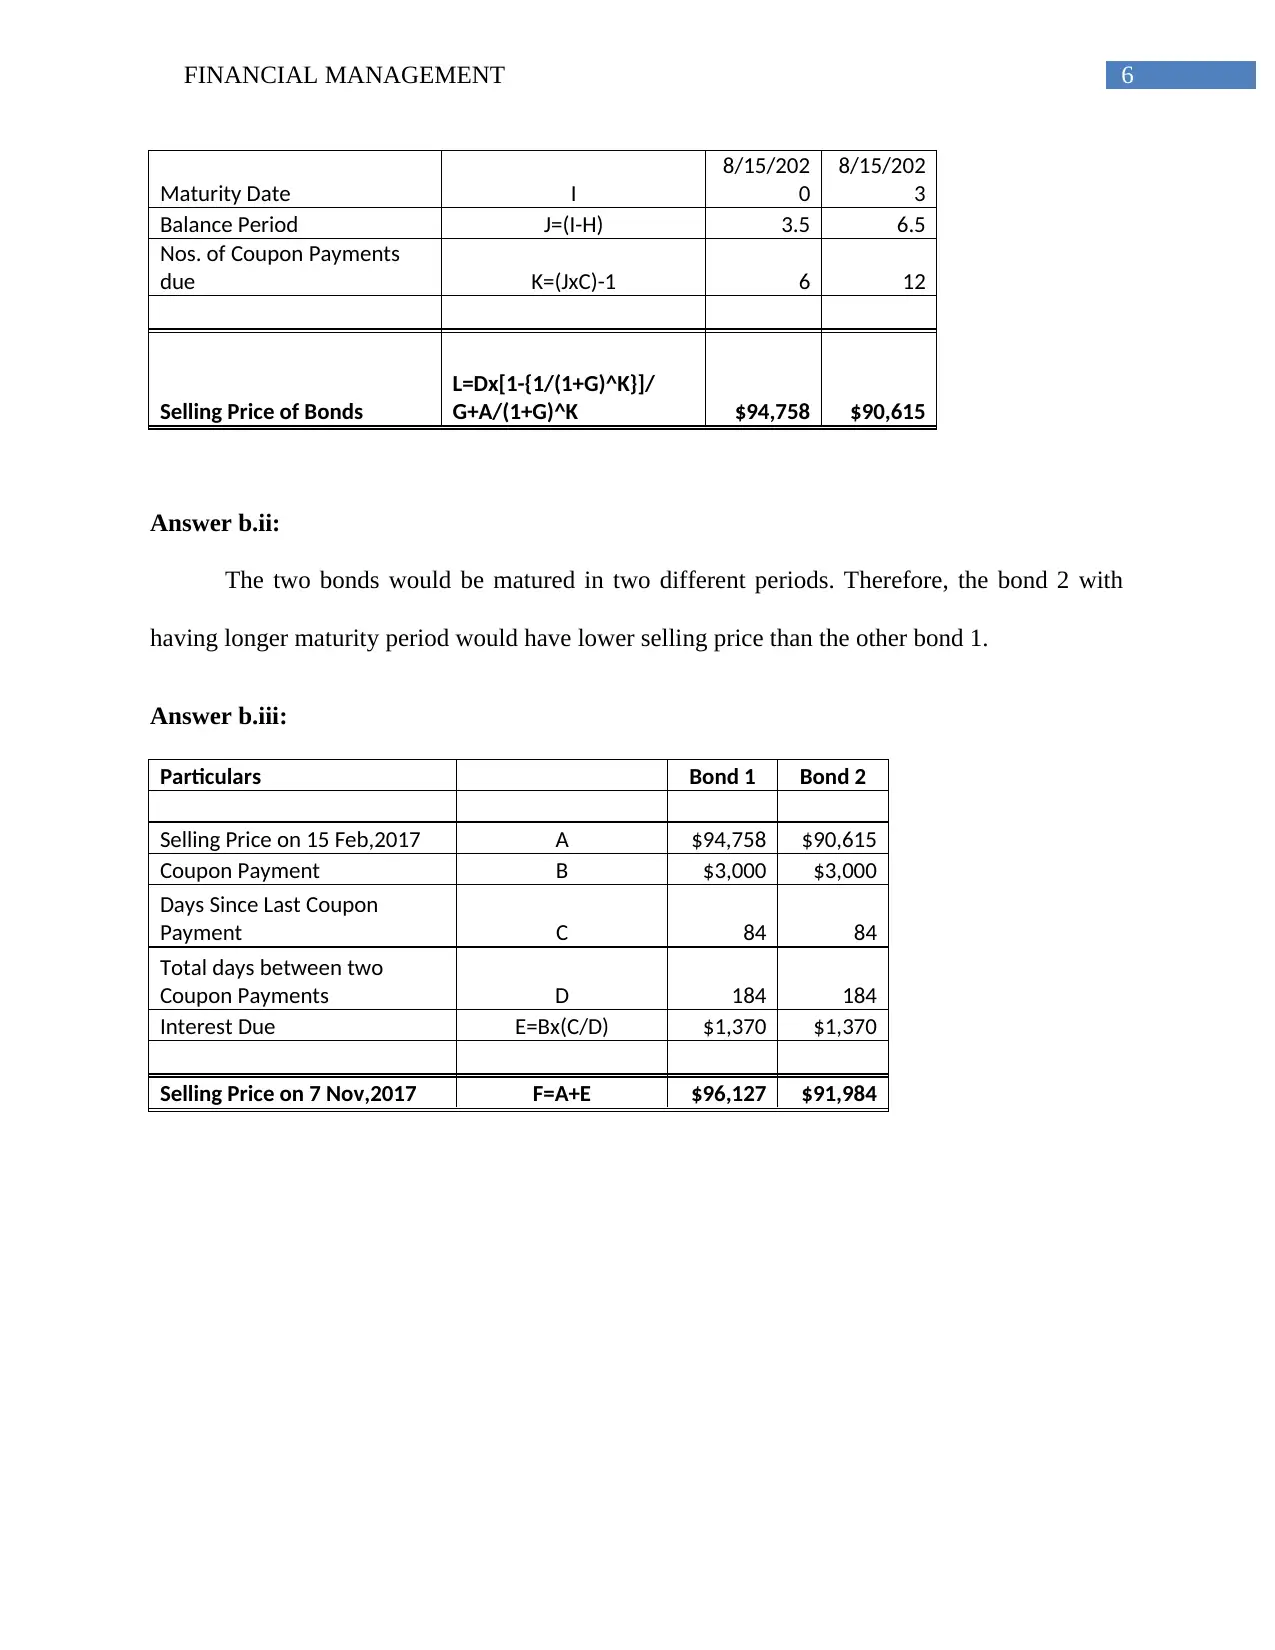
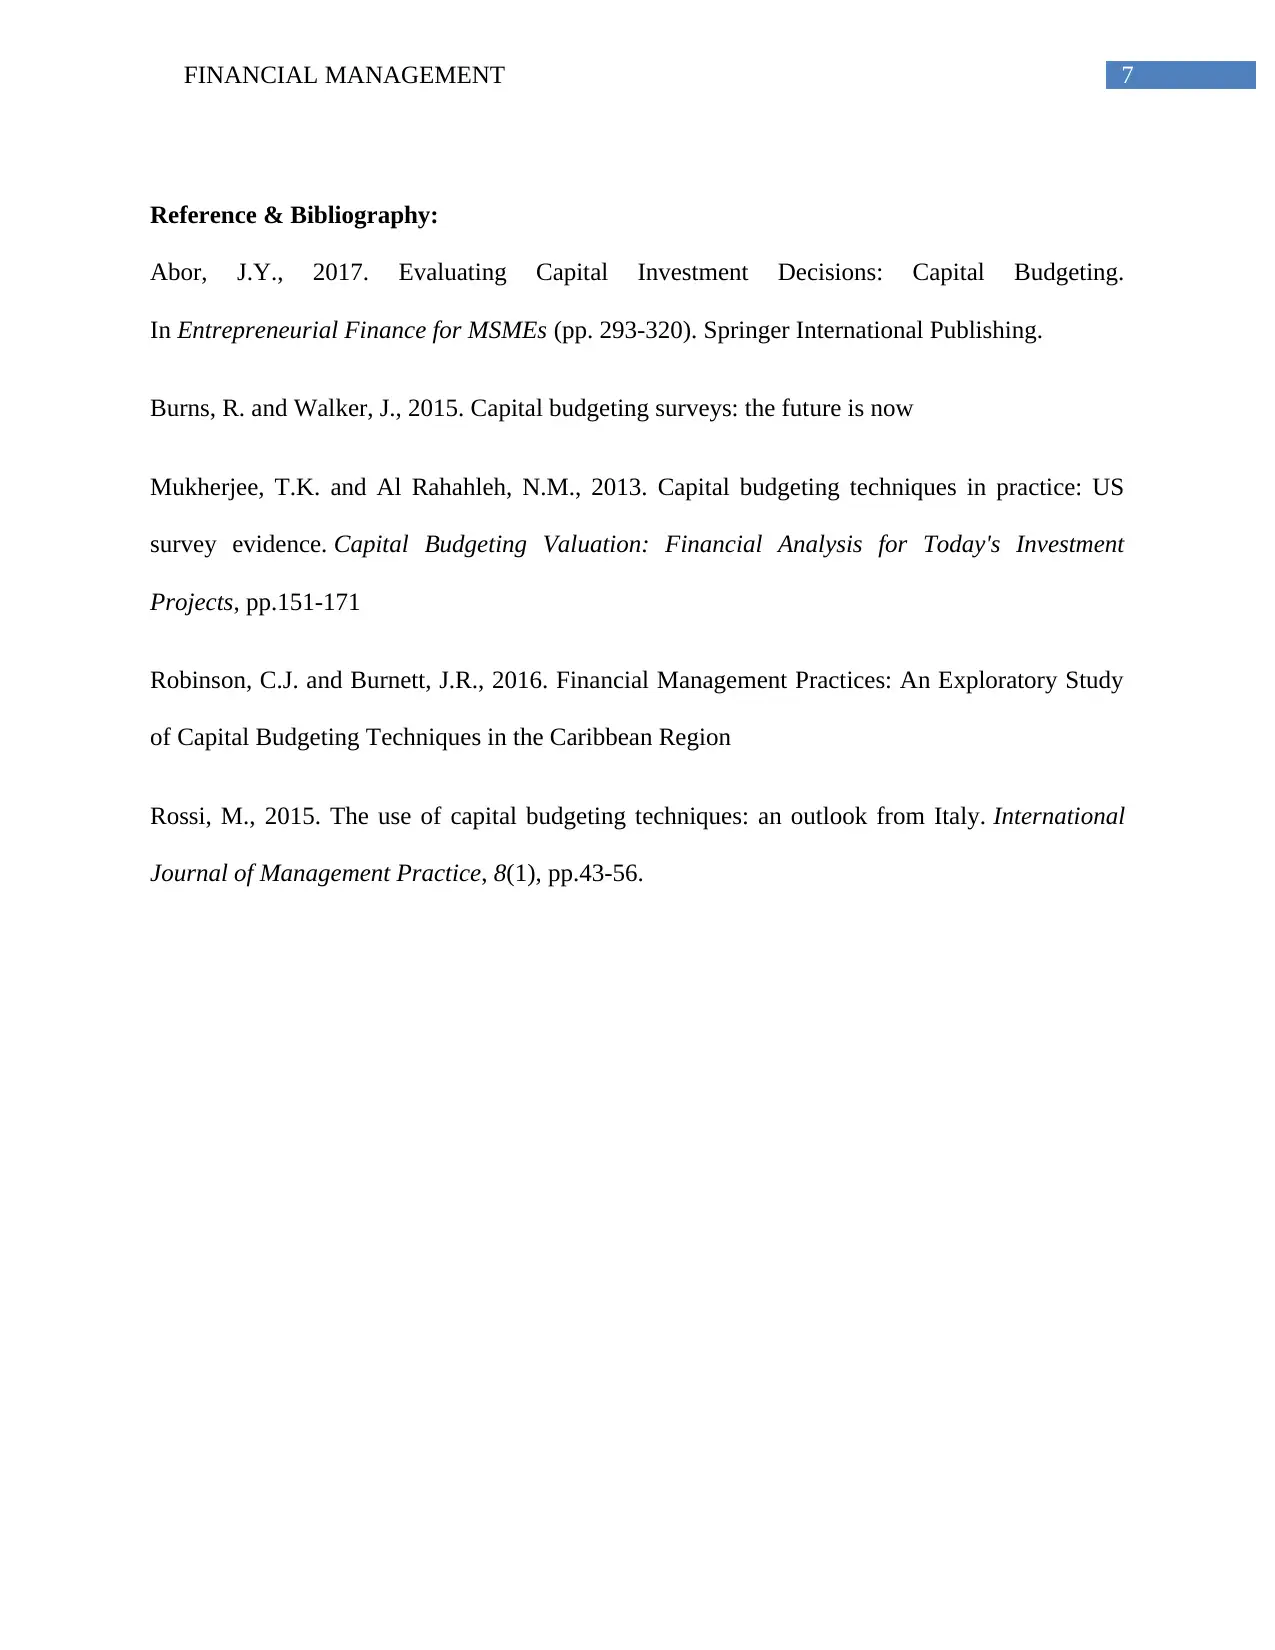
This document presents a comprehensive solution to a financial management homework assignment. The solution begins with an analysis of two investment projects, comparing them based on payback period, cumulative cash flow, and net cash flow. The analysis explores the limitations of comparing investments without a discount rate and discusses the calculation of Internal Rate of Return (IRR). The assignment then transitions to bond valuation, calculating the selling prices of two bonds with different maturity dates and coupon rates. The solution also considers the impact of yield rate increases on bond prices and calculates the interest due on the bonds. The analysis uses a detailed table format to present calculations and includes a reference list of relevant academic sources.

Running head: FINANCIAL MANAGEMENT
Financial Management
Name of the Student:
Name of the University:
Author’s Note:
Financial Management
Name of the Student:
Name of the University:
Author’s Note:
Paraphrase This Document
Need a fresh take? Get an instant paraphrase of this document with our AI Paraphraser

1FINANCIAL MANAGEMENT
Table of Contents
Answer to Question 3.a:..................................................................................................................2
Answer a.i:...................................................................................................................................2
Answer a.ii:..................................................................................................................................2
Answer a.iii:.................................................................................................................................3
Answer a.iv:.................................................................................................................................3
Answer a.v:..................................................................................................................................4
Answer to a.vi:.............................................................................................................................5
Answer to Question 3.b:..................................................................................................................5
Answer b.i:...................................................................................................................................5
Answer b.ii:..................................................................................................................................6
Answer b.iii:................................................................................................................................6
Reference & Bibliography:..............................................................................................................7

2FINANCIAL MANAGEMENT
Answer to Question 3.a:
Answer a.i:
Investment X Investment Y
Period Period
Particulars 0 1 2 3 0 1 2 3
t0 t1 t2 t3 t0 t1 t2 t3
Cash Flows -40000 19000 19000 19000 -40000 18000 18000 18000
C0 C1 C2 C3 C0 C1 C2 C3
Cumulative Cash Flow -40000 -21000 -2000 17000 -40000 -22000 -4000 14000
CC0 CC1 CC2 CC3 CC0 CC1 CC2 CC3
Payback Period (in years) 2.11 2.22
P=t2+(-CC2/C3) P=t2+(-CC2/C3)
If both the projects would generate evenly cash flows in each year, then it is better to
select Investment X due to shorter payback period.
Answer a.ii:
Investment X Investment Y
Period Period
Particulars 0 1 2 3 0 1 2 3
t1 t2 t3 t4 t1 t2 t3 t4
Cash Flows -40000 12000 18000 27000 -40000 18000 18000 18000
C1 C2 C3 C4 C1 C2 C3 C4
Cumulative Cash Flow -40000 -28000 -10000 17000 -40000 -22000 -4000 14000
CC1 CC2 CC3 CC4 CC1 CC2 CC3 CC4
Payback Period (in years) 2.37 2.22
P=t3+(-CC3/C4) P=t3+(-CC3/C4)
As per the above table, Investment X would have longer payback period and therefore,
Investment Y would be more profitable for investment purpose.
⊘ This is a preview!⊘
Do you want full access?
Subscribe today to unlock all pages.

Trusted by 1+ million students worldwide

3FINANCIAL MANAGEMENT
Answer a.iii:
Net present value is calculating by using discount rate. However, in this case study, no
such discount rate is given for the investments and therefore, the NPVs of the two investments
cannot be compared with each other (Mukherjee and Al Rahahleh 2013).
Instead of net present value, the investments are compared in accordance to the net cash
flows of the investments below:
Investment X Investment Y
Period Period
Particulars 1 2 3 4 1 2 3 4
t1 t2 t3 t4 t1 t2 t3 t4
Cash Flows -40000 12000 18000 27000 -40000 18000 18000 18000
C1 C2 C3 C4 C1 C2 C3 C4
Net Cash Flow 17000 14000
NPV = C1+C2+C3+C4 NPV = C1+C2+C3+C4
Investment X Investment Y
0
5000
10000
15000
20000
Net Cash Flow
Net Cash Flow
Investments
Net Cash Flows
Answer a.iv:
Investment X Investment Y
Period Period
Particulars 1 2 3 4 1 2 3 4
t1 t2 t3 t4 t1 t2 t3 t4
Cash Flows -40000 12000 18000 27000 -40000 18000 18000 18000
Paraphrase This Document
Need a fresh take? Get an instant paraphrase of this document with our AI Paraphraser

4FINANCIAL MANAGEMENT
C1 C2 C3 C4 C1 C2 C3 C4
IRR 17% 16.6%
IRR is computed on the basis of discounted cash flows. However, as the discounted rate
is not given here, the IRRs of these two projects are calculated by considering the general cash
flows and hence, it may not be accurate (Abor 2017).
Answer a.v:
Period
Particulars 0 1 2 3
t1 t2 t3 t4
Cash Flows of Investment X -40000 12000 18000 27000
A1 A2 A3 A4
Cash Flows of Investment Y -40000 18000 18000 18000
B1 B2 B3 B4
Difference between Two
Investments 0 6000 0 -9000
C1=B1-
A1
C2=B2-
A2
C3=B3-
A3 C4=B4-A4
Crossover Point 22.47%
Discounted Cash Flows of
Investment X -40000
9797.95
9 12000
14696.93
8
Discounted Cash Flows of
Investment X -40000
14696.9
4 12000 9797.959

5FINANCIAL MANAGEMENT
0 1 2 3
-50000
-40000
-30000
-20000
-10000
0
10000
20000
Crossover Point
Investment X
Investment Y
Axis Title
Answer to a.vi:
The investments cannot be compared on the basis of required rate of return or discount
rate, as no information regarding the cost of capital or the return rates of similar investment has
been provided in this case study (Burns and Walker 2015).
Answer to Question 3.b:
Answer b.i:
Particulars Bond 1 Bond 2
Face Value A $100,000 $100,000
Coupon Rate p.a. B 6% 6%
Nos. of Coupon Payment
p.a. C 2 2
Coupon Payment D=(AxB)/C $3,000 $3,000
Increase in Yield Rate E 2% 2%
Current Yield Rate p.a. F=B+E 8% 8%
Cuurent Half-Yearly Yield
Rate G=F/C 4% 4%
Settlement Date H
2/15/201
7
2/15/201
7
⊘ This is a preview!⊘
Do you want full access?
Subscribe today to unlock all pages.

Trusted by 1+ million students worldwide

6FINANCIAL MANAGEMENT
Maturity Date I
8/15/202
0
8/15/202
3
Balance Period J=(I-H) 3.5 6.5
Nos. of Coupon Payments
due K=(JxC)-1 6 12
Selling Price of Bonds
L=Dx[1-{1/(1+G)^K}]/
G+A/(1+G)^K $94,758 $90,615
Answer b.ii:
The two bonds would be matured in two different periods. Therefore, the bond 2 with
having longer maturity period would have lower selling price than the other bond 1.
Answer b.iii:
Particulars Bond 1 Bond 2
Selling Price on 15 Feb,2017 A $94,758 $90,615
Coupon Payment B $3,000 $3,000
Days Since Last Coupon
Payment C 84 84
Total days between two
Coupon Payments D 184 184
Interest Due E=Bx(C/D) $1,370 $1,370
Selling Price on 7 Nov,2017 F=A+E $96,127 $91,984
Paraphrase This Document
Need a fresh take? Get an instant paraphrase of this document with our AI Paraphraser

7FINANCIAL MANAGEMENT
Reference & Bibliography:
Abor, J.Y., 2017. Evaluating Capital Investment Decisions: Capital Budgeting.
In Entrepreneurial Finance for MSMEs (pp. 293-320). Springer International Publishing.
Burns, R. and Walker, J., 2015. Capital budgeting surveys: the future is now
Mukherjee, T.K. and Al Rahahleh, N.M., 2013. Capital budgeting techniques in practice: US
survey evidence. Capital Budgeting Valuation: Financial Analysis for Today's Investment
Projects, pp.151-171
Robinson, C.J. and Burnett, J.R., 2016. Financial Management Practices: An Exploratory Study
of Capital Budgeting Techniques in the Caribbean Region
Rossi, M., 2015. The use of capital budgeting techniques: an outlook from Italy. International
Journal of Management Practice, 8(1), pp.43-56.
1 out of 8

Your All-in-One AI-Powered Toolkit for Academic Success.
 +13062052269
info@desklib.com
Available 24*7 on WhatsApp / Email
Unlock your academic potential
Copyright © 2020–2025 A2Z Services. All Rights Reserved. Developed and managed by ZUCOL.