Financial Management of Nestle UK: Analysis and Evaluation
VerifiedAdded on 2020/01/06
|23
|8255
|1052
Report
AI Summary
This report provides a comprehensive analysis of the financial management of Nestle UK, examining its financial performance for the years 2013 and 2014. It delves into the importance of financial data, exploring both internal and external sources, and assessing the validity and reliability of the information. The report reviews Nestle UK's financial statements, including income statements, balance sheets, and cash flow statements, and compares its financial data with a competitor. It also analyzes key financial ratios, such as gross profit ratio and COGS, to evaluate the company's efficiency and profitability. Furthermore, the report addresses budget constraints, reviews financial data, and evaluates the impact of financial proposals on Nestle UK's objectives. The study highlights the significance of internal and external auditing in ensuring the accuracy and reliability of financial data, and how it is used for decision-making and strategic planning.

FINANCIAL
MANAGEMENT
MANAGEMENT
Paraphrase This Document
Need a fresh take? Get an instant paraphrase of this document with our AI Paraphraser
Table of Contents
Introduction:...............................................................................................................................1
Background of the Company:....................................................................................................1
A.C 1.1:-.................................................................................................................................2
A.C 1.4 Review and Question financial data.........................................................................4
A.C 1.2:-.................................................................................................................................5
A.C 1.3 Comparative analyses of financial data of Nestle:...................................................8
A.C 2.1:-...............................................................................................................................10
A.C 2.2:-...............................................................................................................................11
A.C 3.1:-...............................................................................................................................12
A.C 3.2:-...............................................................................................................................13
A.C 3.3:-...............................................................................................................................14
A.C:3.4:-...............................................................................................................................15
Conclusion:..............................................................................................................................15
REFERENCES.........................................................................................................................16
Index of Tables
Table 1: Financial data of Nestle and its competitor..................................................................6
Table 2: Financial ratios for Nestle UK for 2014.......................................................................7
Table 3: Horizontal analysis of the Profit and loss statement..................................................10
Table 4: Cash Flow Statement..................................................................................................10
Table 5: Horizontal analysis of the Balance sheet statement...................................................11
Table 6: Variance calculation ..................................................................................................11
Table 7: Budgeted income statement.......................................................................................12
Table 8: Expansion Proposal information ...............................................................................16
Table 9: Pay back period calculation ......................................................................................16
Table 10: Net present value calculation ..................................................................................16
1
⊘ This is a preview!⊘
Do you want full access?
Subscribe today to unlock all pages.
Trusted by 1+ million students worldwide
Introduction:
This task has been designed with the purpose of assessing the financial management of a
company. In this study, Nestle UK has been used as a case study. The financial management
of Nestle UK is assessed for the years 2013 and 2014 and their financial data is compared and
analysed. To understand the financial management in a better way, the researcher has made
an effort to identify methods for procuring budgets and analyse the impact of budget
constraints. In this study, the criteria on which proposals are judged for managing finance is
assessed and the outcomes of the mentioned proposals on objectives of Nestle UK are
evaluated.
Background of the Company:
Nestle UK is a subsidiary company of Nestle SA. It is the world’s best company on nutrition
as well as health. Nestle UK is a major player in the food industry of UK and Ireland and has
employed around 8000 employees across the 23 sites (About us., 2016). The most popular
food brands that Nestle UK provides its customer base include KitKat, Nescafe, Smarties,
Buxton, Go Cat and Shreddies (Nestle.co.uk, 2015).
Figure 1: Logo of the company
(Source: Nestle.co.uk, 2015)
In addition to their immense popularity, Nestle UK is one of UK and Ireland’s major
exporters of food products. They export over £346 million worth of food products every year
to over 70 nations globally (Nestle.com, 2015).
2
Paraphrase This Document
Need a fresh take? Get an instant paraphrase of this document with our AI Paraphraser
A.C 1.1:-
According to Brigham and Houston (2014, p.221), financial data availability is
helpful for analysts and all the stakeholders to assess the financial performance and viability
of the company. There is greater importance of the financial data for the organization in
drawing conclusion not only for decision making purpose but for overall strategic decision
making of the firm. The decision making quality to a significant level is dependent on the
financial data quality. It is important that financial data are being gathered from authentic
sources in right manner in order to make sure that it offer suitable information and
knowledge. Any individual or an organisation can obtain financial statement of a particular
company through external sources and internal sources. Bull (2013, p.215) opined that the
internal sources that can help in collecting financial data include books of accounts, internal
accounting systems and sales representatives’ reports. Van Horne (2013, p.115) added that
the external sources that can be used for collecting financial data are through company
websites, suppliers, Company houses and financial statements released by the company.
The supplier’s reports provide data about the amount spent in procuring materials and the
expenses incurred in transactions. There is greater responsibility of the manager to maintain
the accounts of expenses so that it can pass such data to the organization's accounting
department. The main sources of financial data that is available from within and outside the
company include the financial statements that present the financial accounts statement,
balance sheet and the cash inflow. Nestle is relying Companies House website for the
purpose of getting financial data in order to monitor financial activities of its competitors.
In order to assess the validity of the financial data gathered from internal and external
sources Nestle makes sure that it has audited both auditors that is internal and external. The
auditors present outside makes assessment of the financial statement in relation with
reliability, accuracy and timeliness. In case of Nestle it is necessary for organization to ensure
that the financial data being undertaken is valid. Further, with the motive to ensure reliability
of financial data main focus must be on controls along with the central transaction
processing. This system can directly assist in reducing the chances of errors which are being
present in the financial records of Nestle. It can directly assist company in meeting its desired
goals and objectives. Moreover, internal auditing is also one of the most appropriate way
which is generally self consulting activity and in turn improves the effectiveness of risk
management. Main role of internal auditor is to provide support to external auditor where in
depth analysis of financial statements take place during financial audit. On the other hand to
3
ensure validity of the data external auditor is also appointed by shareholders to verify that
financial statements are true and fair. Along with this, it is known whether the funds of
business are utilized in proper manner or not. Therefore, it is also fruitful in case of Nestle
where business can assess the validity of the data.
The benefits of divulging financial data is extremely important as it assists the
processes of audit and allows the necessary party to assess the financial viability of the
company. The financial data can be assessed in terms of possibilities of internal checks or
whether it is based on the culture of the organisation.
The external sources of financial data that can be obtained are generated from
company websites, suppliers’ reports (Cheng, 2013). This information is beneficial to the
company to review their performance in years and allows the owners to make decisions for
improving output. It also assists auditors to prepare audit reports of the company. The data
sources from outside the company are helpful for investors and stakeholders to assess the
performance of the company.
In the context of entering into a partnership, the financial data is beneficial for
companies to judge the performance of the other organisation before deciding on finalising
the deal. Sole proprietorship, joint ventures and partnerships all provide varied structures of
working ethics and financial statements provide the financial performance of the company.
The validity of the data can be verified by looking into their annual reports, financial
statements and auditor reports (McCafferry, 2014). These present a firm idea of the
company’s actual performance. Different types of investment decision needs to made for
entering new business environment. Firstly, financial investor needs to decide where to invest
and how to invest. For a careful investment decision considered the country’s GDP rate,
exchange rate and government policy regarding foreign investment.
The higher the GDP rate higher the return from investment. Good GDP rate indicates
the developed market which consists of largest and most industrialised country which is
lawful and unwavering government properly maintained that’s why developed market is
considered as the safest investment decision with a stable economic growth and profitability,
which are G8 countries and others European countries. Countries exchange rate influences
the financial investment decision as the share values increases and company can make profits.
Countries with different types trade restrictions with international body is risky for
investment decisions as they got low liquidity which affect the future return during periods.
4
⊘ This is a preview!⊘
Do you want full access?
Subscribe today to unlock all pages.
Trusted by 1+ million students worldwide
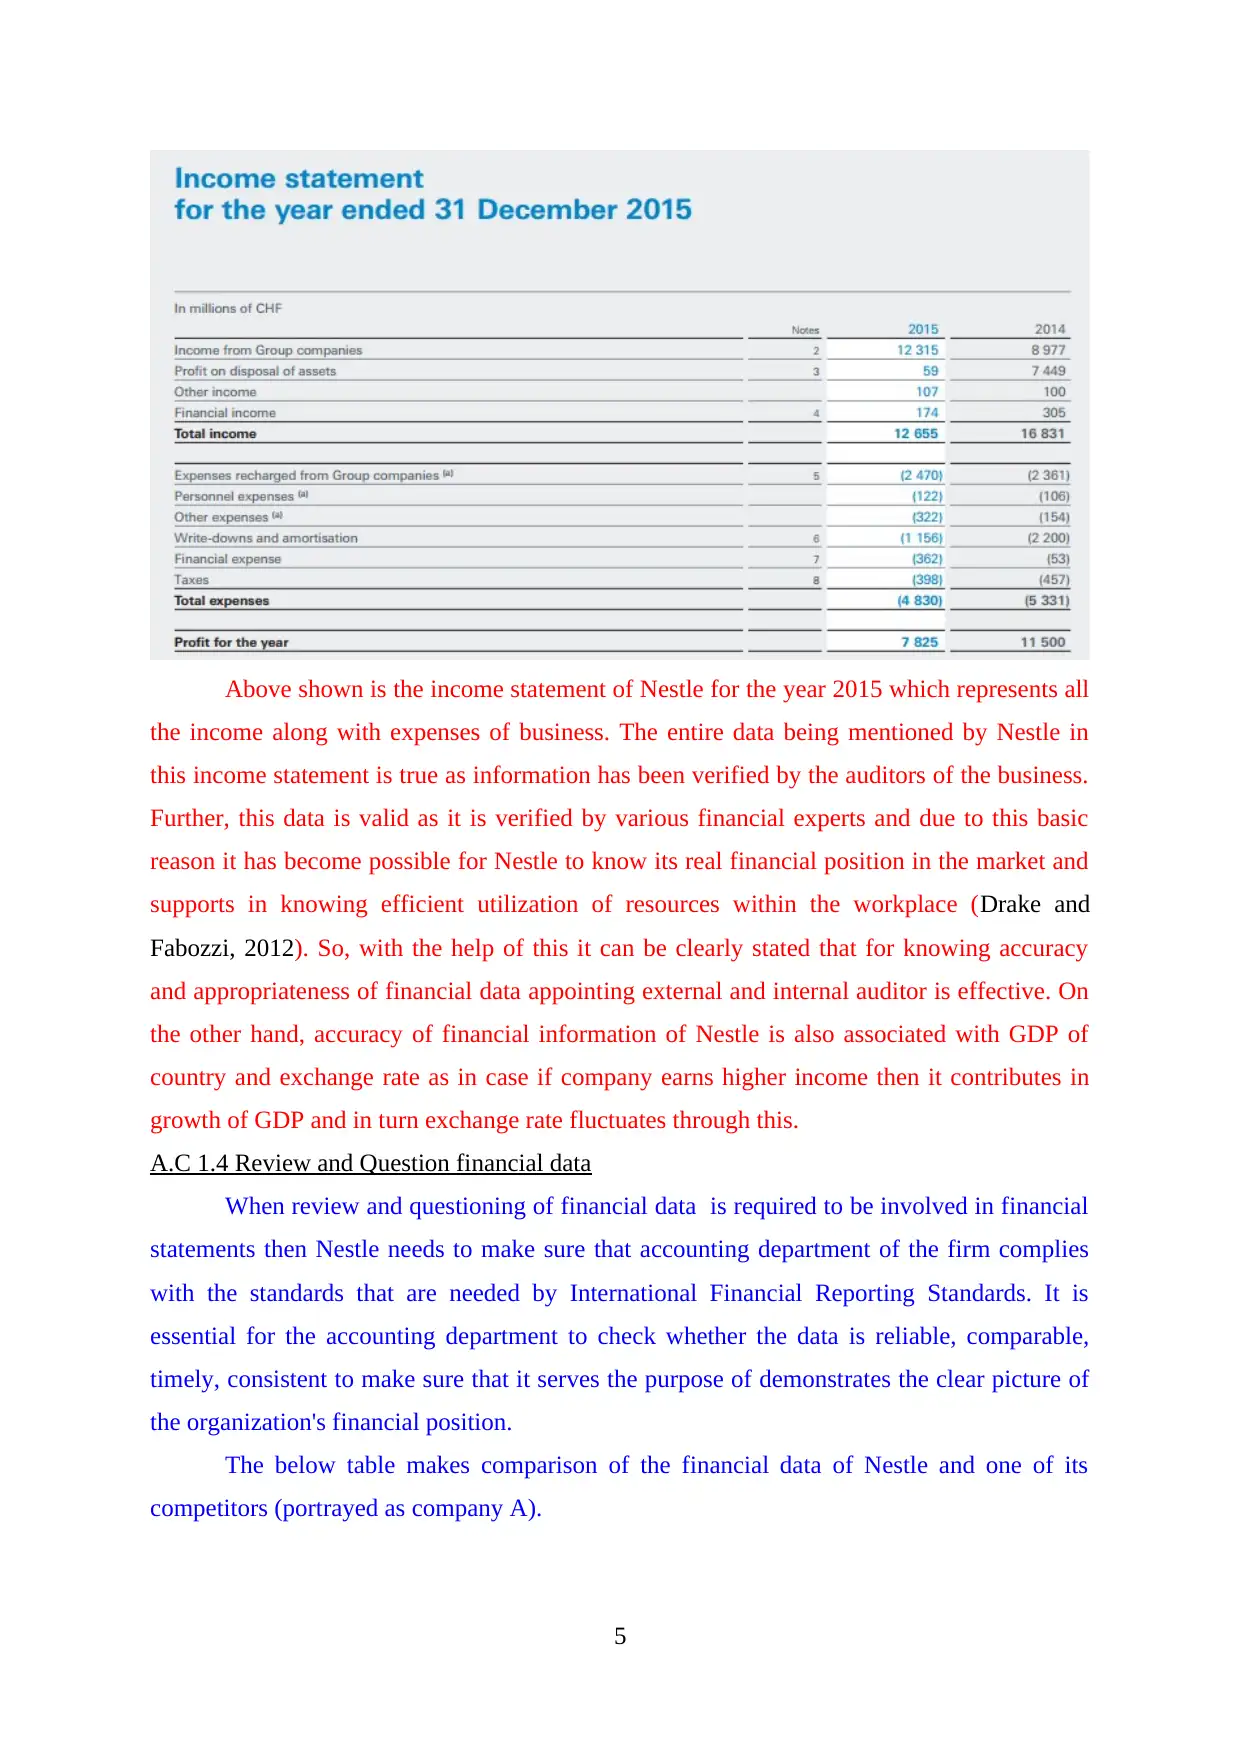
Above shown is the income statement of Nestle for the year 2015 which represents all
the income along with expenses of business. The entire data being mentioned by Nestle in
this income statement is true as information has been verified by the auditors of the business.
Further, this data is valid as it is verified by various financial experts and due to this basic
reason it has become possible for Nestle to know its real financial position in the market and
supports in knowing efficient utilization of resources within the workplace (Drake and
Fabozzi, 2012). So, with the help of this it can be clearly stated that for knowing accuracy
and appropriateness of financial data appointing external and internal auditor is effective. On
the other hand, accuracy of financial information of Nestle is also associated with GDP of
country and exchange rate as in case if company earns higher income then it contributes in
growth of GDP and in turn exchange rate fluctuates through this.
A.C 1.4 Review and Question financial data
When review and questioning of financial data is required to be involved in financial
statements then Nestle needs to make sure that accounting department of the firm complies
with the standards that are needed by International Financial Reporting Standards. It is
essential for the accounting department to check whether the data is reliable, comparable,
timely, consistent to make sure that it serves the purpose of demonstrates the clear picture of
the organization's financial position.
The below table makes comparison of the financial data of Nestle and one of its
competitors (portrayed as company A).
5
Paraphrase This Document
Need a fresh take? Get an instant paraphrase of this document with our AI Paraphraser
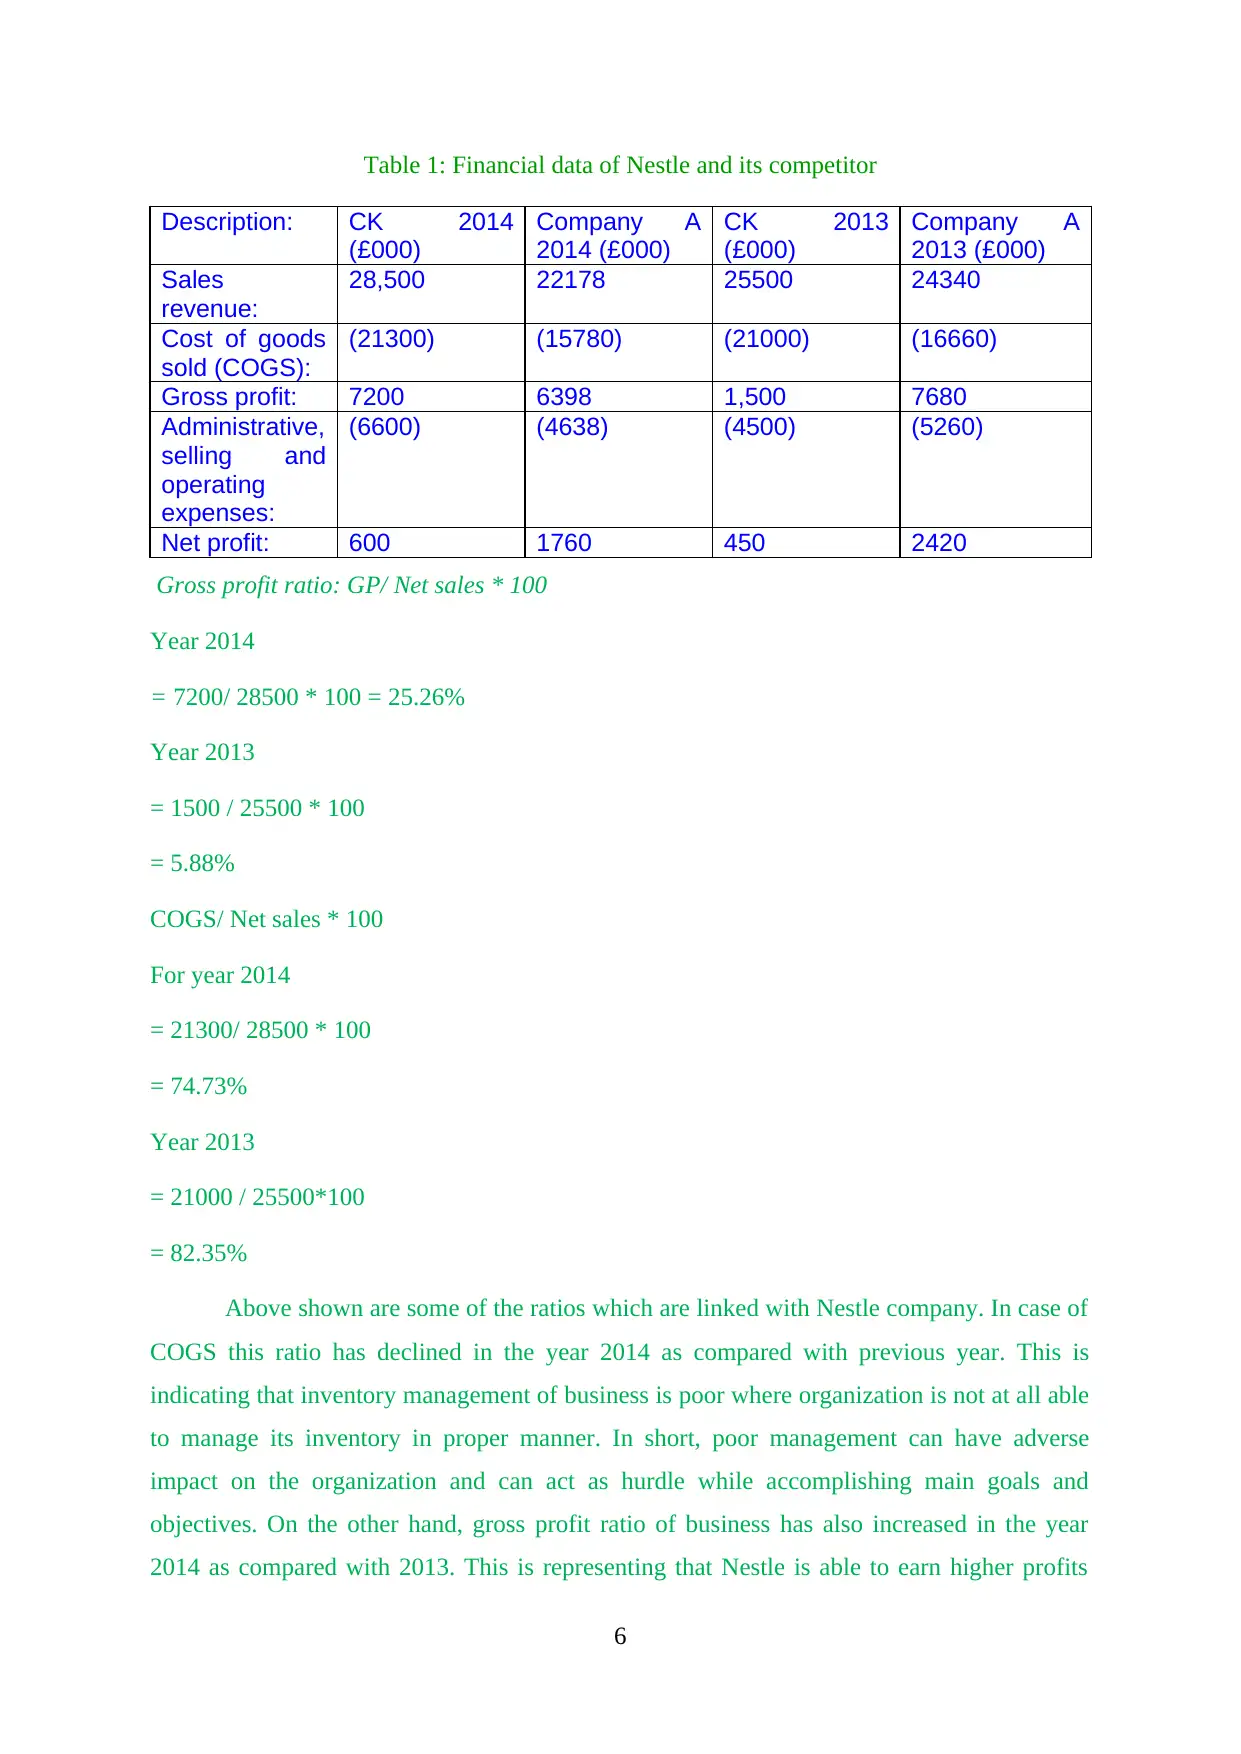
Table 1: Financial data of Nestle and its competitor
Description: CK 2014
(£000)
Company A
2014 (£000)
CK 2013
(£000)
Company A
2013 (£000)
Sales
revenue:
28,500 22178 25500 24340
Cost of goods
sold (COGS):
(21300) (15780) (21000) (16660)
Gross profit: 7200 6398 1,500 7680
Administrative,
selling and
operating
expenses:
(6600) (4638) (4500) (5260)
Net profit: 600 1760 450 2420
Gross profit ratio: GP/ Net sales * 100
Year 2014
= 7200/ 28500 * 100 = 25.26%
Year 2013
= 1500 / 25500 * 100
= 5.88%
COGS/ Net sales * 100
For year 2014
= 21300/ 28500 * 100
= 74.73%
Year 2013
= 21000 / 25500*100
= 82.35%
Above shown are some of the ratios which are linked with Nestle company. In case of
COGS this ratio has declined in the year 2014 as compared with previous year. This is
indicating that inventory management of business is poor where organization is not at all able
to manage its inventory in proper manner. In short, poor management can have adverse
impact on the organization and can act as hurdle while accomplishing main goals and
objectives. On the other hand, gross profit ratio of business has also increased in the year
2014 as compared with 2013. This is representing that Nestle is able to earn higher profits
6
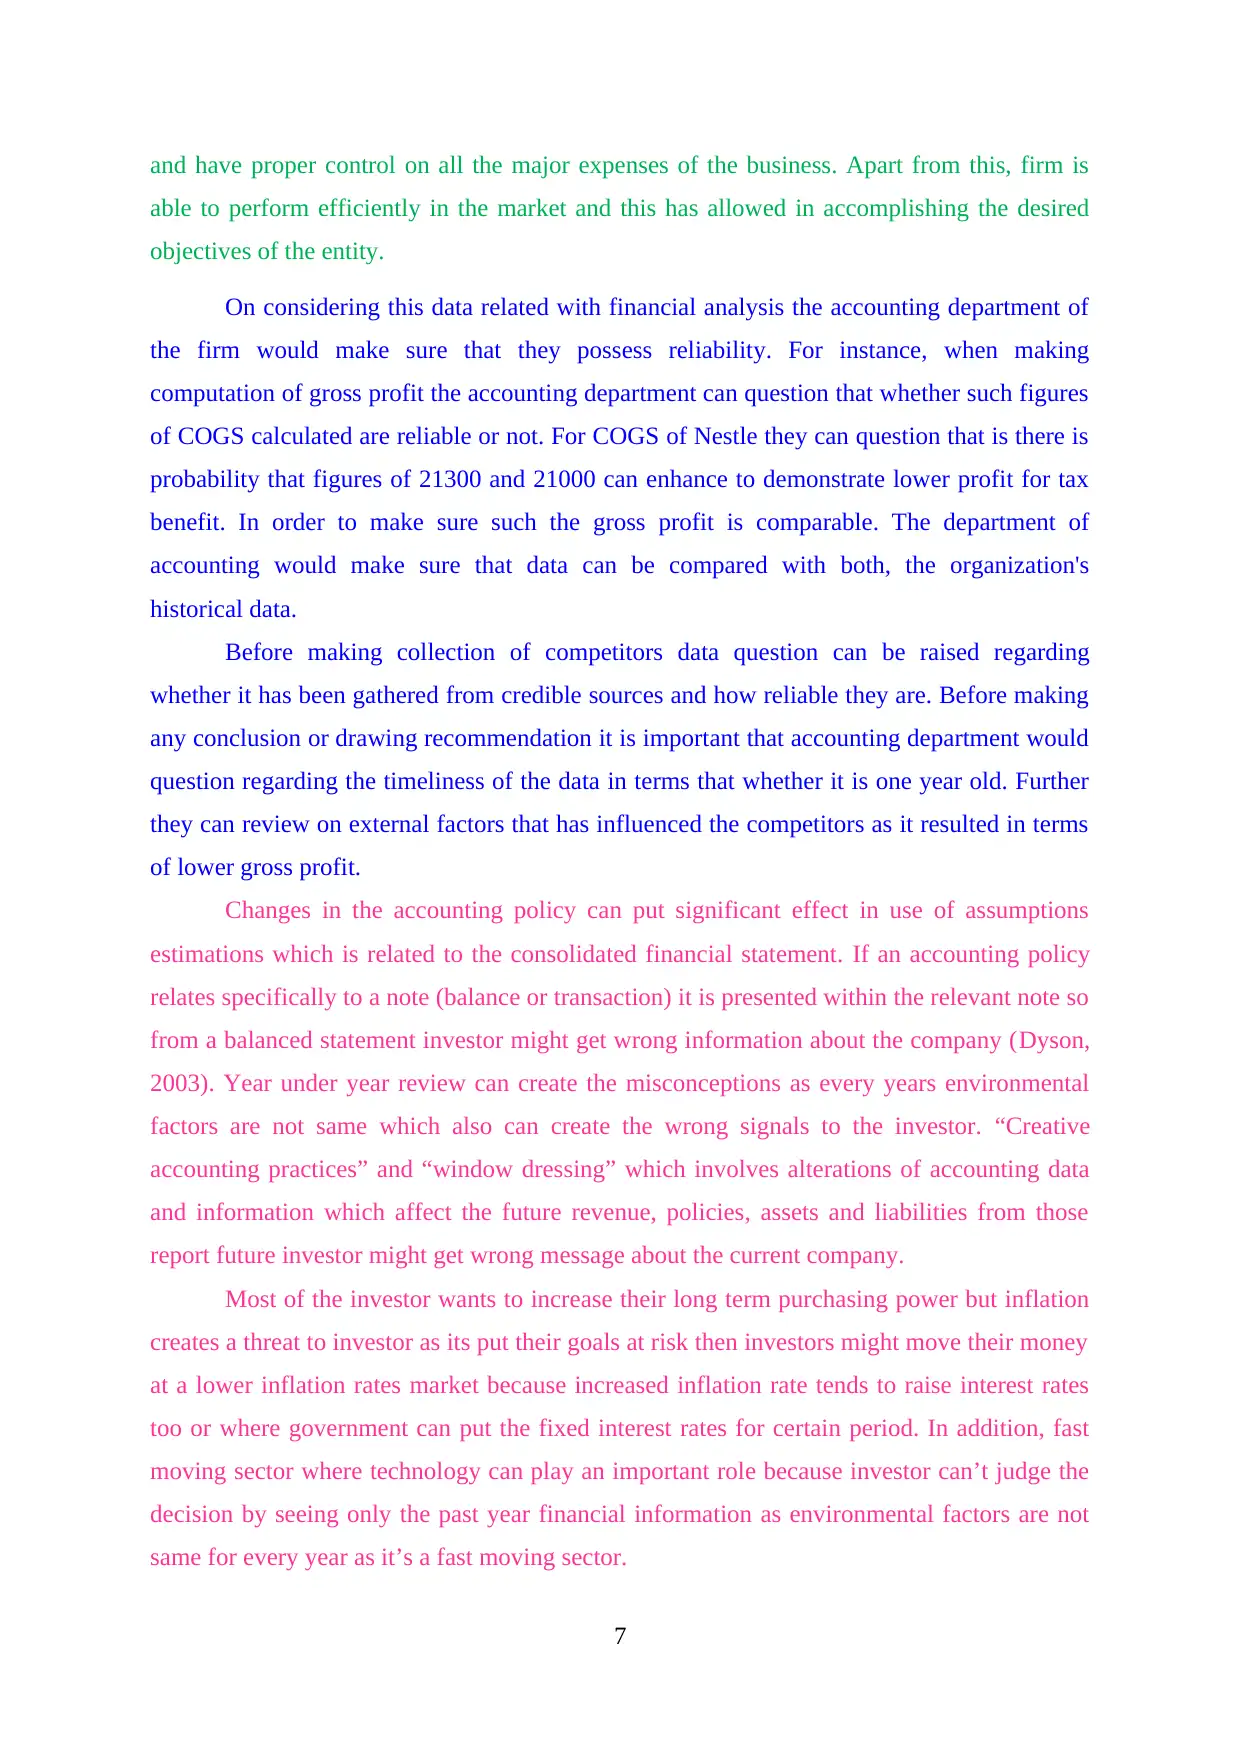
and have proper control on all the major expenses of the business. Apart from this, firm is
able to perform efficiently in the market and this has allowed in accomplishing the desired
objectives of the entity.
On considering this data related with financial analysis the accounting department of
the firm would make sure that they possess reliability. For instance, when making
computation of gross profit the accounting department can question that whether such figures
of COGS calculated are reliable or not. For COGS of Nestle they can question that is there is
probability that figures of 21300 and 21000 can enhance to demonstrate lower profit for tax
benefit. In order to make sure such the gross profit is comparable. The department of
accounting would make sure that data can be compared with both, the organization's
historical data.
Before making collection of competitors data question can be raised regarding
whether it has been gathered from credible sources and how reliable they are. Before making
any conclusion or drawing recommendation it is important that accounting department would
question regarding the timeliness of the data in terms that whether it is one year old. Further
they can review on external factors that has influenced the competitors as it resulted in terms
of lower gross profit.
Changes in the accounting policy can put significant effect in use of assumptions
estimations which is related to the consolidated financial statement. If an accounting policy
relates specifically to a note (balance or transaction) it is presented within the relevant note so
from a balanced statement investor might get wrong information about the company (Dyson,
2003). Year under year review can create the misconceptions as every years environmental
factors are not same which also can create the wrong signals to the investor. “Creative
accounting practices” and “window dressing” which involves alterations of accounting data
and information which affect the future revenue, policies, assets and liabilities from those
report future investor might get wrong message about the current company.
Most of the investor wants to increase their long term purchasing power but inflation
creates a threat to investor as its put their goals at risk then investors might move their money
at a lower inflation rates market because increased inflation rate tends to raise interest rates
too or where government can put the fixed interest rates for certain period. In addition, fast
moving sector where technology can play an important role because investor can’t judge the
decision by seeing only the past year financial information as environmental factors are not
same for every year as it’s a fast moving sector.
7
⊘ This is a preview!⊘
Do you want full access?
Subscribe today to unlock all pages.
Trusted by 1+ million students worldwide
A.C 1.2:-
There are many kinds of investigative elements that are obtainable to companies
include monetary records presenting different types balance statements, weighing scale.
These tools not only help the stakeholders assess the company performance, it also guides the
auditors to monitor the actual performance of the company. Stakeholders must have thorough
knowledge about the company before deciding to invest and financial statements provide the
valid documents necessary for making the decision (Fakhfakh, Zouari and Zouari-Hadiji,
2012).
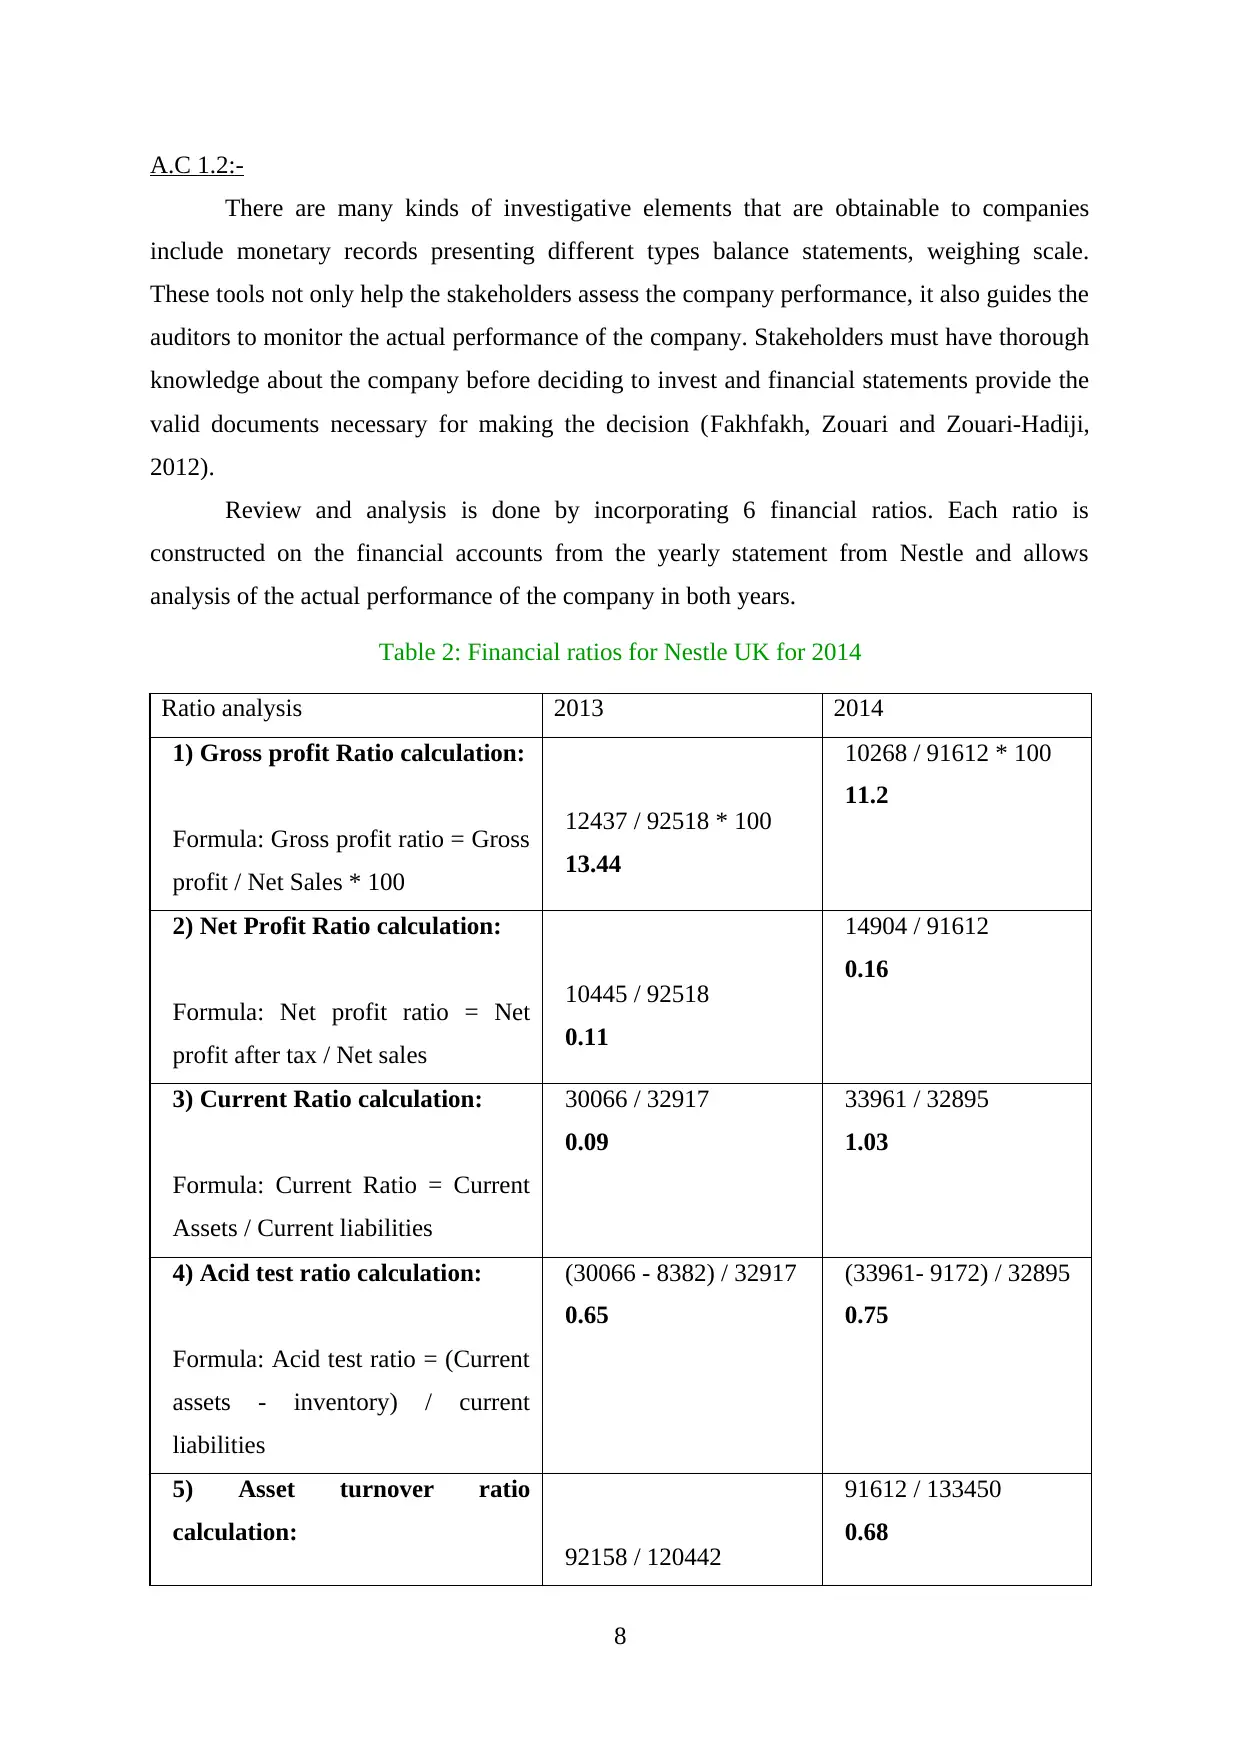
Review and analysis is done by incorporating 6 financial ratios. Each ratio is
constructed on the financial accounts from the yearly statement from Nestle and allows
analysis of the actual performance of the company in both years.
Table 2: Financial ratios for Nestle UK for 2014
Ratio analysis 2013 2014
1) Gross profit Ratio calculation:
Formula: Gross profit ratio = Gross
profit / Net Sales * 100
12437 / 92518 * 100
13.44
10268 / 91612 * 100
11.2
2) Net Profit Ratio calculation:
Formula: Net profit ratio = Net
profit after tax / Net sales
10445 / 92518
0.11
14904 / 91612
0.16
3) Current Ratio calculation:
Formula: Current Ratio = Current
Assets / Current liabilities
30066 / 32917
0.09
33961 / 32895
1.03
4) Acid test ratio calculation:
Formula: Acid test ratio = (Current
assets - inventory) / current
liabilities
(30066 - 8382) / 32917
0.65
(33961- 9172) / 32895
0.75
5) Asset turnover ratio
calculation: 92158 / 120442
91612 / 133450
0.68
8
There are many kinds of investigative elements that are obtainable to companies
include monetary records presenting different types balance statements, weighing scale.
These tools not only help the stakeholders assess the company performance, it also guides the
auditors to monitor the actual performance of the company. Stakeholders must have thorough
knowledge about the company before deciding to invest and financial statements provide the
valid documents necessary for making the decision (Fakhfakh, Zouari and Zouari-Hadiji,
2012).
Review and analysis is done by incorporating 6 financial ratios. Each ratio is
constructed on the financial accounts from the yearly statement from Nestle and allows
analysis of the actual performance of the company in both years.
Table 2: Financial ratios for Nestle UK for 2014
Ratio analysis 2013 2014
1) Gross profit Ratio calculation:
Formula: Gross profit ratio = Gross
profit / Net Sales * 100
12437 / 92518 * 100
13.44
10268 / 91612 * 100
11.2
2) Net Profit Ratio calculation:
Formula: Net profit ratio = Net
profit after tax / Net sales
10445 / 92518
0.11
14904 / 91612
0.16
3) Current Ratio calculation:
Formula: Current Ratio = Current
Assets / Current liabilities
30066 / 32917
0.09
33961 / 32895
1.03
4) Acid test ratio calculation:
Formula: Acid test ratio = (Current
assets - inventory) / current
liabilities
(30066 - 8382) / 32917
0.65
(33961- 9172) / 32895
0.75
5) Asset turnover ratio
calculation: 92158 / 120442
91612 / 133450
0.68
8
Paraphrase This Document
Need a fresh take? Get an instant paraphrase of this document with our AI Paraphraser
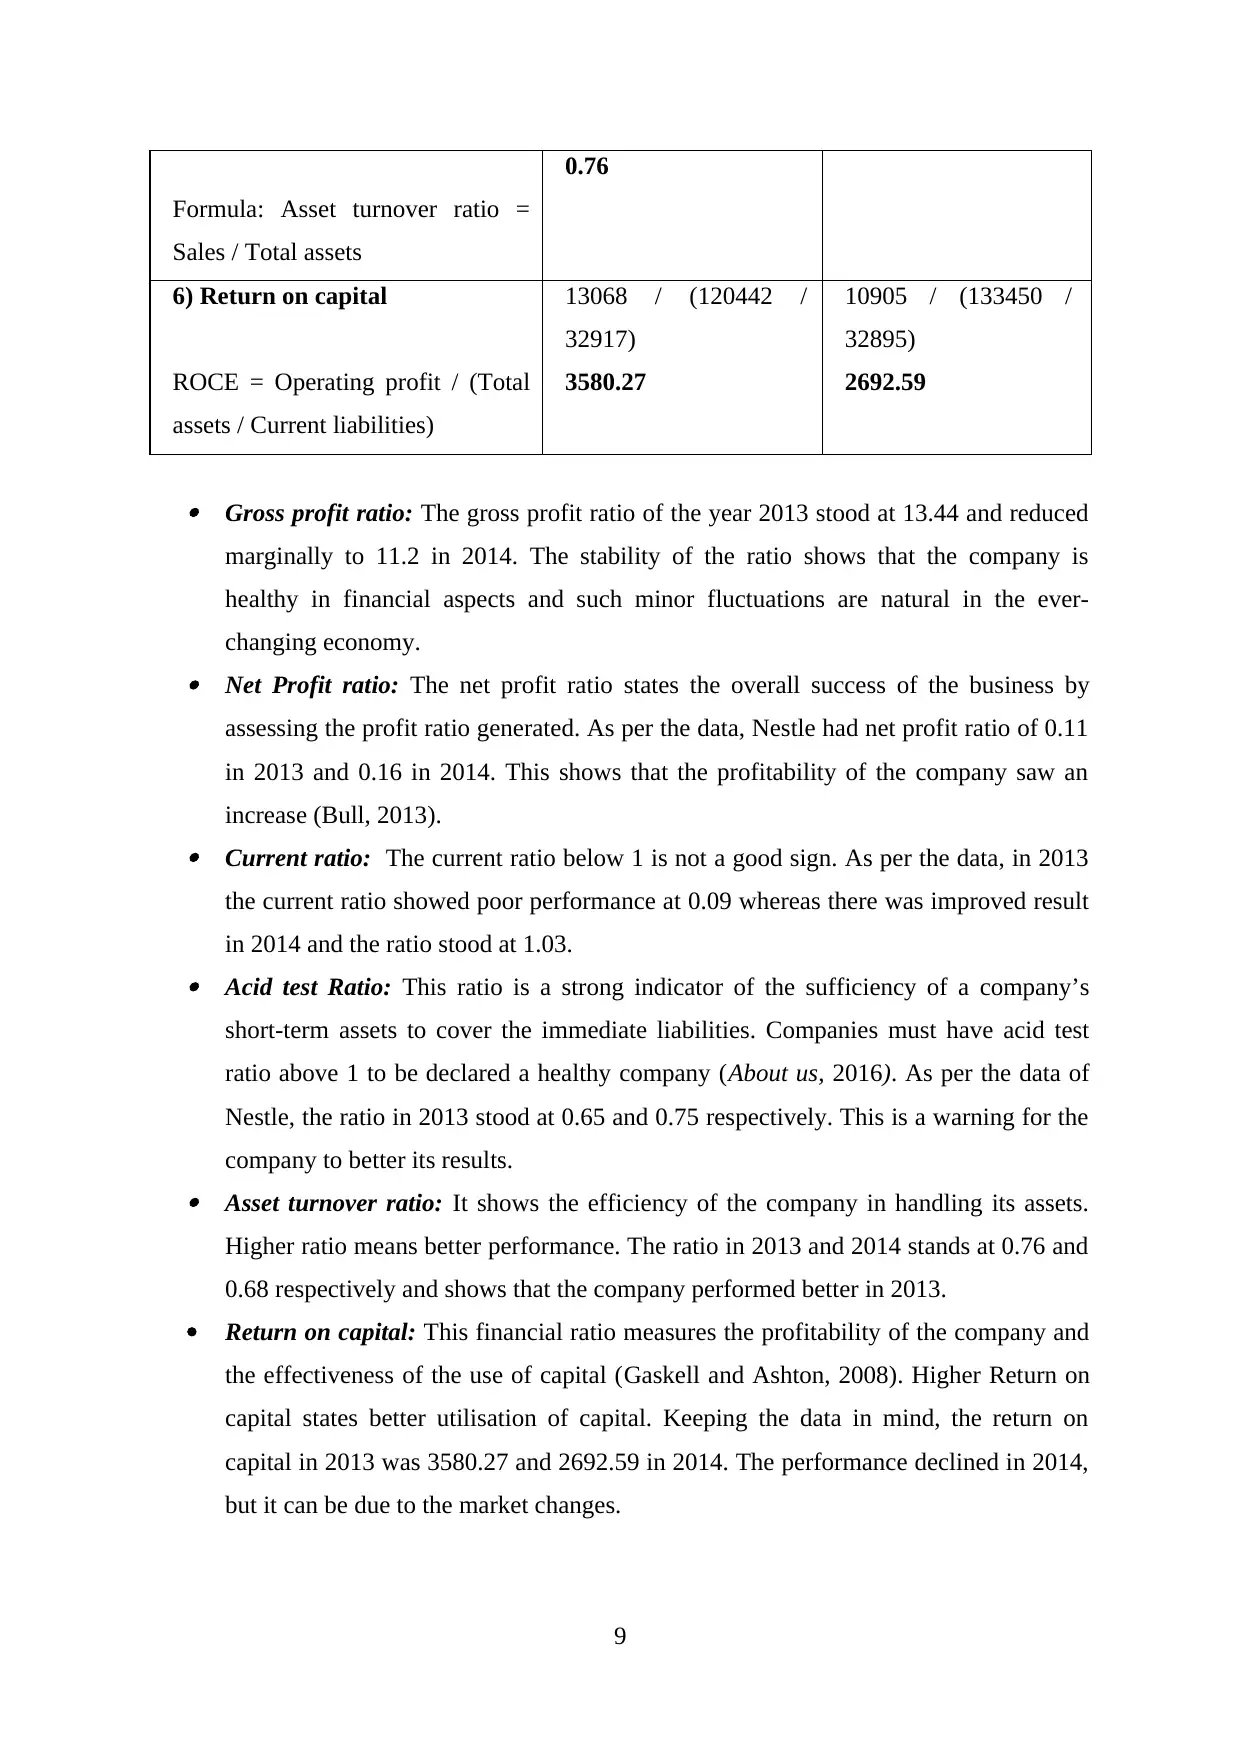
Formula: Asset turnover ratio =
Sales / Total assets
0.76
6) Return on capital
ROCE = Operating profit / (Total
assets / Current liabilities)
13068 / (120442 /
32917)
3580.27
10905 / (133450 /
32895)
2692.59
Gross profit ratio: The gross profit ratio of the year 2013 stood at 13.44 and reduced
marginally to 11.2 in 2014. The stability of the ratio shows that the company is
healthy in financial aspects and such minor fluctuations are natural in the ever-
changing economy. Net Profit ratio: The net profit ratio states the overall success of the business by
assessing the profit ratio generated. As per the data, Nestle had net profit ratio of 0.11
in 2013 and 0.16 in 2014. This shows that the profitability of the company saw an
increase (Bull, 2013). Current ratio: The current ratio below 1 is not a good sign. As per the data, in 2013
the current ratio showed poor performance at 0.09 whereas there was improved result
in 2014 and the ratio stood at 1.03. Acid test Ratio: This ratio is a strong indicator of the sufficiency of a company’s
short-term assets to cover the immediate liabilities. Companies must have acid test
ratio above 1 to be declared a healthy company (About us, 2016). As per the data of
Nestle, the ratio in 2013 stood at 0.65 and 0.75 respectively. This is a warning for the
company to better its results. Asset turnover ratio: It shows the efficiency of the company in handling its assets.
Higher ratio means better performance. The ratio in 2013 and 2014 stands at 0.76 and
0.68 respectively and shows that the company performed better in 2013.
Return on capital: This financial ratio measures the profitability of the company and
the effectiveness of the use of capital (Gaskell and Ashton, 2008). Higher Return on
capital states better utilisation of capital. Keeping the data in mind, the return on
capital in 2013 was 3580.27 and 2692.59 in 2014. The performance declined in 2014,
but it can be due to the market changes.
9
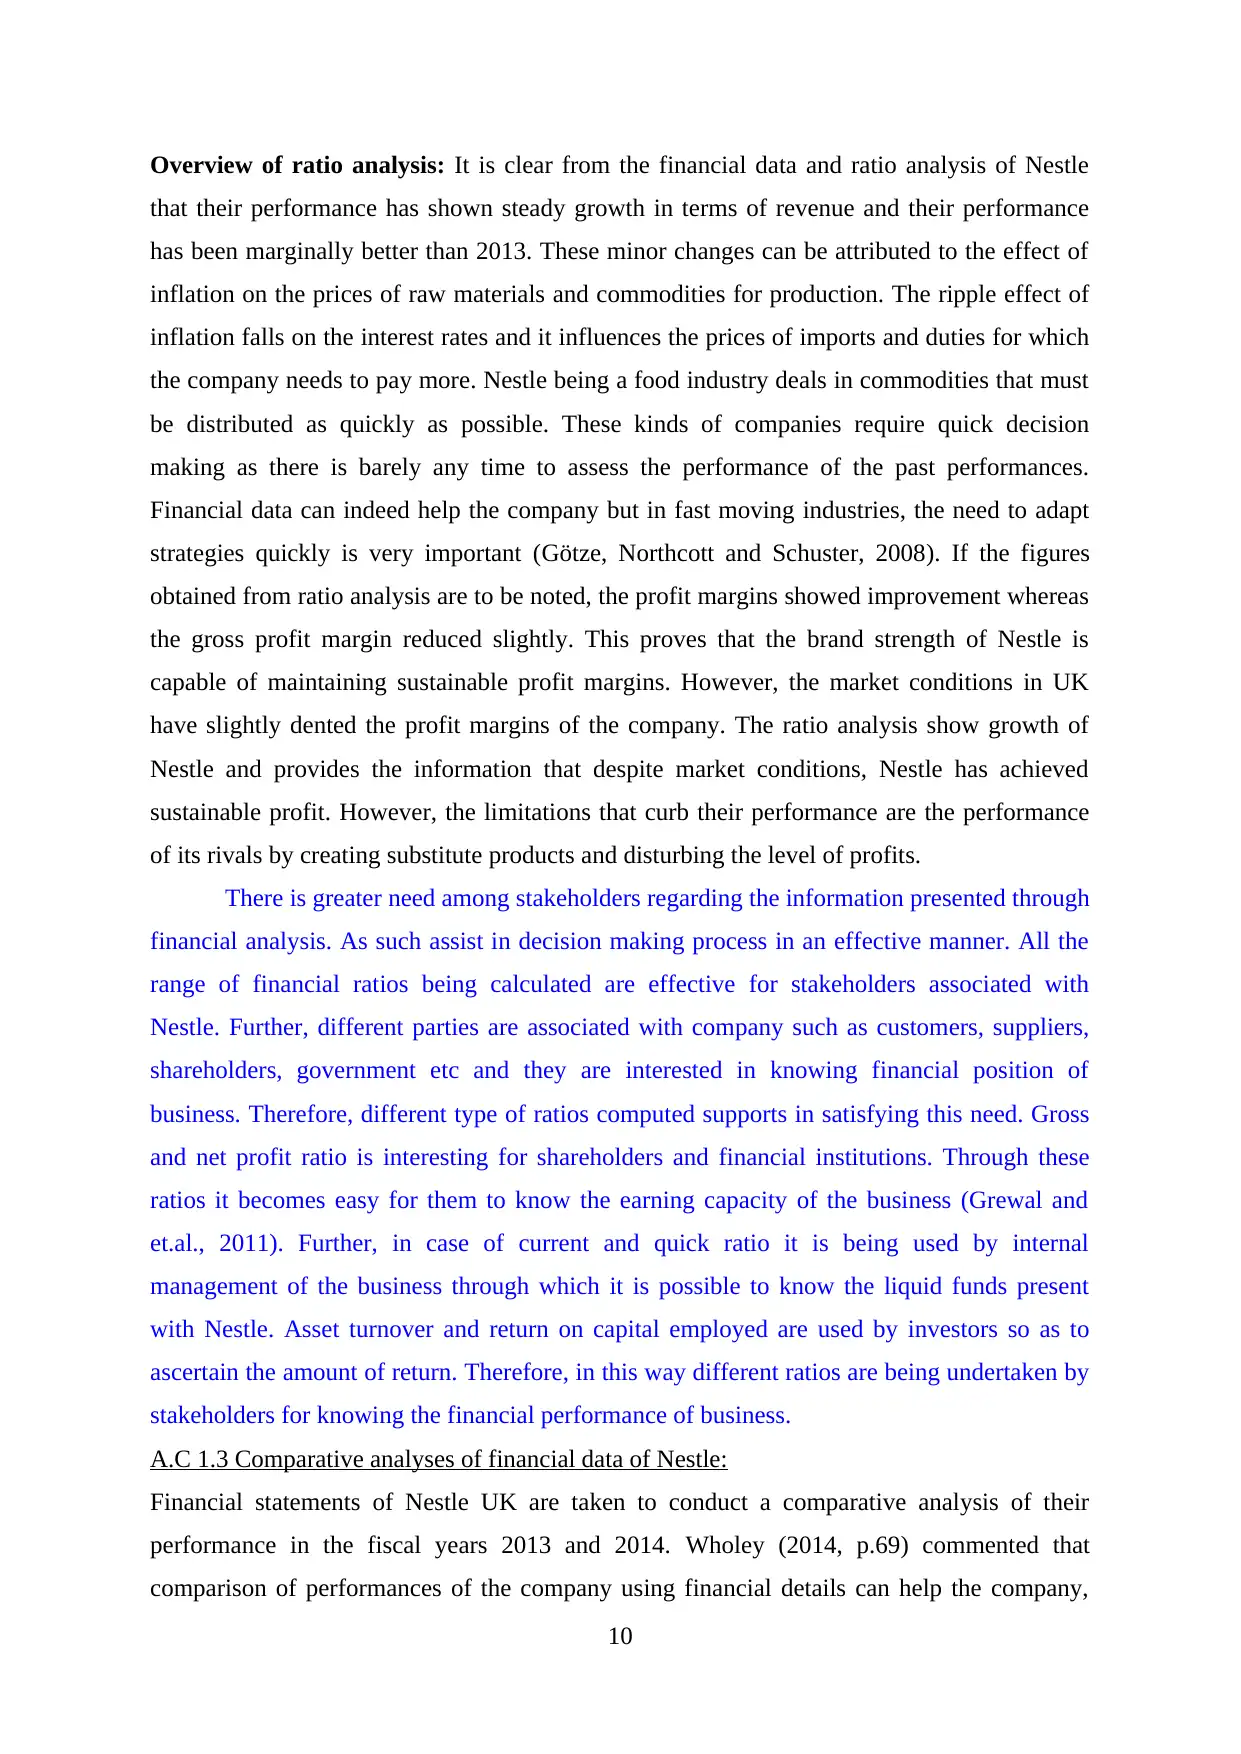
Overview of ratio analysis: It is clear from the financial data and ratio analysis of Nestle
that their performance has shown steady growth in terms of revenue and their performance
has been marginally better than 2013. These minor changes can be attributed to the effect of
inflation on the prices of raw materials and commodities for production. The ripple effect of
inflation falls on the interest rates and it influences the prices of imports and duties for which
the company needs to pay more. Nestle being a food industry deals in commodities that must
be distributed as quickly as possible. These kinds of companies require quick decision
making as there is barely any time to assess the performance of the past performances.
Financial data can indeed help the company but in fast moving industries, the need to adapt
strategies quickly is very important (Götze, Northcott and Schuster, 2008). If the figures
obtained from ratio analysis are to be noted, the profit margins showed improvement whereas
the gross profit margin reduced slightly. This proves that the brand strength of Nestle is
capable of maintaining sustainable profit margins. However, the market conditions in UK
have slightly dented the profit margins of the company. The ratio analysis show growth of
Nestle and provides the information that despite market conditions, Nestle has achieved
sustainable profit. However, the limitations that curb their performance are the performance
of its rivals by creating substitute products and disturbing the level of profits.
There is greater need among stakeholders regarding the information presented through
financial analysis. As such assist in decision making process in an effective manner. All the
range of financial ratios being calculated are effective for stakeholders associated with
Nestle. Further, different parties are associated with company such as customers, suppliers,
shareholders, government etc and they are interested in knowing financial position of
business. Therefore, different type of ratios computed supports in satisfying this need. Gross
and net profit ratio is interesting for shareholders and financial institutions. Through these
ratios it becomes easy for them to know the earning capacity of the business (Grewal and
et.al., 2011). Further, in case of current and quick ratio it is being used by internal
management of the business through which it is possible to know the liquid funds present
with Nestle. Asset turnover and return on capital employed are used by investors so as to
ascertain the amount of return. Therefore, in this way different ratios are being undertaken by
stakeholders for knowing the financial performance of business.
A.C 1.3 Comparative analyses of financial data of Nestle:
Financial statements of Nestle UK are taken to conduct a comparative analysis of their
performance in the fiscal years 2013 and 2014. Wholey (2014, p.69) commented that
comparison of performances of the company using financial details can help the company,
10
⊘ This is a preview!⊘
Do you want full access?
Subscribe today to unlock all pages.
Trusted by 1+ million students worldwide
1 out of 23
Related Documents


Your All-in-One AI-Powered Toolkit for Academic Success.
+13062052269
info@desklib.com
Available 24*7 on WhatsApp / Email
![[object Object]](/_next/static/media/star-bottom.7253800d.svg)
Unlock your academic potential
Copyright © 2020–2026 A2Z Services. All Rights Reserved. Developed and managed by ZUCOL.