Financial Management: Portfolio Analysis & EMH on SGX Stocks
VerifiedAdded on 2023/05/30
|23
|6785
|272
Report
AI Summary
This report provides a comprehensive analysis of two Singapore stock portfolios, one constructed using technical analysis and the other using fundamental analysis, with a notional investment of SGD 100,000 split equally between them. The study aims to evaluate the performance of each portfolio and compare them, considering the Efficient Market Hypothesis (EMH). It includes a literature review discussing EMH, random walk theory, and behavioral finance. The methodology involves selecting 20 Singapore companies listed on the FTSE ST All Share Index, dividing them into two portfolios of 10 companies each. Technical analysis employs methods like line charts and moving averages, while fundamental analysis utilizes dividend discount and PE multiple models to assess stock valuation. The report includes an analysis of individual stocks from each portfolio, such as Global Logistics Limited for fundamental analysis and Chip Eng Seng for technical analysis, and concludes with a comparative evaluation of both portfolios' performance.
Running Head: Financial Management
1
Project Report: Financial Management
1
Project Report: Financial Management
Paraphrase This Document
Need a fresh take? Get an instant paraphrase of this document with our AI Paraphraser
Financial Management
2
Contents
Introduction.......................................................................................................................3
Literature review...............................................................................................................3
Rational and methodology................................................................................................6
Results and analysis..........................................................................................................7
Analysis of one Stock from Fundamental Portfolio.....................................................7
PE Multiple Model...................................................................................................8
Analysis of a Stock from Technical Portfolio..............................................................8
Moving Average:......................................................................................................9
Evaluation of Performance of both the Portfolios:.......................................................9
Conclusion........................................................................................................................9
References.......................................................................................................................10
Appendix.........................................................................................................................12
Financial Management
3
Introduction:
Fundamental and technical analysis is the market analysis method which valuates the
stock price and other factors of the portfolio and individuals security in order to measure the
investment level in the stock. In this report, fundamental and technical analysis both has been
done on the 20 Singapore companies in order to measure their performance and position of
investment. 10-10 companies have been chosen for the both the analysis method to evaluate
that which portfolio is doing better and what is the level of investment in each of the group.
Technical analysis method evaluates the investment decision of a security through
looking over the supply and demand of the stock of that organization where in case of
fundamental analysis, the intrinsic value of a stock is calculated to identify the performance
and the level of investment in that company (Kinsky, 2011). The fair value of stock is
measured in this method to make decision about the investment in the comapny.
Literature review:
The Efficient Market Hypothesis (EMH) depends on an activity of a hypothesis which
is known s “random walk theory," It is utilized to separate a value arrangement, where the
historical price could change the current offer cost of a specific stock. The thought of random
walk theory rationale delineate that if the data stream is unchecked and the data have a brisk
reflection over the stock costs, at that point the value change on tomorrow would portray just
news about future and it would likewise be autonomous in worry to the present value
changes. Besides news right now would by rash and in this manner value changes ought to be
imprudent and easygoing (Madura, 2014). As a result, the offer costs would completely
mirror all the new data and still uninformed financial specialists exchanging an enhanced
⊘ This is a preview!⊘
Do you want full access?
Subscribe today to unlock all pages.
Trusted by 1+ million students worldwide
Financial Management
4
portfolio over the cost in the market and would get a rate of return as liberal as that achieved
by the specialists.
As indicated by Schlichting, (2013), changes in the stock cost are free from one another
and they additionally have the comparable likelihood conveyance. The costs of a stock are
ordinarily known as flighty and irregular. It has been contended by Phillips and Stawarski,
(2016), that the market and the stocks may be similarly as self-assertive as flipping a coin
while Madura (2014) has delineated into an investigation that stock costs generally clarify
arbitrary strolls all through a period. The adjustments in the costs are rash since they occur
just in response to truly new data though as indicated by a reality it is very new.
Further, the behavioural finance is only an examination over the speculator showcase
conduct which gets from psychosomatic standards of settling on the choice. It is regularly
used to clarify that why speculators move or purchase an item. This idea of social science is
identified with the intellectual brain research hypothesis which portrays about the human
basic leadership process and furthermore delineates the client about the budgetary market
financial matters. This idea centres upon how investors translate and continue on data to
settle on a choice about educated venture. It has been investigated through an examination by
Palicka, (2011) that Investors don't always act in a typical, ordinary and an unprejudiced way.
This idea of conduct back delineates around an accentuation upon investor conduct
prompting an assortment of market inconsistency.
As indicated by Palicka (2011), Behavioural Finance is an examination about brain
science that how it influences the investment choice process and the monetary market of an
investor and a state individually. As per Kurth, (2013), social back is a basic and great idea to
settle on a superior choice about speculation. Additionally it has been expressed by Madura
(2014) that Behavioural back is the investigation of the weight of brain science on the
Paraphrase This Document
Need a fresh take? Get an instant paraphrase of this document with our AI Paraphraser
Financial Management
5
specialists' conduct in worry of fund and the progressive impact on financial markets. Further
it has been examined that some money related things are plausible to rely on the investors
less adjusted conduct that outcomes from partialities, psychosomatic factors and heuristics.
As indicated by the EMH, the financing markets are instructive proficient. Each
individual could have entrée to possible data and as a result; the news of speculation couldn't
be enslaved. However, the correct speculative imitation has produced generous discussion in
worry of 2 ideas which are access and accessibility. From the point of view of investors, it is
very simple for each person to have an entrance for gathering the data about the market;
while on the off chance that it set in motion than it don't happen. Every day custom and
assorted ways of life involve differing available time and strategy to have permission to data
about the market. Regularly, in the procedures of venture, data is reachable just to an
incomplete gathering of investors or it is possible to theorists some time before it transforms
into realistic to the normal network (Elton, Gruber, Brown and Goetzmann, 2009). In this
manner, the general population who have the information about the EMH, must work in an
effective way. Aside from the various huge components, the data is very mandatory for each
investor to keep up and settle on the choice likewise.
The strategies which have been utilized to look at the securities and figure the venture
results fall into two gatherings: basic examination and specialized investigation. In the
speculation forms, for safeguarding a long relationship with the organization and contribute
the sum for a more extended period, principal investigation is a decent decision for a financial
specialist. As such, when a speculator is endeavouring to evaluate the monetary information,
he or she will in general shape a picture of the enterprise to be joined in their portfolios and
they a short time later encourage an affirmation association with the organization (Krantz,
Financial Management
6
2016). In the situation of EMH, crucial examination has been supplanted by the semi solid
model shape proficiency".
Efficient Market Hypothesis (EMH) can't help contradicting the accentuation which has
been put by the specialized examination on breaking down over the costs heading through the
past market information study and it likewise proposes that analysis methodology ought to be
associated with current costs and market data. In result, the recorded improvement and
bearing of a partnership or speculation system are completely pondered their crash on venture
choice process (Kisky, 2011). Past market information and graphs ought not to be in the
primary focal point of explore or this portrays to accomplish significant yields, yet they
should not be just enchanted as memories. In any case, the rule that "economy keeps running
around" and “the history always repeat itself” have been strappingly featured for the financial
specialists and people.
As of now it has been expressed that Behavioural Finance is a system with
interdisciplinary that consolidates the components from human science, history humanities
and brain research. Thus its hypothetical perspectives are more perplexing in comparison to
Efficient Market Hypothesis (EMH) that misrepresented as a very rearranged or unpractised
methodology. The potential expenses for financial specialists, however, are very genuine. In
refinement, Behavioural Finance, on clarification of its perplexing and creative nature does
not seem, by all accounts, to be broadly acknowledged by the mass of the contributing
gathering of individuals as a moment (Baker and Nofsinger, 2010). In spite of the fact that the
decision making is one of the crucial factors for the investors, they take concern on the
various factors and significant changes in the stock price of the business.
Rational and methodology:
⊘ This is a preview!⊘
Do you want full access?
Subscribe today to unlock all pages.
Trusted by 1+ million students worldwide
Financial Management
7
In order to conduct this study and research, 20 Singapore companies have been
focused. 2 portfolios (technical portfolio and fundamental portfolio) have been prepared for
this report. Each of the portfolio consist 10 companies.
Technical analysis evaluation has been done to evaluate the data of the company
which represents that the demand and supply if each of the stock must be measured in order
to evaluate that whether the stock is a good choice for the purpose of investment or not
whereas, the fundamental analysis evaluates the overall financial position of the business to
measure that whether the company is a good choice for the investment or not (Baker and
Nofsinger, 2010). The major difference among both the analysis method is that technical
analysis is used by the companies in order to invest for short term whereas the fundamental
analysis study is done by the investors to evaluate the long term performance of the business.
The Singapore dollar 100000 is to be invested in both the portfolios in order to improve the
return and reduce the risk level of the investors.
In this study, the different methods of fundamental analysis and technical analysis
have been applied on the stock and the profile to measure the total return from the portfolio.
The portfolios companies have been chosen in the research are on the basis of their market
capital, attractiveness of the stock in the market and the overall performance of the business.
The companies have been segregated in the portfolios on the basis of fluctuations in the stock
price and the sensible choices. In the current scenario, 2 portfolios have been shaped by the
investors and the financial analyst to identify that how much return could be got from the
portfolios and the total investment of SGD 1,00,000 (Appendix).
Results and analysis:
Paraphrase This Document
Need a fresh take? Get an instant paraphrase of this document with our AI Paraphraser
Financial Management
8
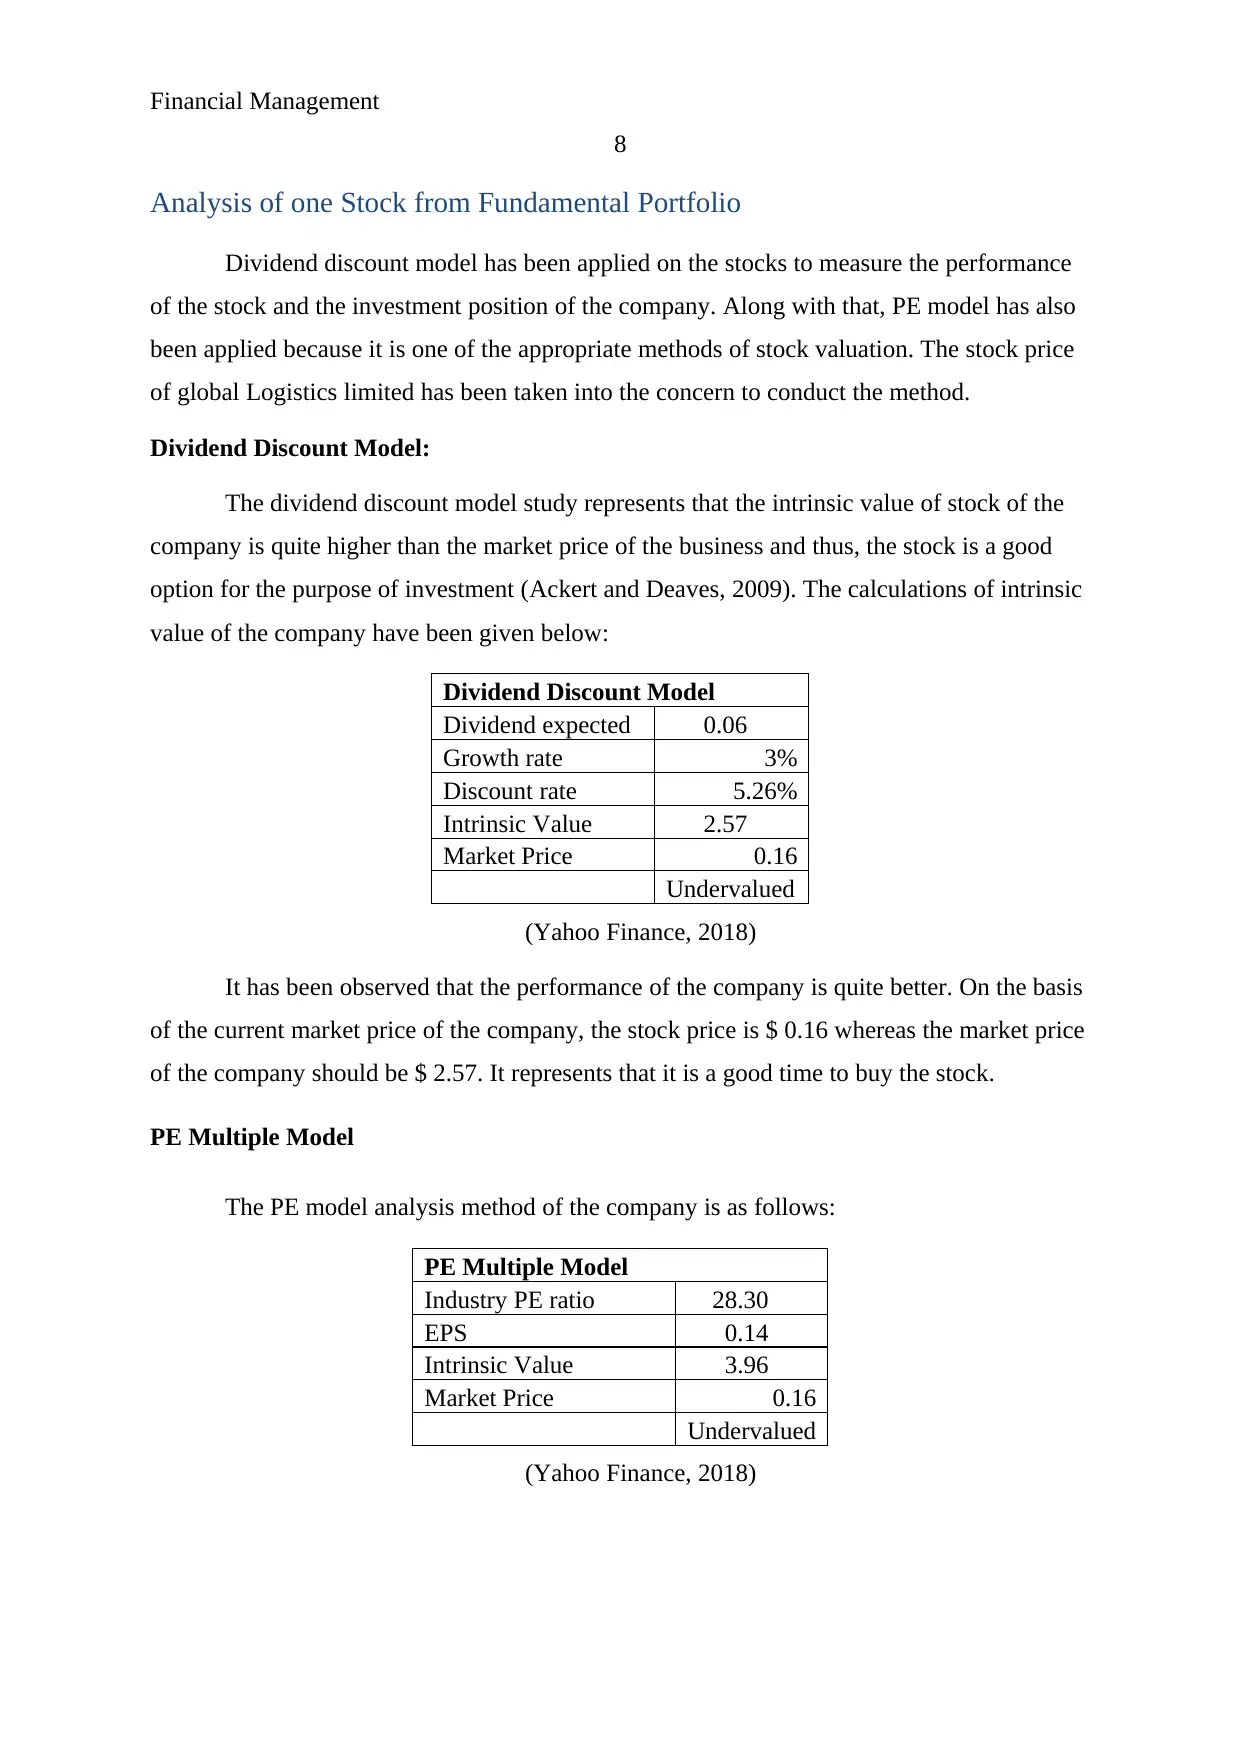
Analysis of one Stock from Fundamental Portfolio
Dividend discount model has been applied on the stocks to measure the performance
of the stock and the investment position of the company. Along with that, PE model has also
been applied because it is one of the appropriate methods of stock valuation. The stock price
of global Logistics limited has been taken into the concern to conduct the method.
Dividend Discount Model:
The dividend discount model study represents that the intrinsic value of stock of the
company is quite higher than the market price of the business and thus, the stock is a good
option for the purpose of investment (Ackert and Deaves, 2009). The calculations of intrinsic
value of the company have been given below:
Dividend Discount Model
Dividend expected 0.06
Growth rate 3%
Discount rate 5.26%
Intrinsic Value 2.57
Market Price 0.16
Undervalued
(Yahoo Finance, 2018)
It has been observed that the performance of the company is quite better. On the basis
of the current market price of the company, the stock price is $ 0.16 whereas the market price
of the company should be $ 2.57. It represents that it is a good time to buy the stock.
PE Multiple Model
The PE model analysis method of the company is as follows:
PE Multiple Model
Industry PE ratio 28.30
EPS 0.14
Intrinsic Value 3.96
Market Price 0.16
Undervalued
(Yahoo Finance, 2018)
8
Analysis of one Stock from Fundamental Portfolio
Dividend discount model has been applied on the stocks to measure the performance
of the stock and the investment position of the company. Along with that, PE model has also
been applied because it is one of the appropriate methods of stock valuation. The stock price
of global Logistics limited has been taken into the concern to conduct the method.
Dividend Discount Model:
The dividend discount model study represents that the intrinsic value of stock of the
company is quite higher than the market price of the business and thus, the stock is a good
option for the purpose of investment (Ackert and Deaves, 2009). The calculations of intrinsic
value of the company have been given below:
Dividend Discount Model
Dividend expected 0.06
Growth rate 3%
Discount rate 5.26%
Intrinsic Value 2.57
Market Price 0.16
Undervalued
(Yahoo Finance, 2018)
It has been observed that the performance of the company is quite better. On the basis
of the current market price of the company, the stock price is $ 0.16 whereas the market price
of the company should be $ 2.57. It represents that it is a good time to buy the stock.
PE Multiple Model
The PE model analysis method of the company is as follows:
PE Multiple Model
Industry PE ratio 28.30
EPS 0.14
Intrinsic Value 3.96
Market Price 0.16
Undervalued
(Yahoo Finance, 2018)
Financial Management
9
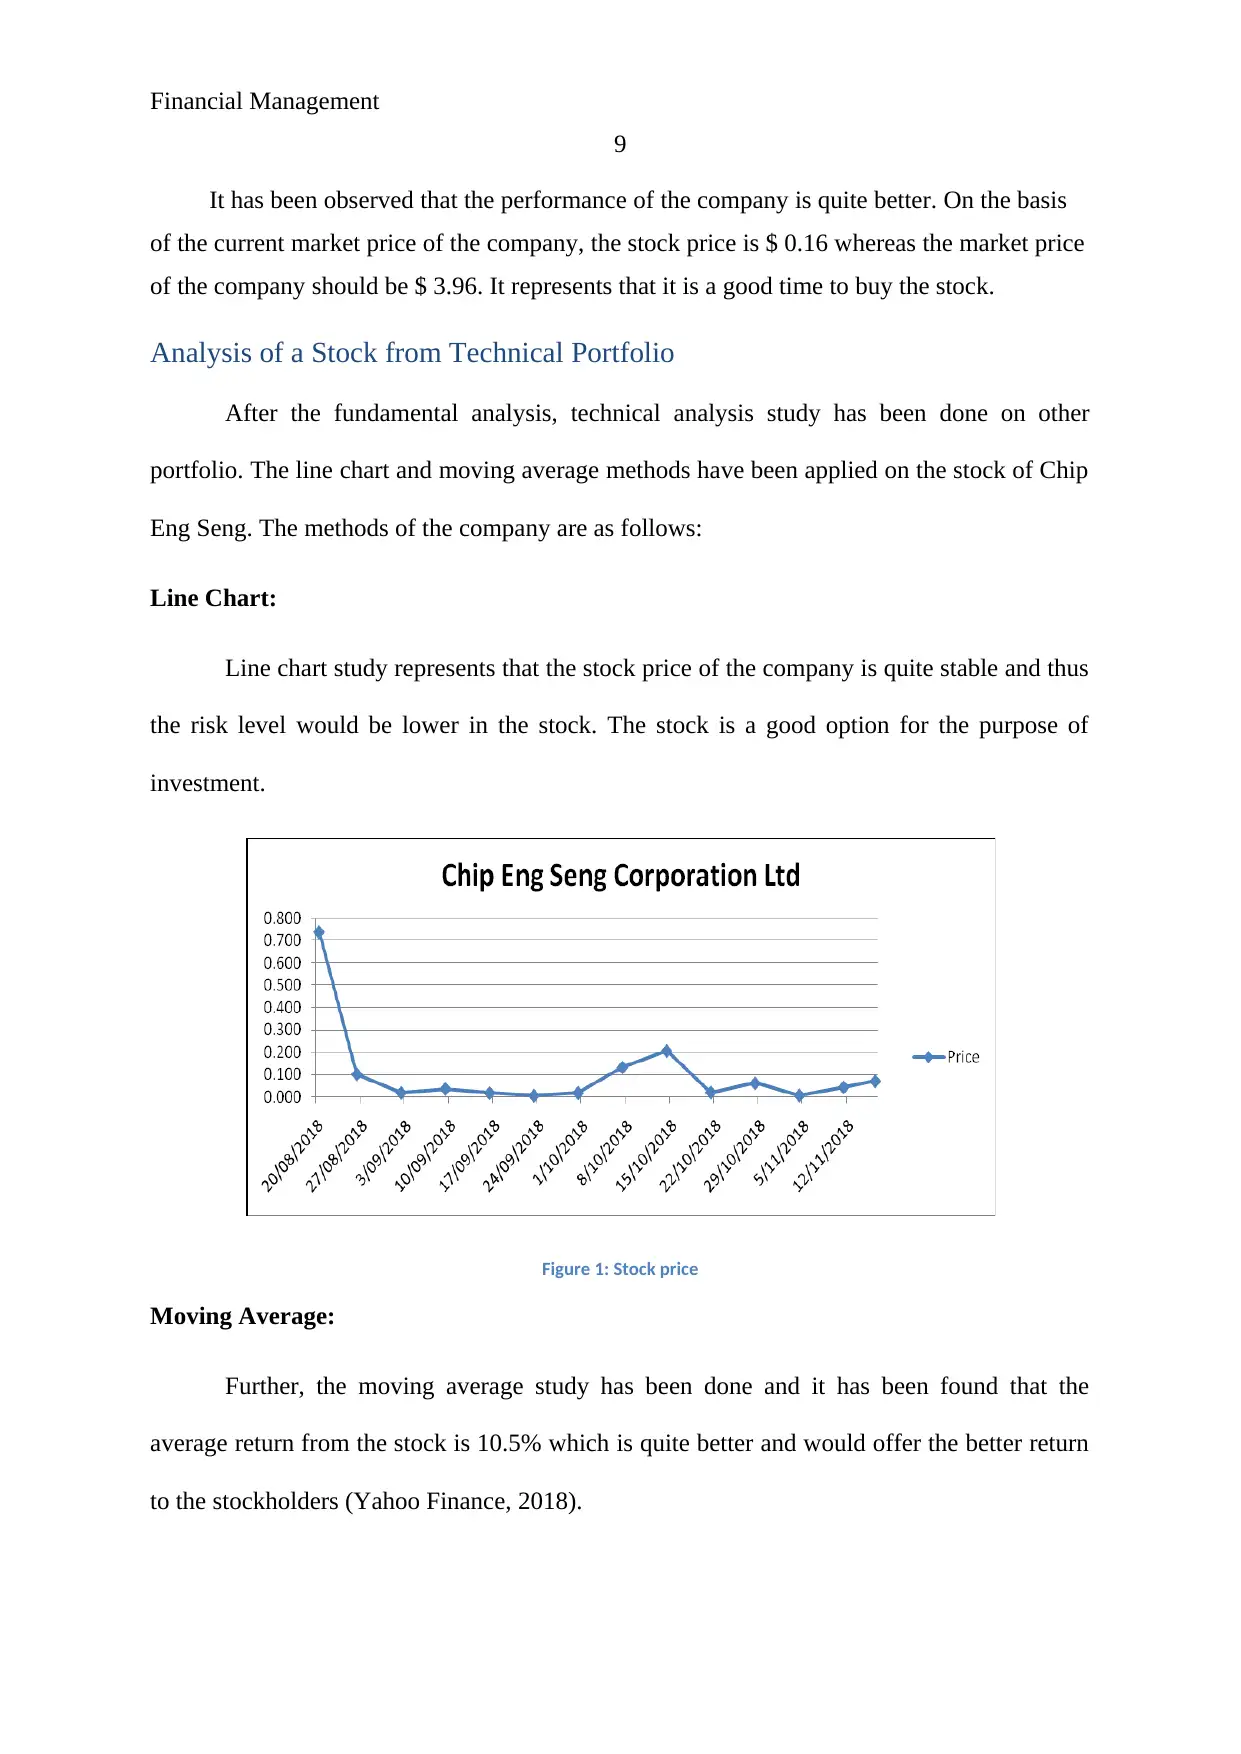
It has been observed that the performance of the company is quite better. On the basis
of the current market price of the company, the stock price is $ 0.16 whereas the market price
of the company should be $ 3.96. It represents that it is a good time to buy the stock.
Analysis of a Stock from Technical Portfolio
After the fundamental analysis, technical analysis study has been done on other
portfolio. The line chart and moving average methods have been applied on the stock of Chip
Eng Seng. The methods of the company are as follows:
Line Chart:
Line chart study represents that the stock price of the company is quite stable and thus
the risk level would be lower in the stock. The stock is a good option for the purpose of
investment.
Figure 1: Stock price
Moving Average:
Further, the moving average study has been done and it has been found that the
average return from the stock is 10.5% which is quite better and would offer the better return
to the stockholders (Yahoo Finance, 2018).
9
It has been observed that the performance of the company is quite better. On the basis
of the current market price of the company, the stock price is $ 0.16 whereas the market price
of the company should be $ 3.96. It represents that it is a good time to buy the stock.
Analysis of a Stock from Technical Portfolio
After the fundamental analysis, technical analysis study has been done on other
portfolio. The line chart and moving average methods have been applied on the stock of Chip
Eng Seng. The methods of the company are as follows:
Line Chart:
Line chart study represents that the stock price of the company is quite stable and thus
the risk level would be lower in the stock. The stock is a good option for the purpose of
investment.
Figure 1: Stock price
Moving Average:
Further, the moving average study has been done and it has been found that the
average return from the stock is 10.5% which is quite better and would offer the better return
to the stockholders (Yahoo Finance, 2018).
⊘ This is a preview!⊘
Do you want full access?
Subscribe today to unlock all pages.
Trusted by 1+ million students worldwide
Financial Management
10
Evaluation of Performance of both the Portfolios:
On the basis of evaluation on both the portfolios, it has been concluded that the
portfolio-2 (technical portfolio) is better option. Investing into this portfolio would offer
return around 5%. The holding period return and the other factors also brief that if the
investors wants to invest for long term than fundamental portfolio is better or vice-versa.
Conclusion:
To conclude, both the portfolios are performing well. It deepens on the investor’s
choice to invest in which portfolio as both of them focuses on the different aspect and offer
the result on the basis of the time period of investment.
Paraphrase This Document
Need a fresh take? Get an instant paraphrase of this document with our AI Paraphraser
Financial Management
11
References:
Ackert, L. & Deaves, R. (2009). Behavioral Finance: Psychology, Decision-Making, &
Markets. Cengage Learning.
Baker, H.K. & Nofsinger, J.R. (2010). Behavioral Finance: Investors, Corporations, &
Markets. John Wiley & Sons.
Elton, E.J., Gruber, M.J., Brown, S.J., & Goetzmann, W.N. (2009). Modern Portfolio Theory
& Investment Analysis. John Wiley & Sons.
Kinsky, R. (2011). Charting Made Simple: A Beginner's Guide to Technical Analysis. John
Wiley & Sons.
Krantz, M. (2016). Fundamental Analysis for Dummies. John Wiley & Sons.
Kurth, S. (2013). Critical Review about Implications of the Efficient Market Hypothesis.
GRIN Verlag.
Madura, J. (2014). Financial Markets & Institutions. Cengage Learning.
Palicka, V.J. (2011). Fusion Analysis: Merging Fundamental & Technical Analysis for Risk-
Adjusted Excess Returns. McGraw Hill Professional.
Phillips, P.P. & Stawarski, C.A. (2016). Data Collection: Planning for & Collecting All
Types of Data. John Wiley & Sons.
Schlichting, T. (2013). Fundamental Analysis, Behavioral Finance & Technical Analysis on
the Stock Market. GRIN Verlag.
Yahoo finance. (2018). SBS transit Limited: Key Statics. [Online]. Retrieved from:
https://sg.finance.yahoo.com/quote/SBVV.SI/history?p=SBVV.SI

Financial Management
12
Yahoo finance. (2018). Chip eng Seng corporation limited: Key Statics. [Online]. Retrieved
from: https://sg.finance.yahoo.com/quote/C(29.SI/history?p=C(29.SI
Yahoo finance. (2018. Global Logistic Properties Limited. [Online]. Retrieved from:
https://finance.yahoo.com/quote/MC0.SI/profile?p=MC0.SI7
⊘ This is a preview!⊘
Do you want full access?
Subscribe today to unlock all pages.
Trusted by 1+ million students worldwide
1 out of 23
Related Documents


Your All-in-One AI-Powered Toolkit for Academic Success.
+13062052269
info@desklib.com
Available 24*7 on WhatsApp / Email
![[object Object]](/_next/static/media/star-bottom.7253800d.svg)
Unlock your academic potential
Copyright © 2020–2026 A2Z Services. All Rights Reserved. Developed and managed by ZUCOL.