Financial Management Principles Project Report - BTEC Level 7
VerifiedAdded on 2023/06/04
|22
|5088
|383
Report
AI Summary
This project report delves into key financial management principles, addressing topics such as cost concepts, costing systems, forecasting techniques, budgeting, and investment appraisal. The report begins by examining the importance of cost in pricing strategies and proposes a costing system suitable for a service-based organization, followed by potential improvements. It then explores forecasting techniques and cash flow statements, along with sensitivity analyses and sources of funds. Budgetary tasks, master budget creation, and budgetary monitoring processes are discussed. The report also covers cost reduction strategies, activity-based costing, and cost allocation. Furthermore, it assesses financial viability through financial ratios and provides recommendations. The document includes detailed calculations, financial appraisal methods for evaluating investment projects, and an analysis of strategic investment decisions. Finally, the report concludes with an evaluation of the business's financial viability using financial ratios and offers recommendations for improvement.
Running Head: Financial management Principles
1
.
Project Report: Financial management Principles
1
.
Project Report: Financial management Principles
Paraphrase This Document
Need a fresh take? Get an instant paraphrase of this document with our AI Paraphraser
Financial management Principles
2
Contents
Que 1:................................................................................................................................3
Importance of cost in pricing strategy:.........................................................................3
Costing system for SADIDA SDN BHD:....................................................................3
Potential improvements:...............................................................................................3
Fixed cost and variable cost:.....................................................................................3
Operating leverage, financial leverage and total leverage:.......................................4
Que 2:................................................................................................................................6
Forecasting techniques..................................................................................................6
Cash flow statement..................................................................................................6
Sensitive statement...................................................................................................6
Source of funds.............................................................................................................7
Cash schedule...........................................................................................................7
Cost of funds.............................................................................................................7
Que 3:................................................................................................................................8
Appropriate budgetary task:.........................................................................................8
Master budget creation:................................................................................................9
Actual expenditure:.....................................................................................................10
Budgetary monitoring process:...................................................................................11
Que 4:..............................................................................................................................11
Process to reduce the cost...........................................................................................11
Activity based costing.................................................................................................12
Cost allocation:.......................................................................................................12
Financial management Principles
3
Schedule:.................................................................................................................12
Que 5:..............................................................................................................................13
Calculations:...................................................................................................................13
Financial appraisal method to evaluate the investment project:.................................15
Strategic investment decision:....................................................................................15
Appropriateness of strategic investment decision:.....................................................15
Que 6:..............................................................................................................................16
Financial viability of the business:.............................................................................16
Financial ratios:..........................................................................................................16
Recommendation:.......................................................................................................19
References.......................................................................................................................20
⊘ This is a preview!⊘
Do you want full access?
Subscribe today to unlock all pages.
Trusted by 1+ million students worldwide
Financial management Principles
4
Que 1:
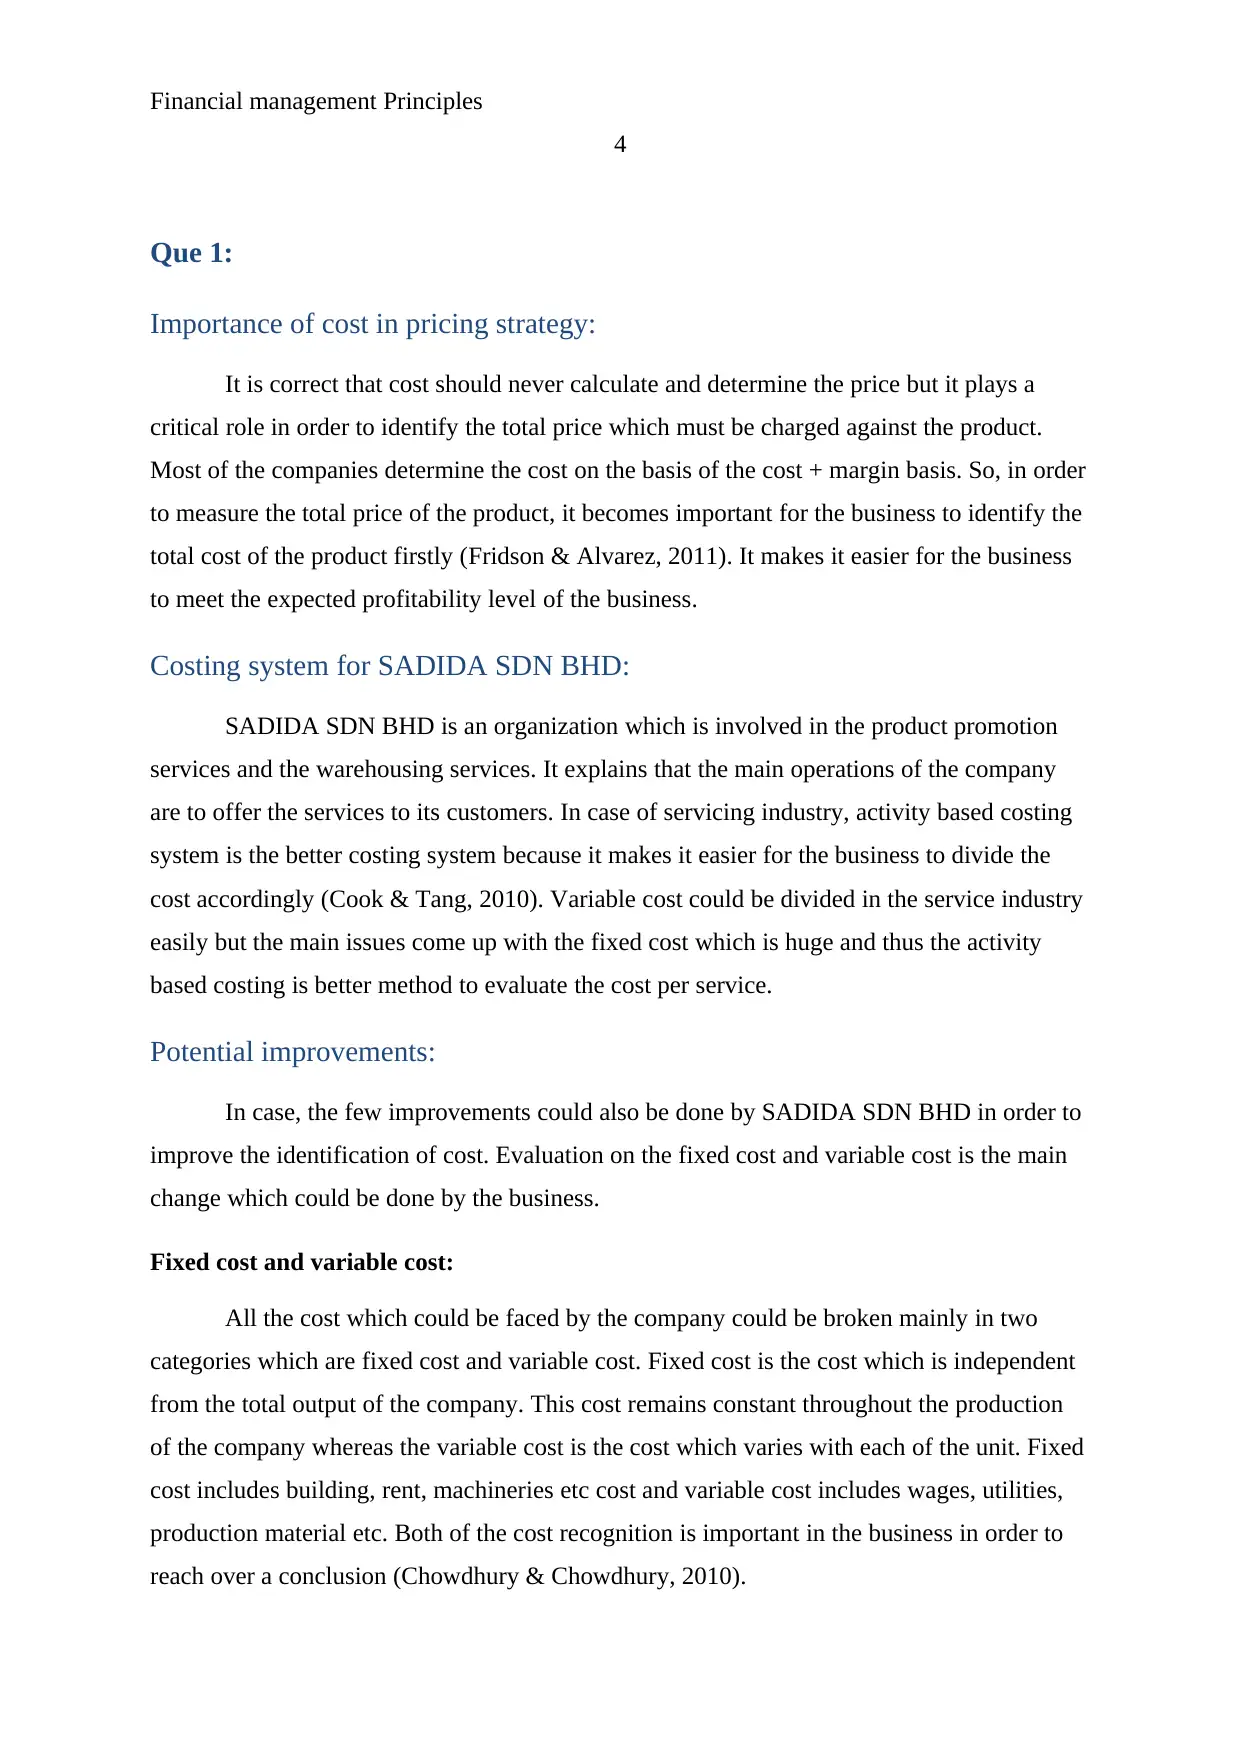
Importance of cost in pricing strategy:
It is correct that cost should never calculate and determine the price but it plays a
critical role in order to identify the total price which must be charged against the product.
Most of the companies determine the cost on the basis of the cost + margin basis. So, in order
to measure the total price of the product, it becomes important for the business to identify the
total cost of the product firstly (Fridson & Alvarez, 2011). It makes it easier for the business
to meet the expected profitability level of the business.
Costing system for SADIDA SDN BHD:
SADIDA SDN BHD is an organization which is involved in the product promotion
services and the warehousing services. It explains that the main operations of the company
are to offer the services to its customers. In case of servicing industry, activity based costing
system is the better costing system because it makes it easier for the business to divide the
cost accordingly (Cook & Tang, 2010). Variable cost could be divided in the service industry
easily but the main issues come up with the fixed cost which is huge and thus the activity
based costing is better method to evaluate the cost per service.
Potential improvements:
In case, the few improvements could also be done by SADIDA SDN BHD in order to
improve the identification of cost. Evaluation on the fixed cost and variable cost is the main
change which could be done by the business.
Fixed cost and variable cost:
All the cost which could be faced by the company could be broken mainly in two
categories which are fixed cost and variable cost. Fixed cost is the cost which is independent
from the total output of the company. This cost remains constant throughout the production
of the company whereas the variable cost is the cost which varies with each of the unit. Fixed
cost includes building, rent, machineries etc cost and variable cost includes wages, utilities,
production material etc. Both of the cost recognition is important in the business in order to
reach over a conclusion (Chowdhury & Chowdhury, 2010).
4
Que 1:
Importance of cost in pricing strategy:
It is correct that cost should never calculate and determine the price but it plays a
critical role in order to identify the total price which must be charged against the product.
Most of the companies determine the cost on the basis of the cost + margin basis. So, in order
to measure the total price of the product, it becomes important for the business to identify the
total cost of the product firstly (Fridson & Alvarez, 2011). It makes it easier for the business
to meet the expected profitability level of the business.
Costing system for SADIDA SDN BHD:
SADIDA SDN BHD is an organization which is involved in the product promotion
services and the warehousing services. It explains that the main operations of the company
are to offer the services to its customers. In case of servicing industry, activity based costing
system is the better costing system because it makes it easier for the business to divide the
cost accordingly (Cook & Tang, 2010). Variable cost could be divided in the service industry
easily but the main issues come up with the fixed cost which is huge and thus the activity
based costing is better method to evaluate the cost per service.
Potential improvements:
In case, the few improvements could also be done by SADIDA SDN BHD in order to
improve the identification of cost. Evaluation on the fixed cost and variable cost is the main
change which could be done by the business.
Fixed cost and variable cost:
All the cost which could be faced by the company could be broken mainly in two
categories which are fixed cost and variable cost. Fixed cost is the cost which is independent
from the total output of the company. This cost remains constant throughout the production
of the company whereas the variable cost is the cost which varies with each of the unit. Fixed
cost includes building, rent, machineries etc cost and variable cost includes wages, utilities,
production material etc. Both of the cost recognition is important in the business in order to
reach over a conclusion (Chowdhury & Chowdhury, 2010).
Paraphrase This Document
Need a fresh take? Get an instant paraphrase of this document with our AI Paraphraser
Financial management Principles
5
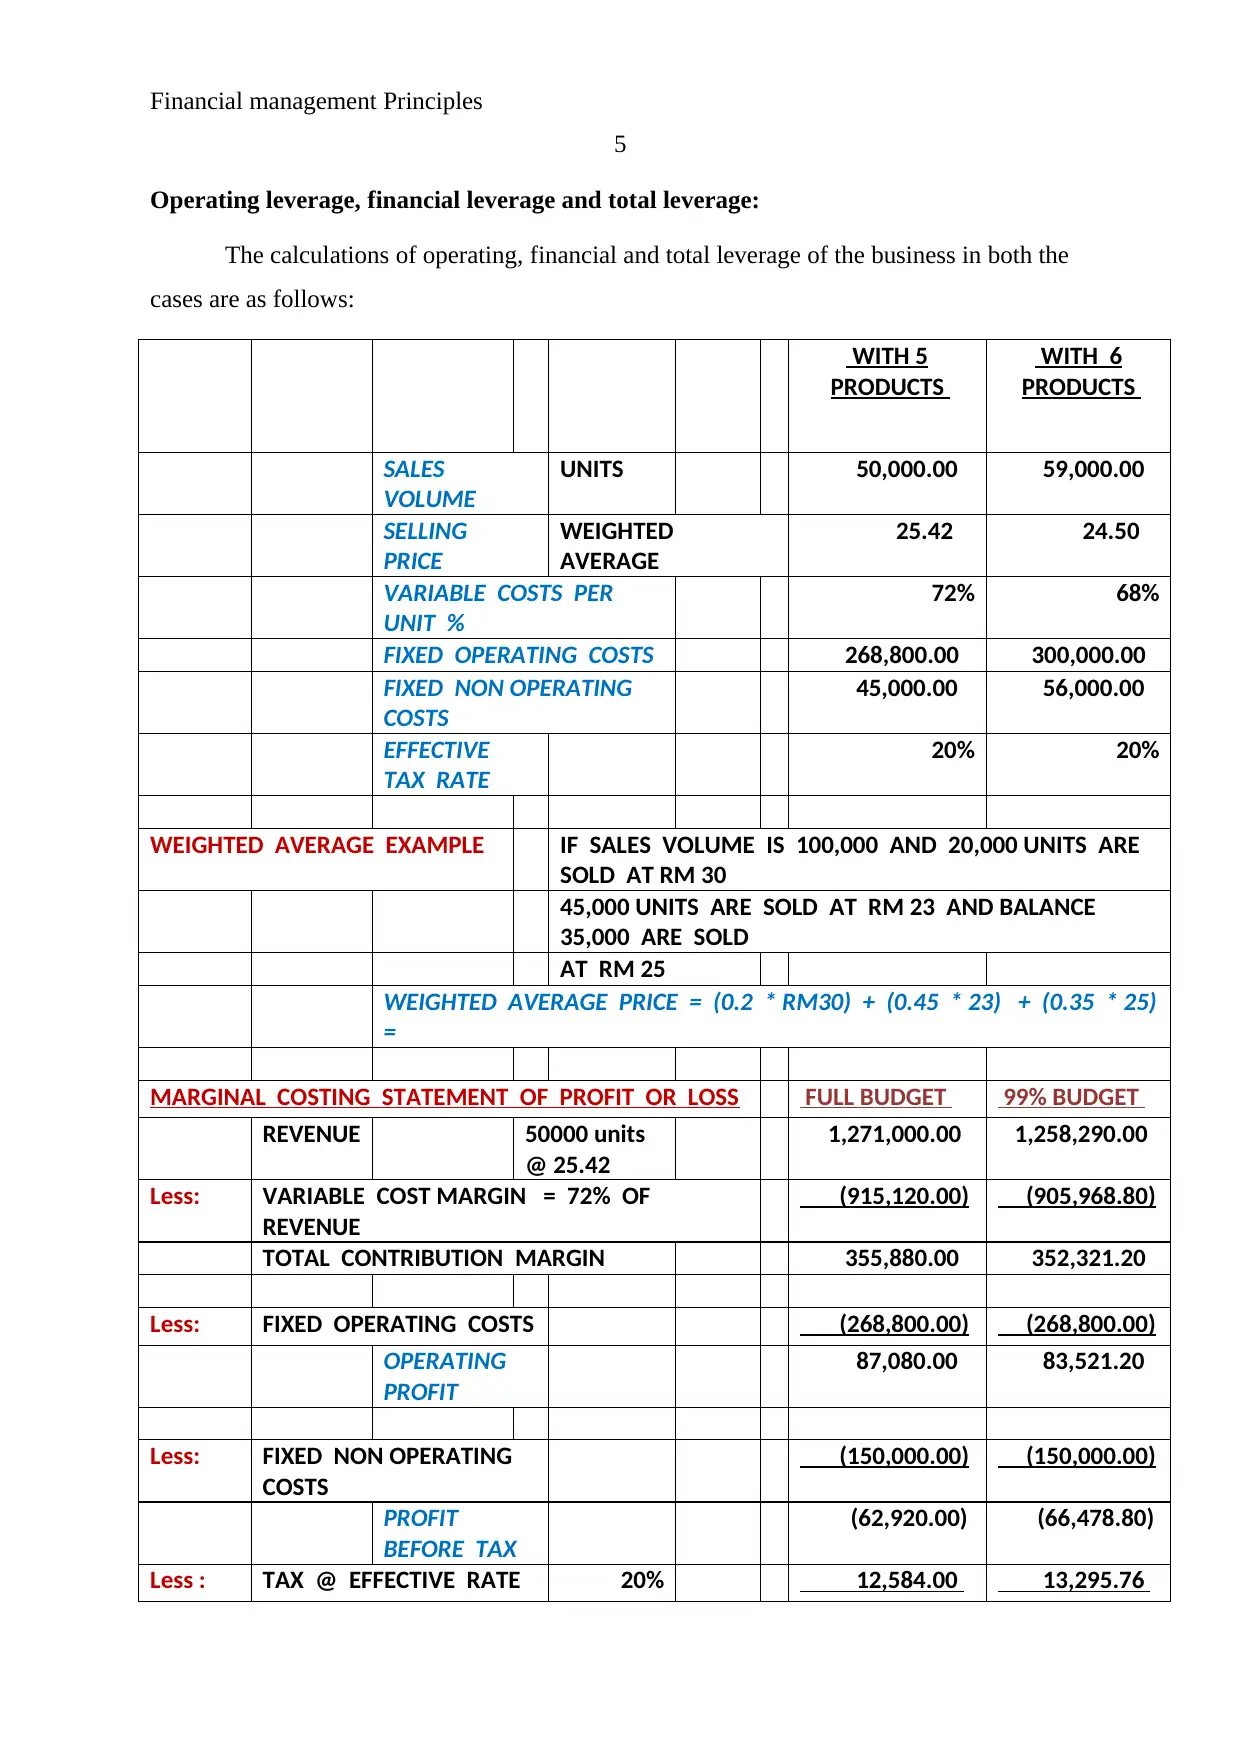
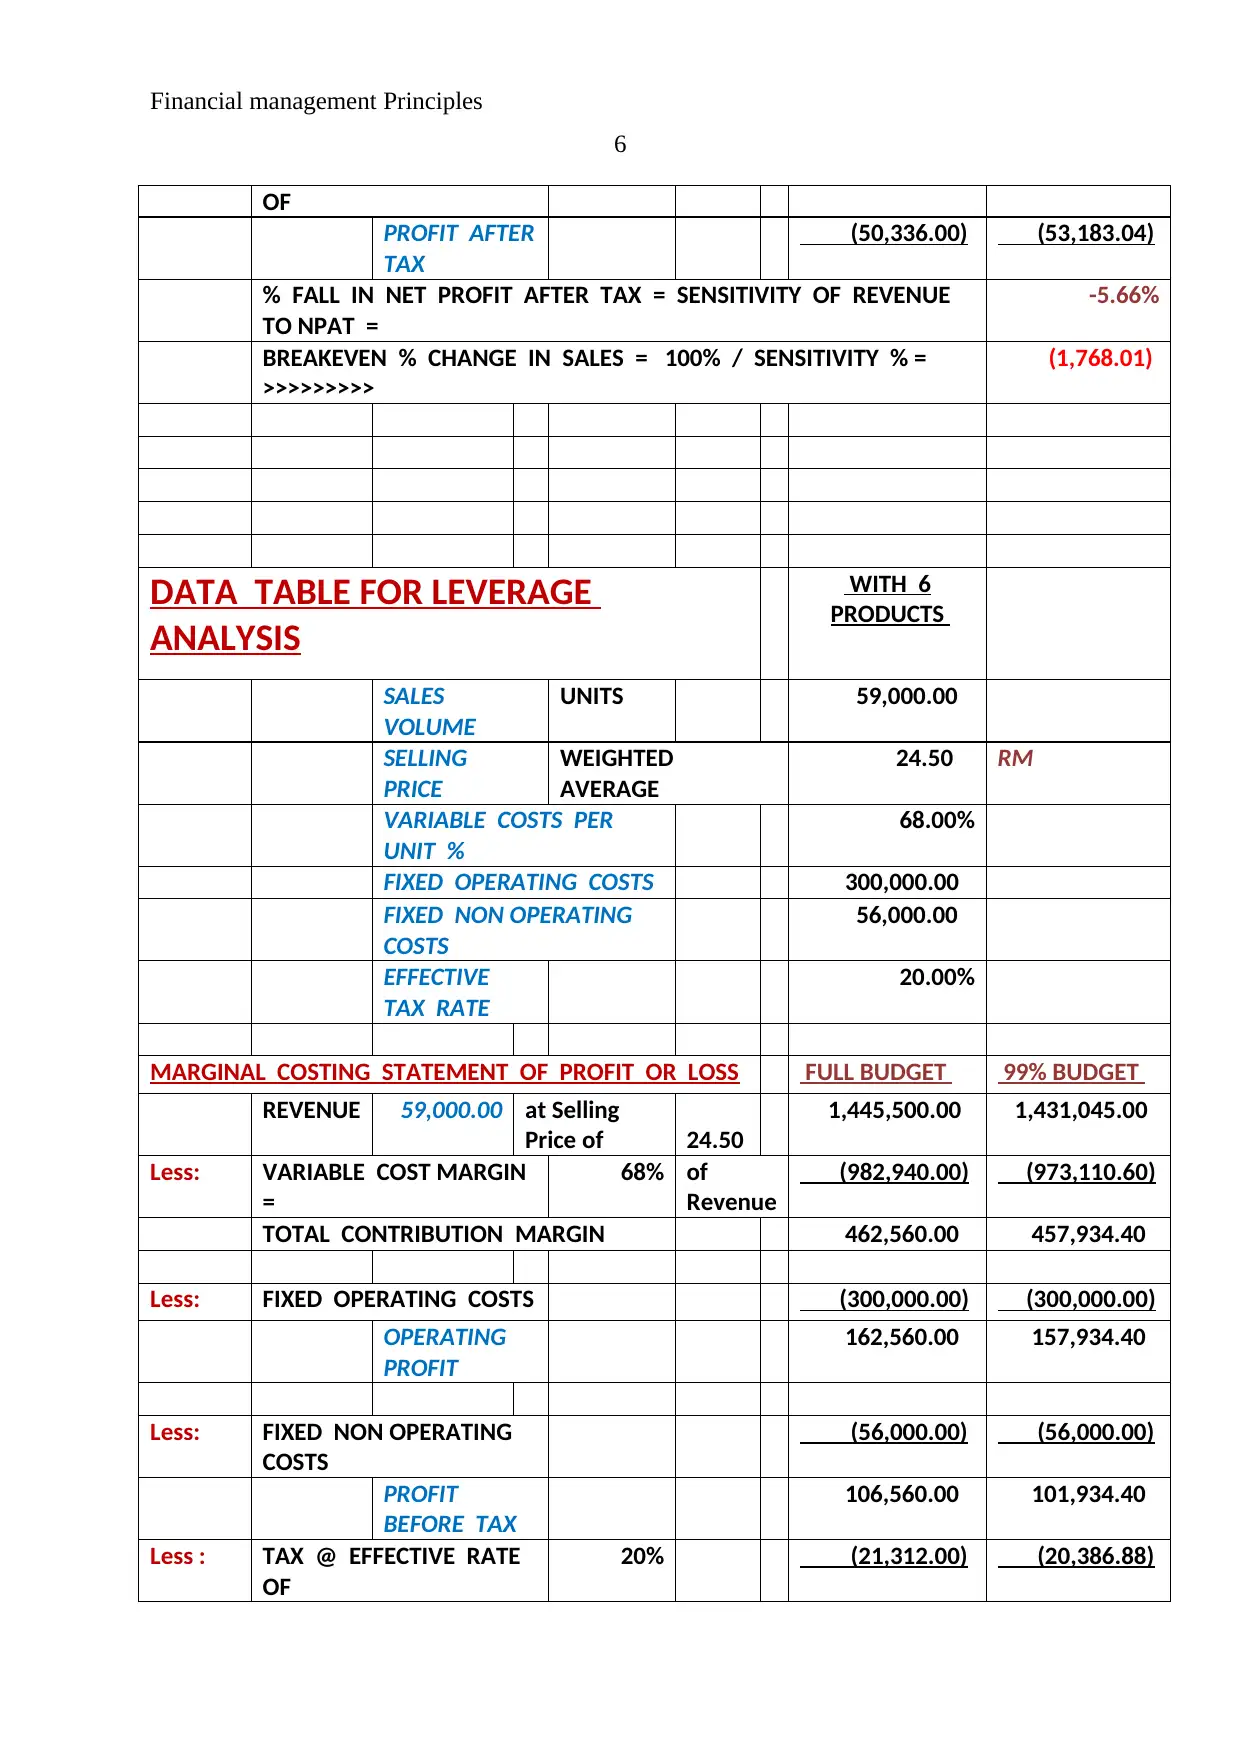
Operating leverage, financial leverage and total leverage:
The calculations of operating, financial and total leverage of the business in both the
cases are as follows:
WITH 5
PRODUCTS
WITH 6
PRODUCTS
SALES
VOLUME
UNITS 50,000.00 59,000.00
SELLING
PRICE
WEIGHTED
AVERAGE
25.42 24.50
VARIABLE COSTS PER
UNIT %
72% 68%
FIXED OPERATING COSTS 268,800.00 300,000.00
FIXED NON OPERATING
COSTS
45,000.00 56,000.00
EFFECTIVE
TAX RATE
20% 20%
WEIGHTED AVERAGE EXAMPLE IF SALES VOLUME IS 100,000 AND 20,000 UNITS ARE
SOLD AT RM 30
45,000 UNITS ARE SOLD AT RM 23 AND BALANCE
35,000 ARE SOLD
AT RM 25
WEIGHTED AVERAGE PRICE = (0.2 * RM30) + (0.45 * 23) + (0.35 * 25)
=
MARGINAL COSTING STATEMENT OF PROFIT OR LOSS FULL BUDGET 99% BUDGET
REVENUE 50000 units
@ 25.42
1,271,000.00 1,258,290.00
Less: VARIABLE COST MARGIN = 72% OF
REVENUE
(915,120.00) (905,968.80)
TOTAL CONTRIBUTION MARGIN 355,880.00 352,321.20
Less: FIXED OPERATING COSTS (268,800.00) (268,800.00)
OPERATING
PROFIT
87,080.00 83,521.20
Less: FIXED NON OPERATING
COSTS
(150,000.00) (150,000.00)
PROFIT
BEFORE TAX
(62,920.00) (66,478.80)
Less : TAX @ EFFECTIVE RATE 20% 12,584.00 13,295.76
5
Operating leverage, financial leverage and total leverage:
The calculations of operating, financial and total leverage of the business in both the
cases are as follows:
WITH 5
PRODUCTS
WITH 6
PRODUCTS
SALES
VOLUME
UNITS 50,000.00 59,000.00
SELLING
PRICE
WEIGHTED
AVERAGE
25.42 24.50
VARIABLE COSTS PER
UNIT %
72% 68%
FIXED OPERATING COSTS 268,800.00 300,000.00
FIXED NON OPERATING
COSTS
45,000.00 56,000.00
EFFECTIVE
TAX RATE
20% 20%
WEIGHTED AVERAGE EXAMPLE IF SALES VOLUME IS 100,000 AND 20,000 UNITS ARE
SOLD AT RM 30
45,000 UNITS ARE SOLD AT RM 23 AND BALANCE
35,000 ARE SOLD
AT RM 25
WEIGHTED AVERAGE PRICE = (0.2 * RM30) + (0.45 * 23) + (0.35 * 25)
=
MARGINAL COSTING STATEMENT OF PROFIT OR LOSS FULL BUDGET 99% BUDGET
REVENUE 50000 units
@ 25.42
1,271,000.00 1,258,290.00
Less: VARIABLE COST MARGIN = 72% OF
REVENUE
(915,120.00) (905,968.80)
TOTAL CONTRIBUTION MARGIN 355,880.00 352,321.20
Less: FIXED OPERATING COSTS (268,800.00) (268,800.00)
OPERATING
PROFIT
87,080.00 83,521.20
Less: FIXED NON OPERATING
COSTS
(150,000.00) (150,000.00)
PROFIT
BEFORE TAX
(62,920.00) (66,478.80)
Less : TAX @ EFFECTIVE RATE 20% 12,584.00 13,295.76
Financial management Principles
6
OF
PROFIT AFTER
TAX
(50,336.00) (53,183.04)
% FALL IN NET PROFIT AFTER TAX = SENSITIVITY OF REVENUE
TO NPAT =
-5.66%
BREAKEVEN % CHANGE IN SALES = 100% / SENSITIVITY % =
>>>>>>>>>
(1,768.01)
DATA TABLE FOR LEVERAGE
ANALYSIS
WITH 6
PRODUCTS
SALES
VOLUME
UNITS 59,000.00
SELLING
PRICE
WEIGHTED
AVERAGE
24.50 RM
VARIABLE COSTS PER
UNIT %
68.00%
FIXED OPERATING COSTS 300,000.00
FIXED NON OPERATING
COSTS
56,000.00
EFFECTIVE
TAX RATE
20.00%
MARGINAL COSTING STATEMENT OF PROFIT OR LOSS FULL BUDGET 99% BUDGET
REVENUE 59,000.00 at Selling
Price of 24.50
1,445,500.00 1,431,045.00
Less: VARIABLE COST MARGIN
=
68% of
Revenue
(982,940.00) (973,110.60)
TOTAL CONTRIBUTION MARGIN 462,560.00 457,934.40
Less: FIXED OPERATING COSTS (300,000.00) (300,000.00)
OPERATING
PROFIT
162,560.00 157,934.40
Less: FIXED NON OPERATING
COSTS
(56,000.00) (56,000.00)
PROFIT
BEFORE TAX
106,560.00 101,934.40
Less : TAX @ EFFECTIVE RATE
OF
20% (21,312.00) (20,386.88)
⊘ This is a preview!⊘
Do you want full access?
Subscribe today to unlock all pages.
Trusted by 1+ million students worldwide
Financial management Principles
7
PROFIT AFTER
TAX
85,248.00 81,547.52
% FALL IN NET PROFIT AFTER TAX = SENSITIVITY OF REVENUE
TO NPAT =
4.34
BREAKEVEN % CHANGE IN SALES = 100% / SENSITIVITY % =
>>>>>>>>>
23.04
(Khamees, Al-Fayoumi & Al-Thuneibat, 2010)
Que 2:
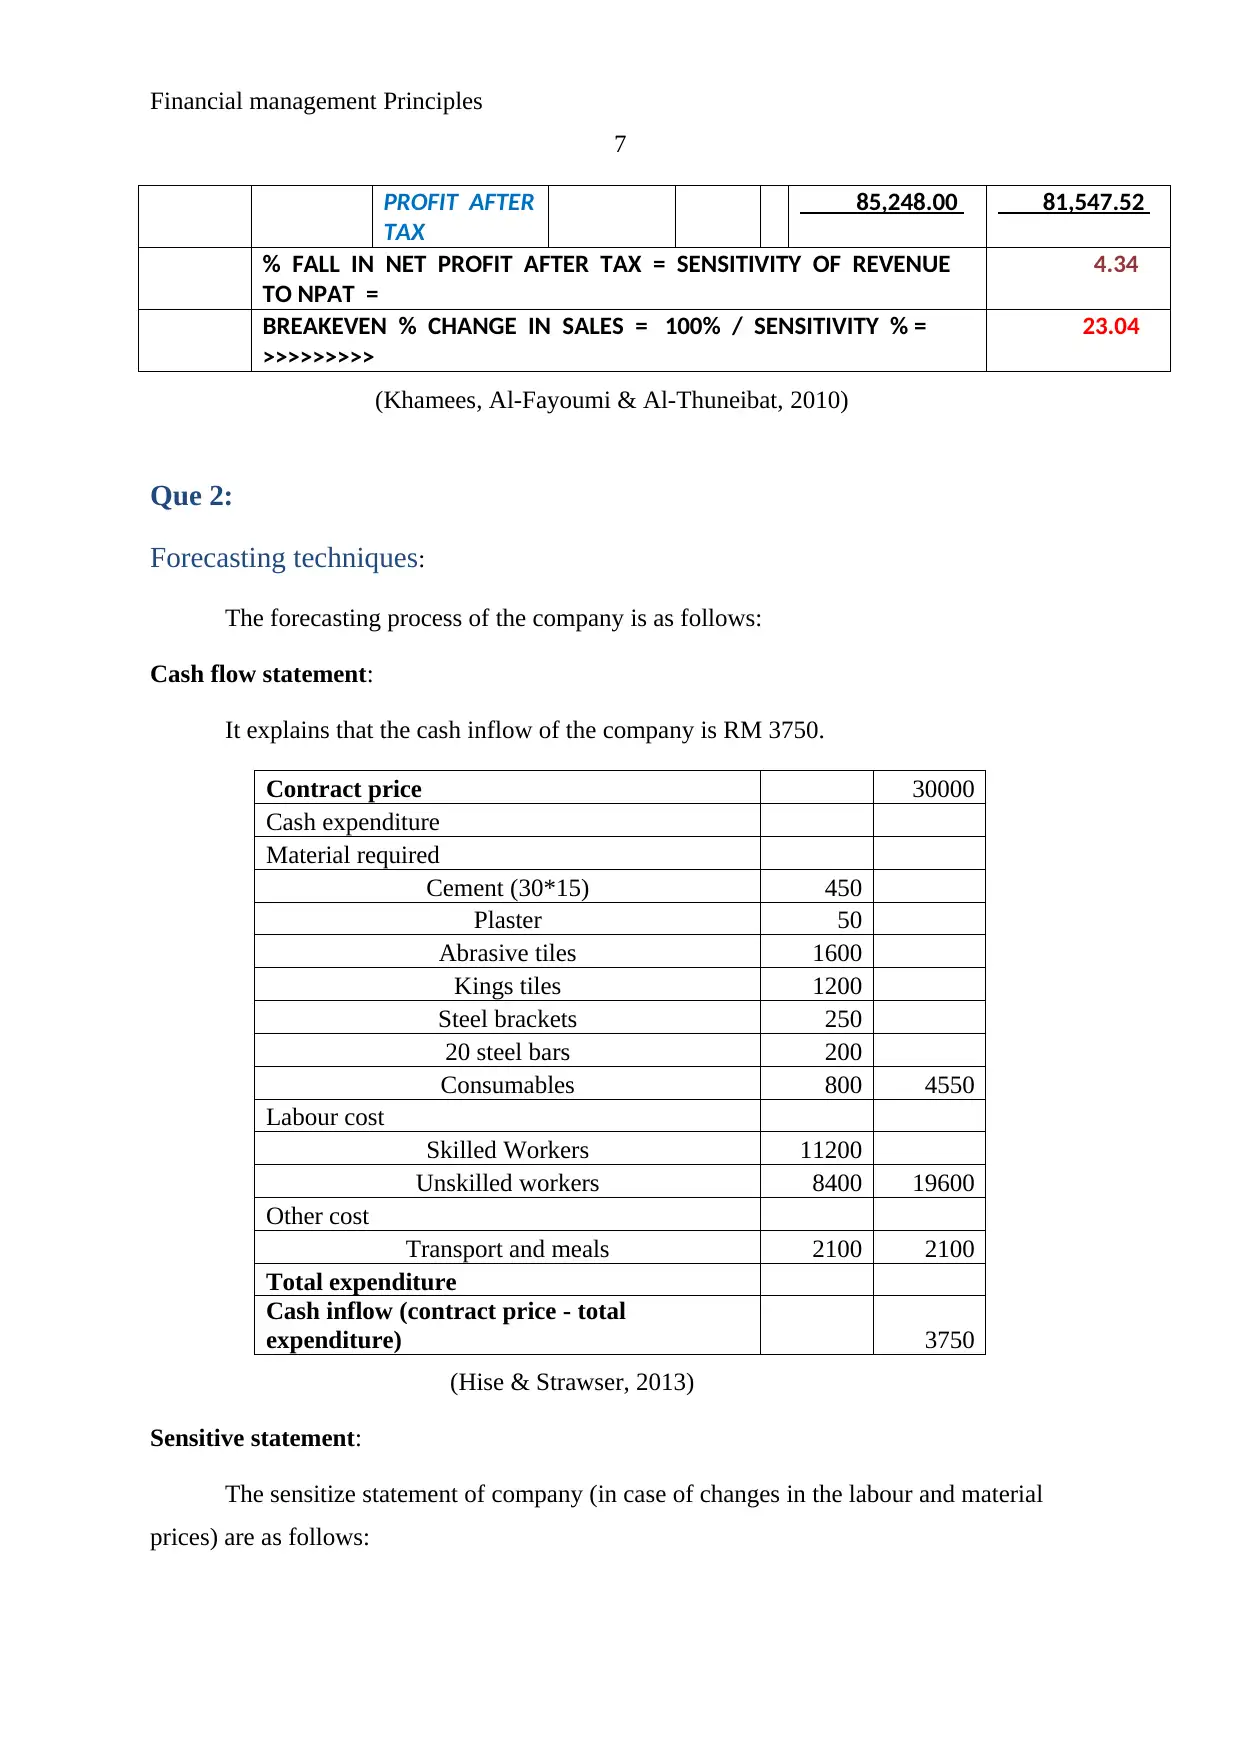
Forecasting techniques:
The forecasting process of the company is as follows:
Cash flow statement:
It explains that the cash inflow of the company is RM 3750.
Contract price 30000
Cash expenditure
Material required
Cement (30*15) 450
Plaster 50
Abrasive tiles 1600
Kings tiles 1200
Steel brackets 250
20 steel bars 200
Consumables 800 4550
Labour cost
Skilled Workers 11200
Unskilled workers 8400 19600
Other cost
Transport and meals 2100 2100
Total expenditure
Cash inflow (contract price - total
expenditure) 3750
(Hise & Strawser, 2013)
Sensitive statement:
The sensitize statement of company (in case of changes in the labour and material
prices) are as follows:
7
PROFIT AFTER
TAX
85,248.00 81,547.52
% FALL IN NET PROFIT AFTER TAX = SENSITIVITY OF REVENUE
TO NPAT =
4.34
BREAKEVEN % CHANGE IN SALES = 100% / SENSITIVITY % =
>>>>>>>>>
23.04
(Khamees, Al-Fayoumi & Al-Thuneibat, 2010)
Que 2:
Forecasting techniques:
The forecasting process of the company is as follows:
Cash flow statement:
It explains that the cash inflow of the company is RM 3750.
Contract price 30000
Cash expenditure
Material required
Cement (30*15) 450
Plaster 50
Abrasive tiles 1600
Kings tiles 1200
Steel brackets 250
20 steel bars 200
Consumables 800 4550
Labour cost
Skilled Workers 11200
Unskilled workers 8400 19600
Other cost
Transport and meals 2100 2100
Total expenditure
Cash inflow (contract price - total
expenditure) 3750
(Hise & Strawser, 2013)
Sensitive statement:
The sensitize statement of company (in case of changes in the labour and material
prices) are as follows:
Paraphrase This Document
Need a fresh take? Get an instant paraphrase of this document with our AI Paraphraser
Financial management Principles
8
Total cost Cash inflow
Pessimistic Optimistic Pessimistic Optimistic
Contract
price Pessimistic Optimistic
5% -5%
Changes in
material
price 4777.5 4322.5
Changes in
labour
prices 20580 18620
Other cost 2100 2100
Total cost 27457.5 25042.5 30000 2542.5 4957.5
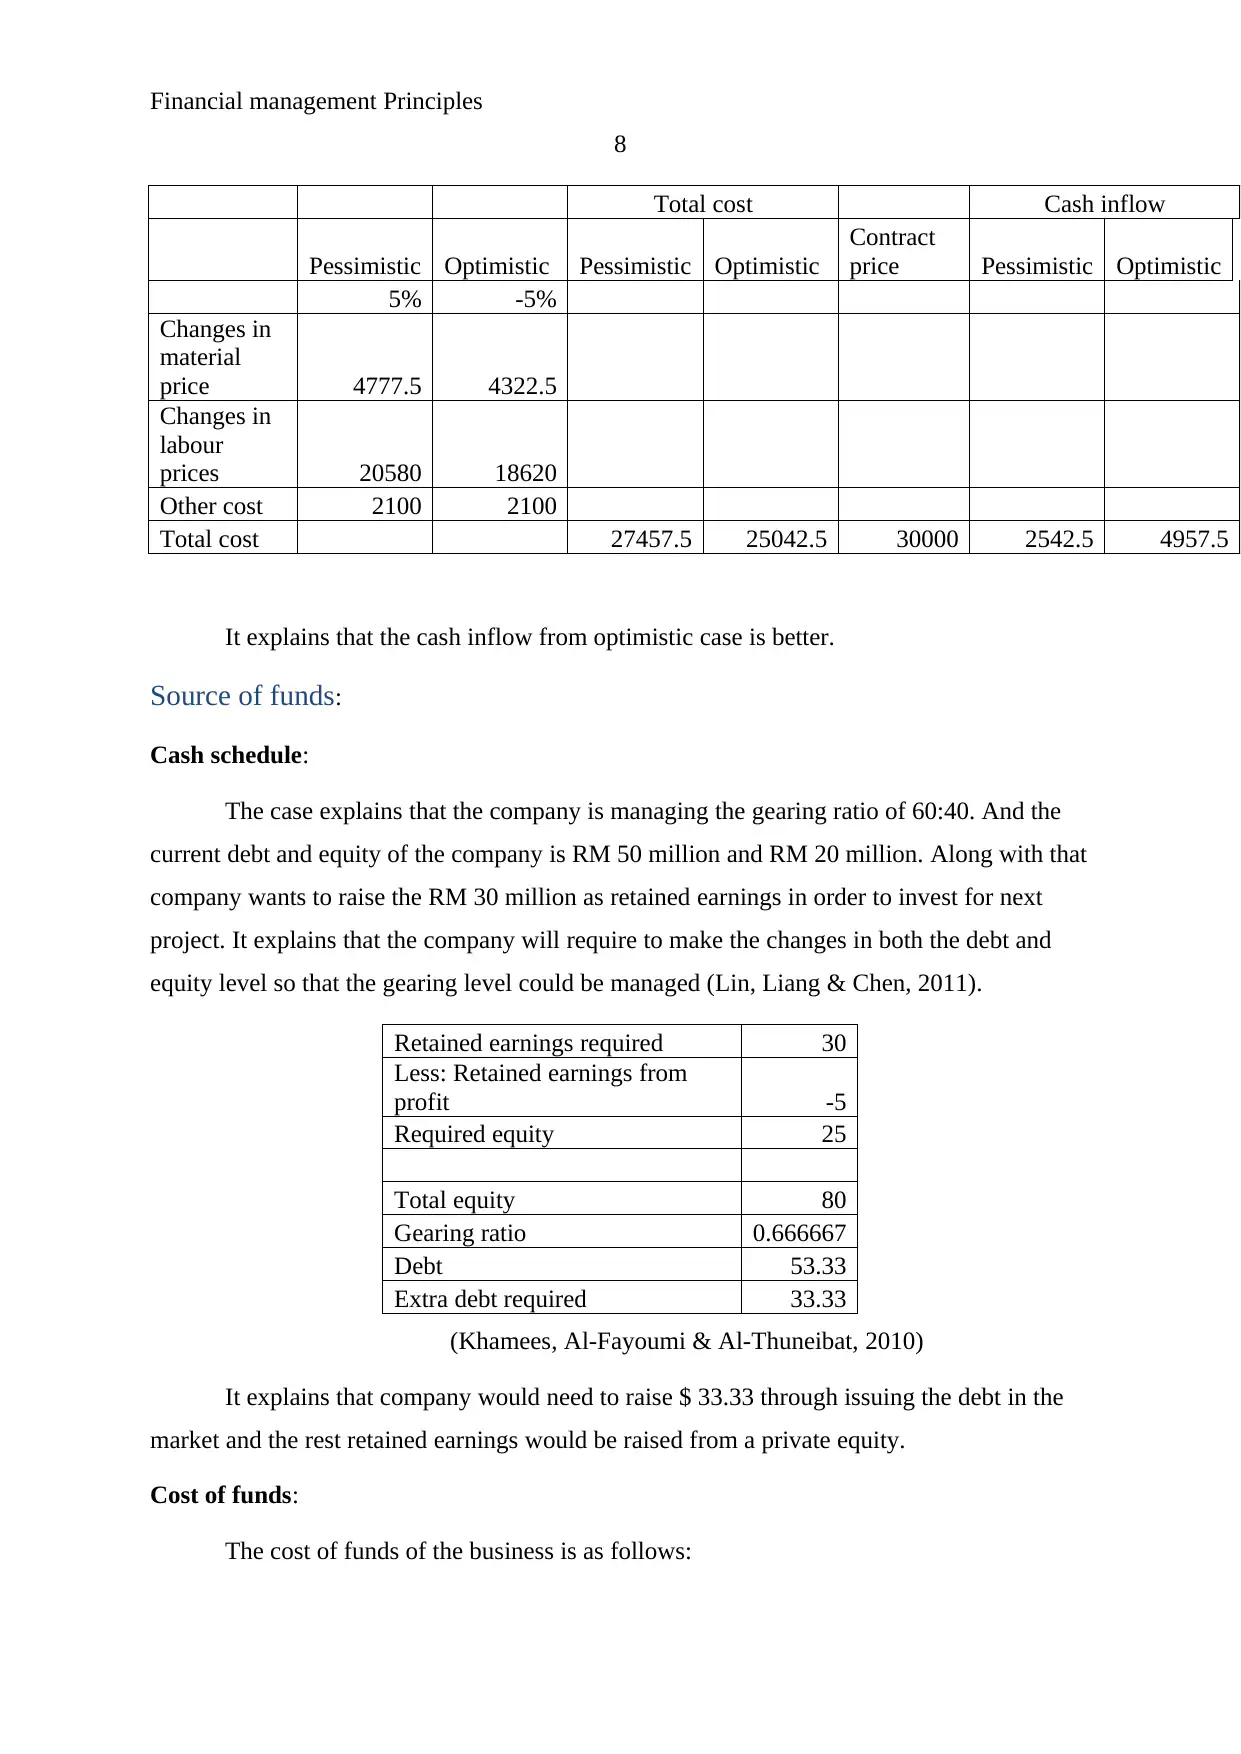
It explains that the cash inflow from optimistic case is better.
Source of funds:
Cash schedule:
The case explains that the company is managing the gearing ratio of 60:40. And the
current debt and equity of the company is RM 50 million and RM 20 million. Along with that
company wants to raise the RM 30 million as retained earnings in order to invest for next
project. It explains that the company will require to make the changes in both the debt and
equity level so that the gearing level could be managed (Lin, Liang & Chen, 2011).
Retained earnings required 30
Less: Retained earnings from
profit -5
Required equity 25
Total equity 80
Gearing ratio 0.666667
Debt 53.33
Extra debt required 33.33
(Khamees, Al-Fayoumi & Al-Thuneibat, 2010)
It explains that company would need to raise $ 33.33 through issuing the debt in the
market and the rest retained earnings would be raised from a private equity.
Cost of funds:
The cost of funds of the business is as follows:
8
Total cost Cash inflow
Pessimistic Optimistic Pessimistic Optimistic
Contract
price Pessimistic Optimistic
5% -5%
Changes in
material
price 4777.5 4322.5
Changes in
labour
prices 20580 18620
Other cost 2100 2100
Total cost 27457.5 25042.5 30000 2542.5 4957.5
It explains that the cash inflow from optimistic case is better.
Source of funds:
Cash schedule:
The case explains that the company is managing the gearing ratio of 60:40. And the
current debt and equity of the company is RM 50 million and RM 20 million. Along with that
company wants to raise the RM 30 million as retained earnings in order to invest for next
project. It explains that the company will require to make the changes in both the debt and
equity level so that the gearing level could be managed (Lin, Liang & Chen, 2011).
Retained earnings required 30
Less: Retained earnings from
profit -5
Required equity 25
Total equity 80
Gearing ratio 0.666667
Debt 53.33
Extra debt required 33.33
(Khamees, Al-Fayoumi & Al-Thuneibat, 2010)
It explains that company would need to raise $ 33.33 through issuing the debt in the
market and the rest retained earnings would be raised from a private equity.
Cost of funds:
The cost of funds of the business is as follows:
Financial management Principles
9
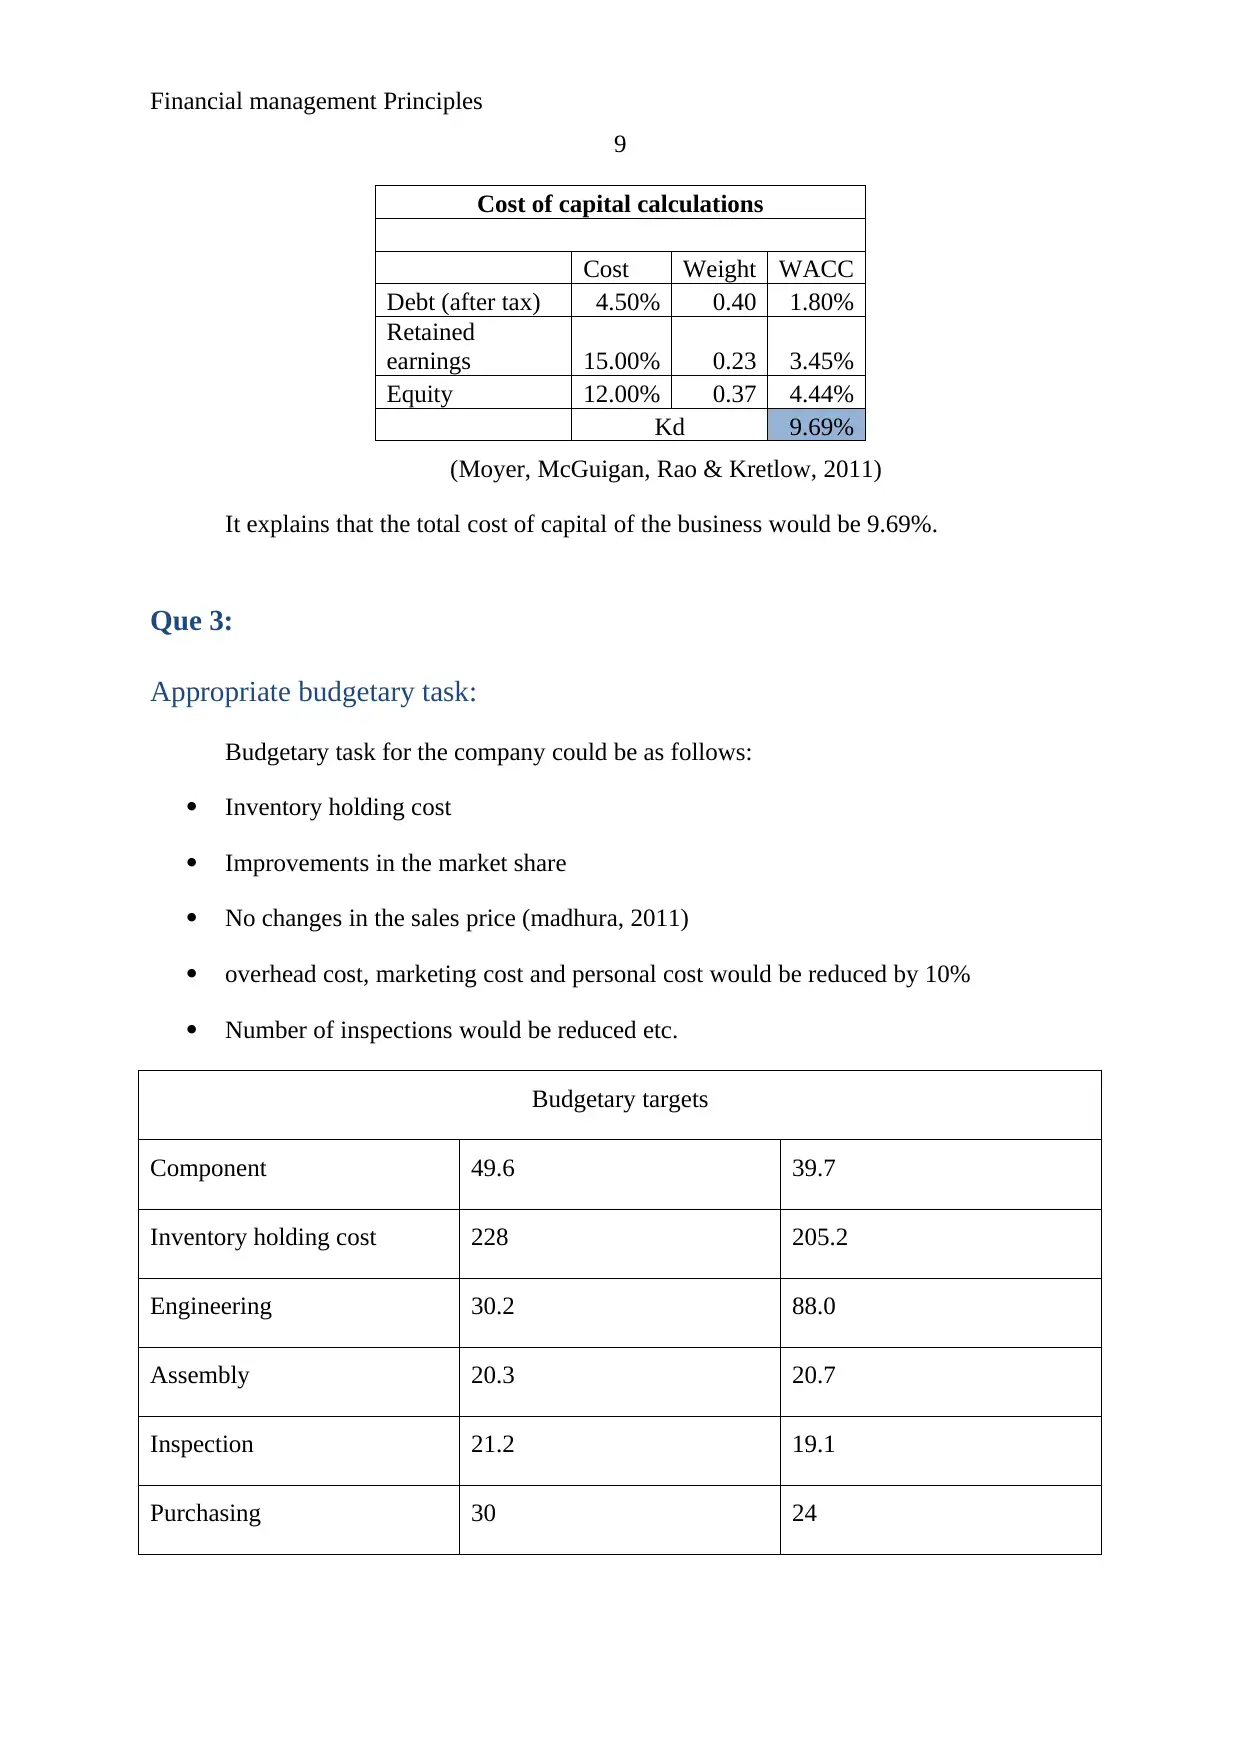
Cost of capital calculations
Cost Weight WACC
Debt (after tax) 4.50% 0.40 1.80%
Retained
earnings 15.00% 0.23 3.45%
Equity 12.00% 0.37 4.44%
Kd 9.69%
(Moyer, McGuigan, Rao & Kretlow, 2011)
It explains that the total cost of capital of the business would be 9.69%.
Que 3:
Appropriate budgetary task:
Budgetary task for the company could be as follows:
Inventory holding cost
Improvements in the market share
No changes in the sales price (madhura, 2011)
overhead cost, marketing cost and personal cost would be reduced by 10%
Number of inspections would be reduced etc.
Budgetary targets
Component 49.6 39.7
Inventory holding cost 228 205.2
Engineering 30.2 88.0
Assembly 20.3 20.7
Inspection 21.2 19.1
Purchasing 30 24
9
Cost of capital calculations
Cost Weight WACC
Debt (after tax) 4.50% 0.40 1.80%
Retained
earnings 15.00% 0.23 3.45%
Equity 12.00% 0.37 4.44%
Kd 9.69%
(Moyer, McGuigan, Rao & Kretlow, 2011)
It explains that the total cost of capital of the business would be 9.69%.
Que 3:
Appropriate budgetary task:
Budgetary task for the company could be as follows:
Inventory holding cost
Improvements in the market share
No changes in the sales price (madhura, 2011)
overhead cost, marketing cost and personal cost would be reduced by 10%
Number of inspections would be reduced etc.
Budgetary targets
Component 49.6 39.7
Inventory holding cost 228 205.2
Engineering 30.2 88.0
Assembly 20.3 20.7
Inspection 21.2 19.1
Purchasing 30 24
⊘ This is a preview!⊘
Do you want full access?
Subscribe today to unlock all pages.
Trusted by 1+ million students worldwide
Financial management Principles
10
Sales budget 5
Overheads 499.2 449.3
Selling price 5000 5000
(Vogel, 2014)
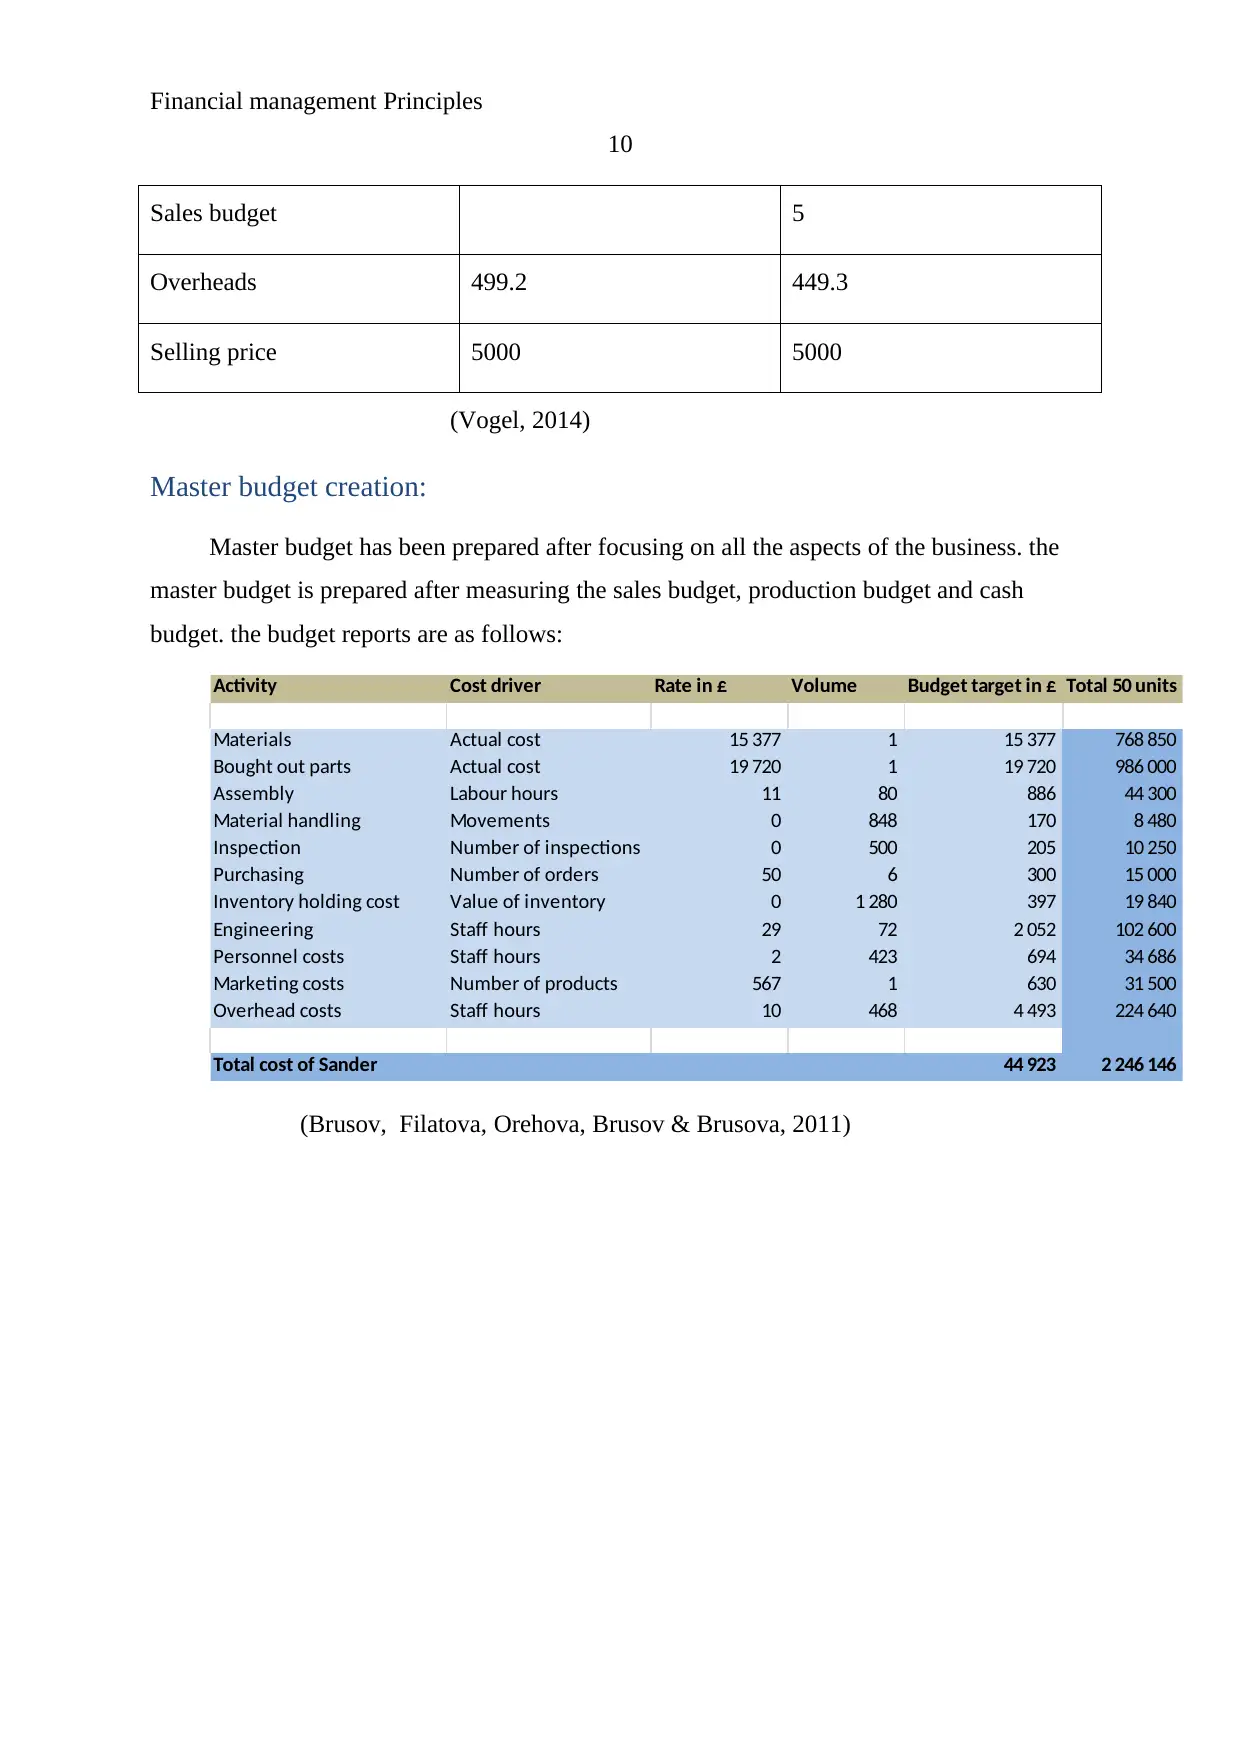
Master budget creation:
Master budget has been prepared after focusing on all the aspects of the business. the
master budget is prepared after measuring the sales budget, production budget and cash
budget. the budget reports are as follows:
Activity Cost driver Rate in £ Volume Budget target in £ Total 50 units
Materials Actual cost 15 377 1 15 377 768 850
Bought out parts Actual cost 19 720 1 19 720 986 000
Assembly Labour hours 11 80 886 44 300
Material handling Movements 0 848 170 8 480
Inspection Number of inspections 0 500 205 10 250
Purchasing Number of orders 50 6 300 15 000
Inventory holding cost Value of inventory 0 1 280 397 19 840
Engineering Staff hours 29 72 2 052 102 600
Personnel costs Staff hours 2 423 694 34 686
Marketing costs Number of products 567 1 630 31 500
Overhead costs Staff hours 10 468 4 493 224 640
Total cost of Sander 44 923 2 246 146
(Brusov, Filatova, Orehova, Brusov & Brusova, 2011)
10
Sales budget 5
Overheads 499.2 449.3
Selling price 5000 5000
(Vogel, 2014)
Master budget creation:
Master budget has been prepared after focusing on all the aspects of the business. the
master budget is prepared after measuring the sales budget, production budget and cash
budget. the budget reports are as follows:
Activity Cost driver Rate in £ Volume Budget target in £ Total 50 units
Materials Actual cost 15 377 1 15 377 768 850
Bought out parts Actual cost 19 720 1 19 720 986 000
Assembly Labour hours 11 80 886 44 300
Material handling Movements 0 848 170 8 480
Inspection Number of inspections 0 500 205 10 250
Purchasing Number of orders 50 6 300 15 000
Inventory holding cost Value of inventory 0 1 280 397 19 840
Engineering Staff hours 29 72 2 052 102 600
Personnel costs Staff hours 2 423 694 34 686
Marketing costs Number of products 567 1 630 31 500
Overhead costs Staff hours 10 468 4 493 224 640
Total cost of Sander 44 923 2 246 146
(Brusov, Filatova, Orehova, Brusov & Brusova, 2011)
Paraphrase This Document
Need a fresh take? Get an instant paraphrase of this document with our AI Paraphraser
Financial management Principles
11
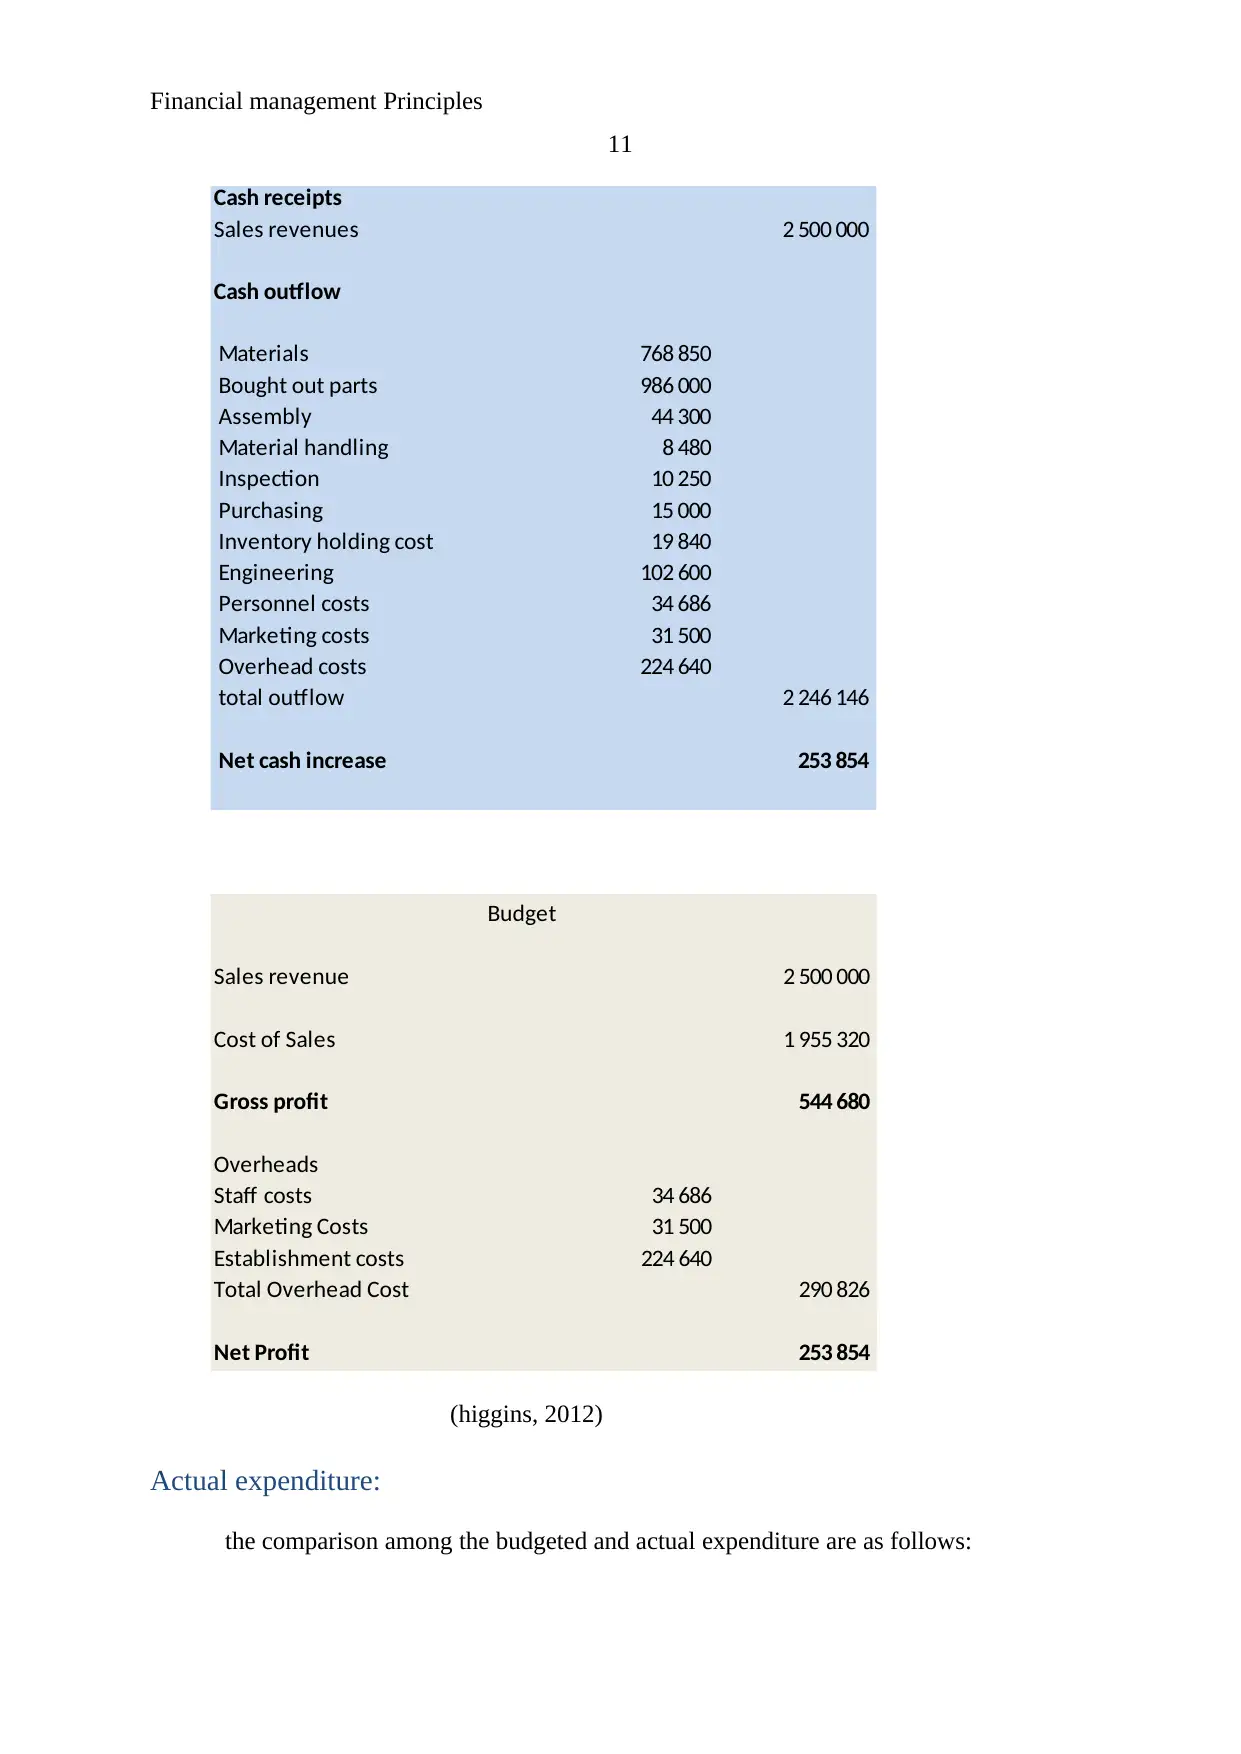
Cash receipts
Sales revenues 2 500 000
Cash outflow
Materials 768 850
Bought out parts 986 000
Assembly 44 300
Material handling 8 480
Inspection 10 250
Purchasing 15 000
Inventory holding cost 19 840
Engineering 102 600
Personnel costs 34 686
Marketing costs 31 500
Overhead costs 224 640
total outflow 2 246 146
Net cash increase 253 854
The Wilheim Company budgeted Income Statement
Budget
Sales revenue 2 500 000
Cost of Sales 1 955 320
Gross profit 544 680
Overheads
Staff costs 34 686
Marketing Costs 31 500
Establishment costs 224 640
Total Overhead Cost 290 826
Net Profit 253 854
(higgins, 2012)
Actual expenditure:
the comparison among the budgeted and actual expenditure are as follows:
11
Cash receipts
Sales revenues 2 500 000
Cash outflow
Materials 768 850
Bought out parts 986 000
Assembly 44 300
Material handling 8 480
Inspection 10 250
Purchasing 15 000
Inventory holding cost 19 840
Engineering 102 600
Personnel costs 34 686
Marketing costs 31 500
Overhead costs 224 640
total outflow 2 246 146
Net cash increase 253 854
The Wilheim Company budgeted Income Statement
Budget
Sales revenue 2 500 000
Cost of Sales 1 955 320
Gross profit 544 680
Overheads
Staff costs 34 686
Marketing Costs 31 500
Establishment costs 224 640
Total Overhead Cost 290 826
Net Profit 253 854
(higgins, 2012)
Actual expenditure:
the comparison among the budgeted and actual expenditure are as follows:
Financial management Principles
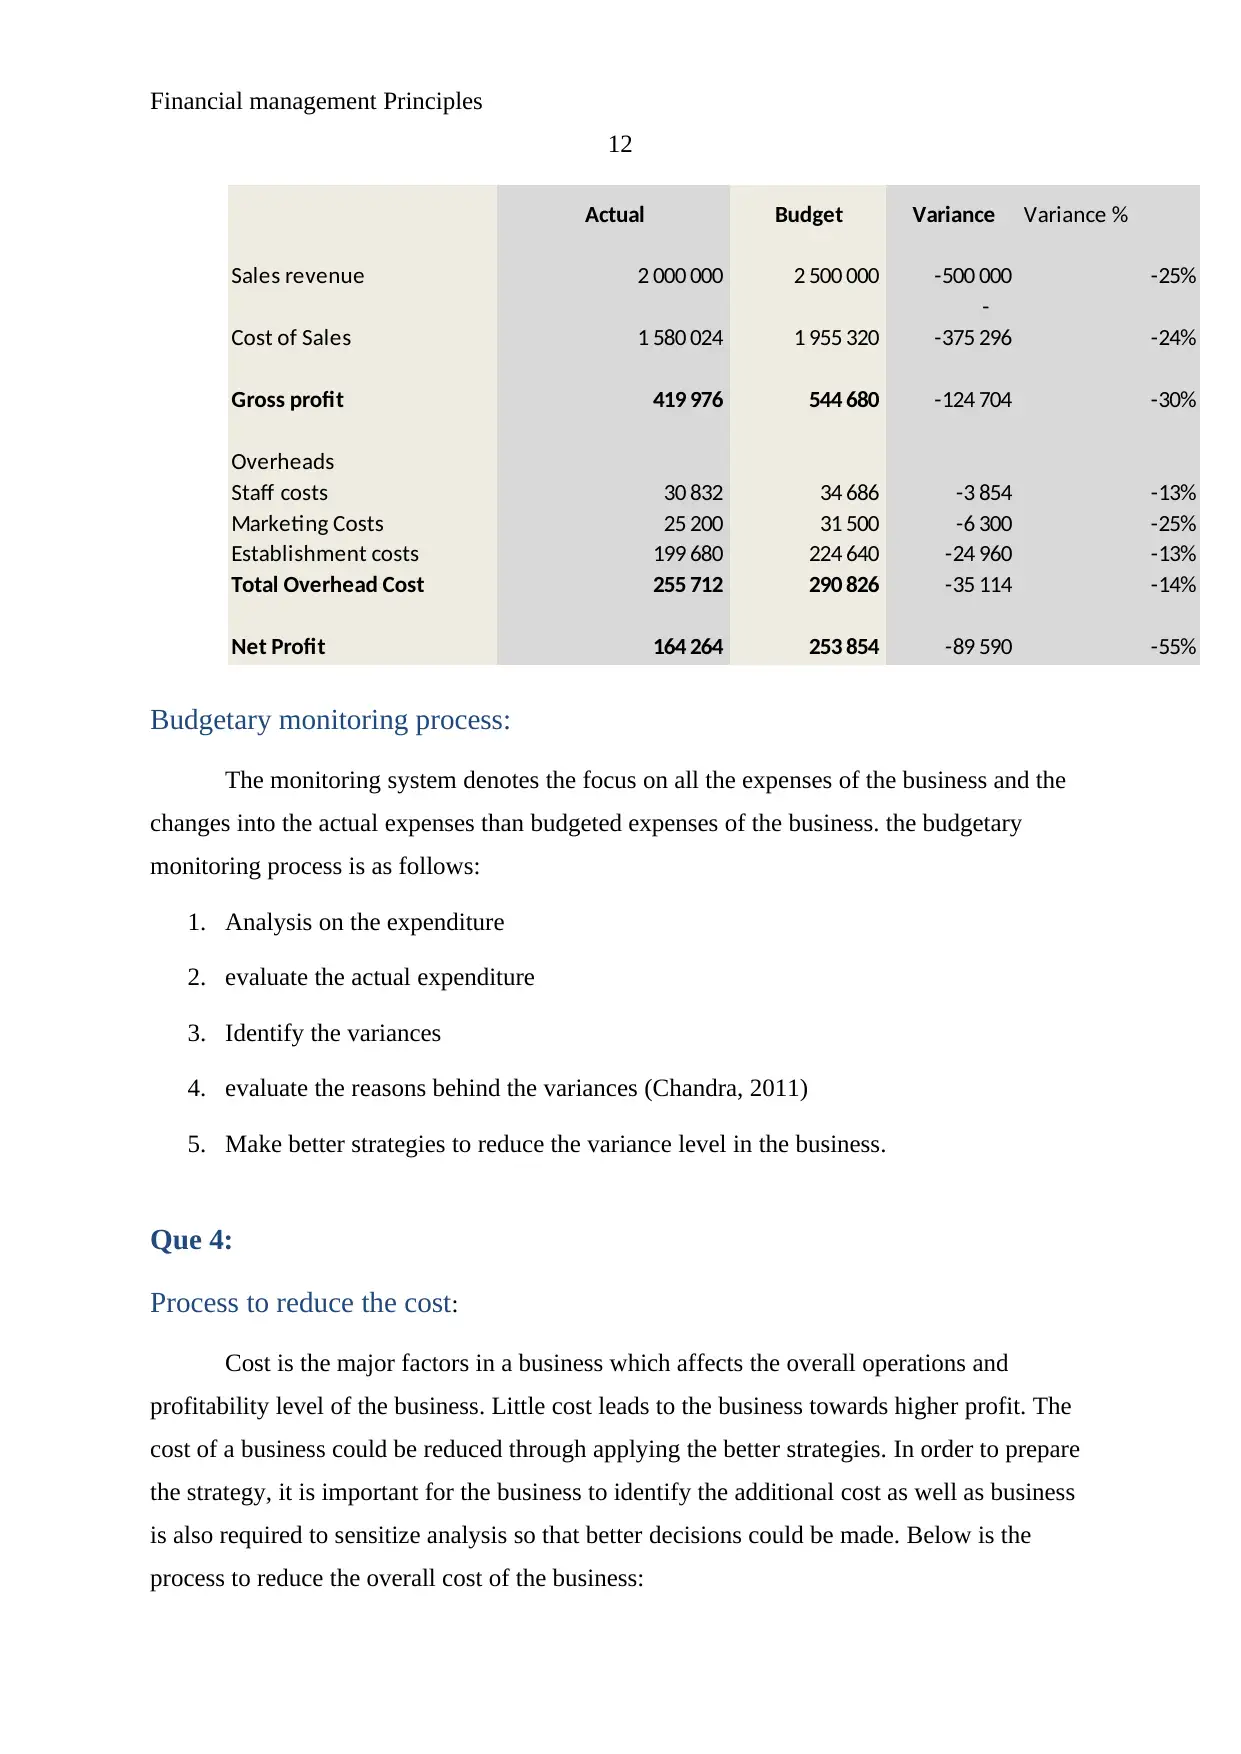
12The Wilheim Company budgeted Income Statement 2013
Actual Budget Variance Variance %
Sales revenue 2 000 000 2 500 000 -500 000 -25%
-
Cost of Sales 1 580 024 1 955 320 -375 296 -24%
Gross profit 419 976 544 680 -124 704 -30%
Overheads
Staff costs 30 832 34 686 -3 854 -13%
Marketing Costs 25 200 31 500 -6 300 -25%
Establishment costs 199 680 224 640 -24 960 -13%
Total Overhead Cost 255 712 290 826 -35 114 -14%
Net Profit 164 264 253 854 -89 590 -55%
Budgetary monitoring process:
The monitoring system denotes the focus on all the expenses of the business and the
changes into the actual expenses than budgeted expenses of the business. the budgetary
monitoring process is as follows:
1. Analysis on the expenditure
2. evaluate the actual expenditure
3. Identify the variances
4. evaluate the reasons behind the variances (Chandra, 2011)
5. Make better strategies to reduce the variance level in the business.
Que 4:
Process to reduce the cost:
Cost is the major factors in a business which affects the overall operations and
profitability level of the business. Little cost leads to the business towards higher profit. The
cost of a business could be reduced through applying the better strategies. In order to prepare
the strategy, it is important for the business to identify the additional cost as well as business
is also required to sensitize analysis so that better decisions could be made. Below is the
process to reduce the overall cost of the business:
⊘ This is a preview!⊘
Do you want full access?
Subscribe today to unlock all pages.
Trusted by 1+ million students worldwide
1 out of 22
Related Documents


Your All-in-One AI-Powered Toolkit for Academic Success.
+13062052269
info@desklib.com
Available 24*7 on WhatsApp / Email
![[object Object]](/_next/static/media/star-bottom.7253800d.svg)
Unlock your academic potential
Copyright © 2020–2026 A2Z Services. All Rights Reserved. Developed and managed by ZUCOL.