Financial Management Analysis: Alliance Aviation Services (AQZ) Report
VerifiedAdded on 2020/05/04
|13
|2503
|174
Report
AI Summary
This report provides a comprehensive financial analysis of Alliance Aviation Services (AQZ), focusing on debt valuation, share valuation, cost of capital, and market analysis. The debt valuation section examines short and long-term debt, along with the cost of debt. The share valuation section utilizes comparative techniques and the dividend discount model to assess the stock's value. The cost of capital section calculates the Weighted Average Cost of Capital (WACC). Finally, the market analysis section presents the opinions of financial analysts regarding Alliance Aviation Services' performance, including the company's competitive position, growth prospects, and capital structure. The report highlights key financial metrics, industry benchmarks, and the impact of external factors on the company's financial health.
Running Head: FINANCIAL MANAGEMENT ANALYSIS
1
Financial Management Analysis
[Name of Writer]
[Name of Institution]
1
Financial Management Analysis
[Name of Writer]
[Name of Institution]
Paraphrase This Document
Need a fresh take? Get an instant paraphrase of this document with our AI Paraphraser
FINANCIAL MANAGEMENT ANALYSIS 2
Financial Management Analysis
Executive Summary
This report is analysis of financial management and strength of Alliance Aviation Services which
is listed on Australian Stock Exchange under the code of AQZ. Alliance Aviation Services
operate in airline industry and hold major portion of charter market. This report is divided into
four major sections which are Debt Valuation, Share Valuation, Cost of Capital and Market
Analysis. Debt valuation section will include short and long term debt analysis and cost of
capital. Share valuation will contain analysis of stock of Alliance Aviation through comparative
technique and dividend discount model. Cost of capital section will include discussion of
important and calculation of WACC. Market analysis section will include the opinion of
financial analysts about performance of Alliance Aviation Services.
Debt Valuation.I.1:
Alliance Aviation Services use debt finances for expansion and growth purposes. Debt
used by Alliance Aviation Services can be divided into short and long term debt. Short term debt
of Alliance Aviation Services includes bank loans and long term debt is also acquired from
banks. The primary reason of using bank loan is secure and low cost of financing as compared to
the acquiring finance from public through bonds.
Debt Valuation.I.2:
Airline industry is pursuing very aggressive growth strategy that increase ratio of debt to
total assets. Industry leaders in airline industry borrow as much as 80% of total assets while
average debt to equity ratio in airline industry is less than 50%. Qantas and Virgin Airlines are
FINANCIAL MANAGEMENT ANALYSIS 3
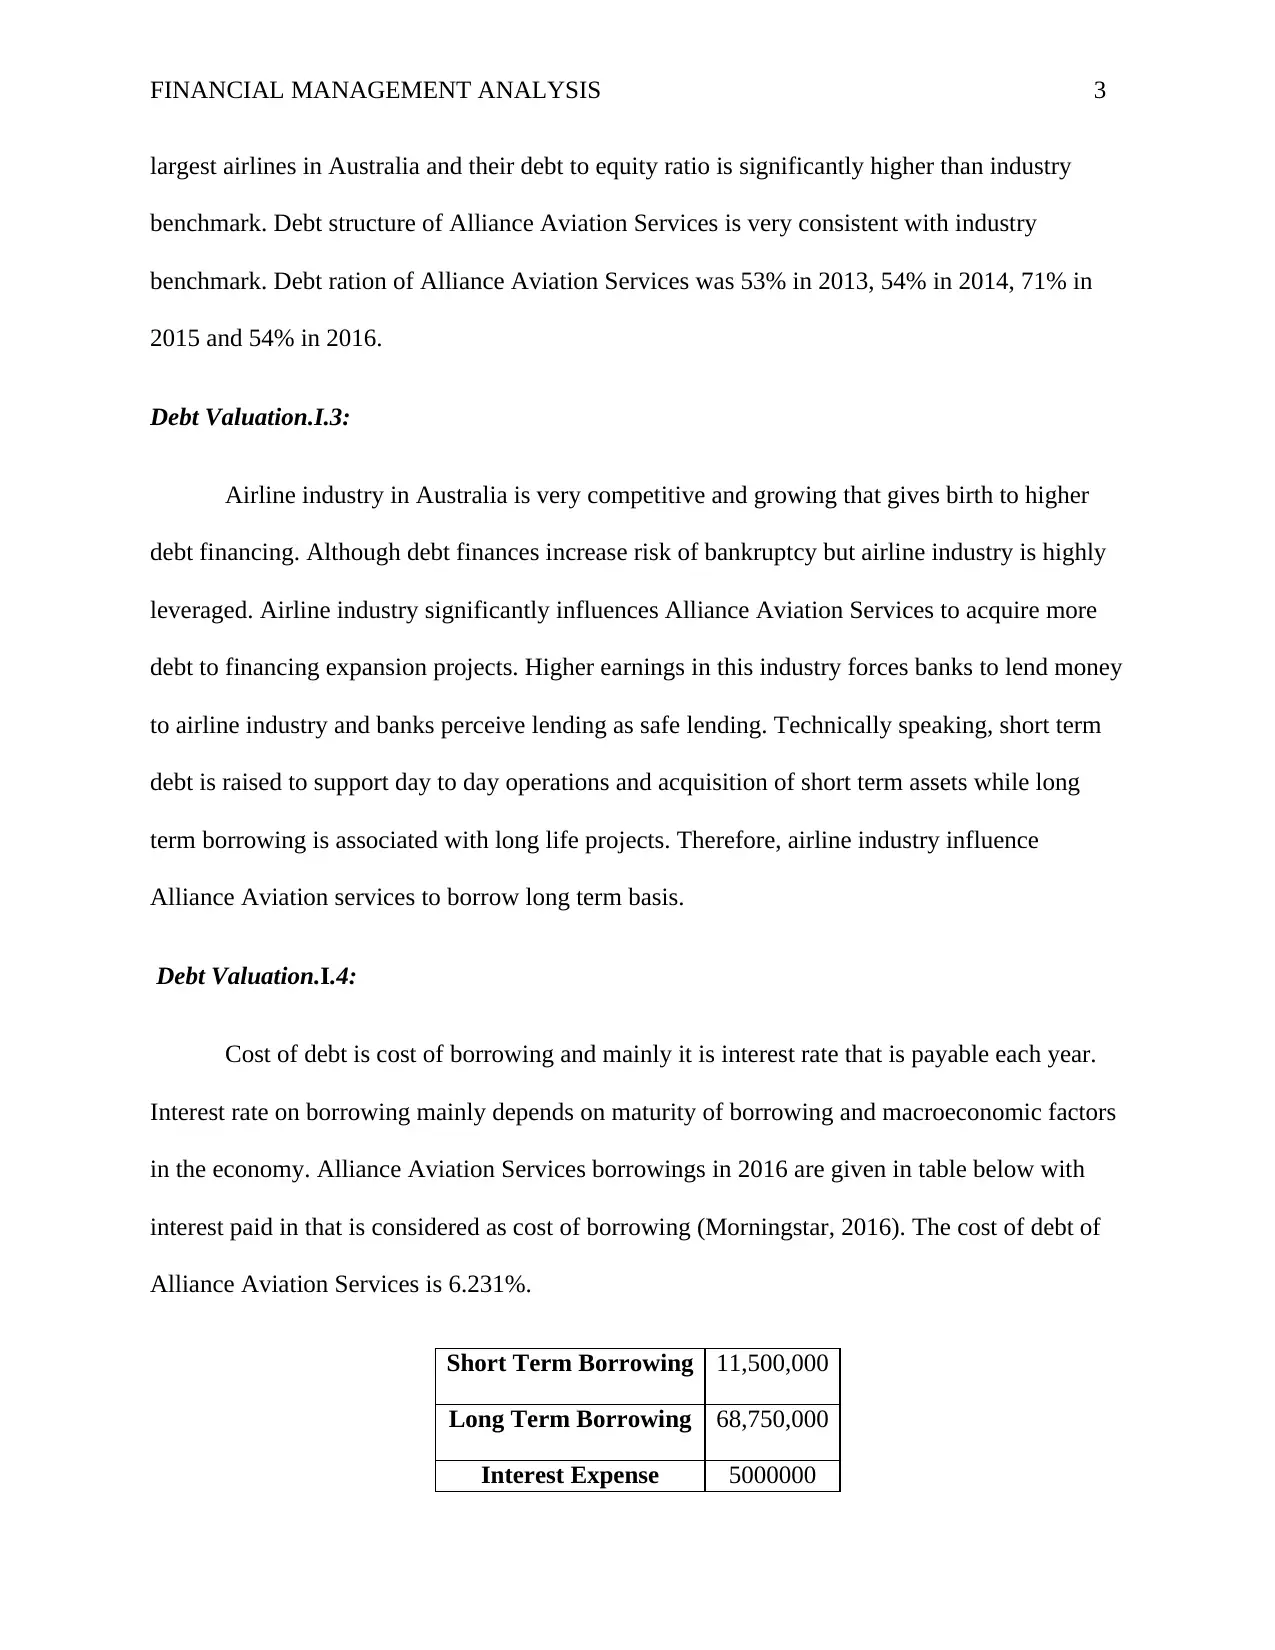
largest airlines in Australia and their debt to equity ratio is significantly higher than industry
benchmark. Debt structure of Alliance Aviation Services is very consistent with industry
benchmark. Debt ration of Alliance Aviation Services was 53% in 2013, 54% in 2014, 71% in
2015 and 54% in 2016.
Debt Valuation.I.3:
Airline industry in Australia is very competitive and growing that gives birth to higher
debt financing. Although debt finances increase risk of bankruptcy but airline industry is highly
leveraged. Airline industry significantly influences Alliance Aviation Services to acquire more
debt to financing expansion projects. Higher earnings in this industry forces banks to lend money
to airline industry and banks perceive lending as safe lending. Technically speaking, short term
debt is raised to support day to day operations and acquisition of short term assets while long
term borrowing is associated with long life projects. Therefore, airline industry influence
Alliance Aviation services to borrow long term basis.
Debt Valuation.I.4:
Cost of debt is cost of borrowing and mainly it is interest rate that is payable each year.
Interest rate on borrowing mainly depends on maturity of borrowing and macroeconomic factors
in the economy. Alliance Aviation Services borrowings in 2016 are given in table below with
interest paid in that is considered as cost of borrowing (Morningstar, 2016). The cost of debt of
Alliance Aviation Services is 6.231%.
Short Term Borrowing 11,500,000
Long Term Borrowing 68,750,000
Interest Expense 5000000
⊘ This is a preview!⊘
Do you want full access?
Subscribe today to unlock all pages.
Trusted by 1+ million students worldwide
FINANCIAL MANAGEMENT ANALYSIS 4
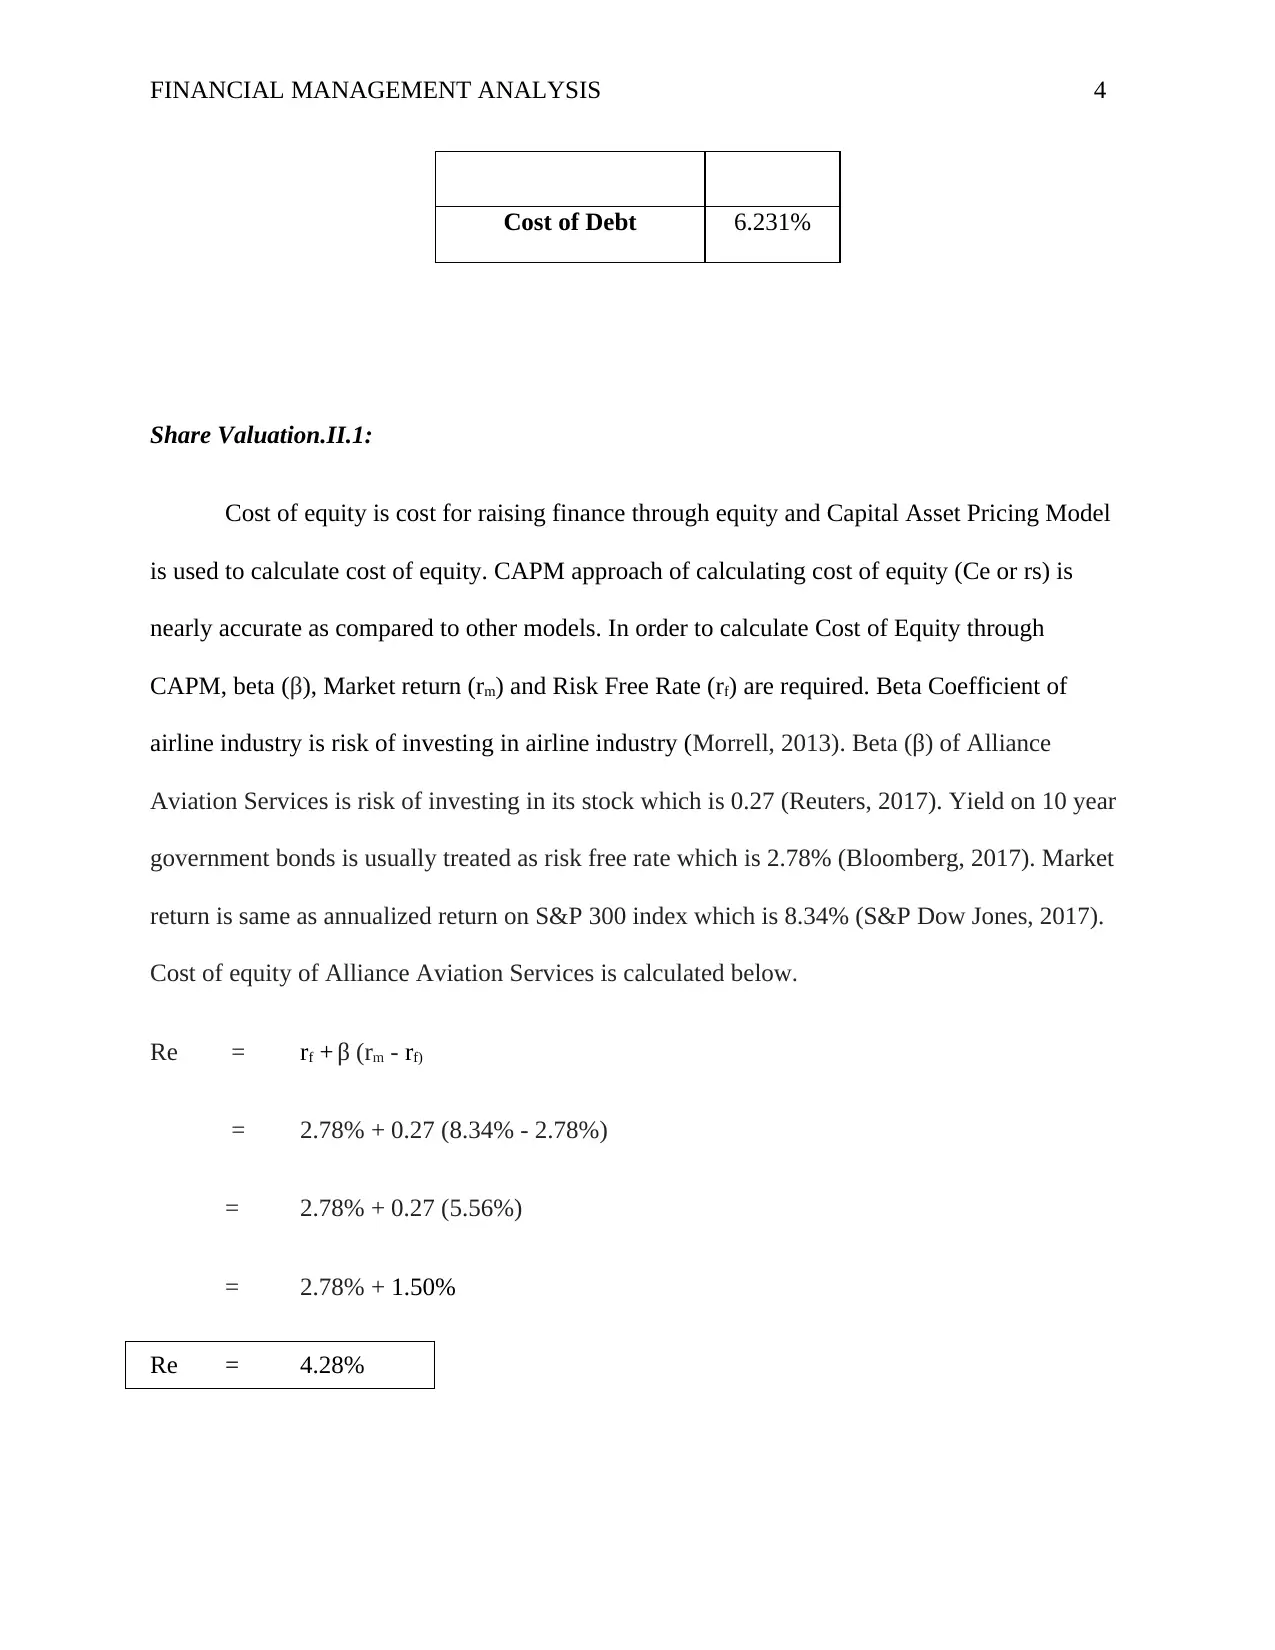
Cost of Debt 6.231%
Share Valuation.II.1:
Cost of equity is cost for raising finance through equity and Capital Asset Pricing Model
is used to calculate cost of equity. CAPM approach of calculating cost of equity (Ce or rs) is
nearly accurate as compared to other models. In order to calculate Cost of Equity through
CAPM, beta (β), Market return (rm) and Risk Free Rate (rf) are required. Beta Coefficient of
airline industry is risk of investing in airline industry (Morrell, 2013). Beta (β) of Alliance
Aviation Services is risk of investing in its stock which is 0.27 (Reuters, 2017). Yield on 10 year
government bonds is usually treated as risk free rate which is 2.78% (Bloomberg, 2017). Market
return is same as annualized return on S&P 300 index which is 8.34% (S&P Dow Jones, 2017).
Cost of equity of Alliance Aviation Services is calculated below.
Re = rf + β (rm - rf)
= 2.78% + 0.27 (8.34% - 2.78%)
= 2.78% + 0.27 (5.56%)
= 2.78% + 1.50%
Re = 4.28%
Paraphrase This Document
Need a fresh take? Get an instant paraphrase of this document with our AI Paraphraser
FINANCIAL MANAGEMENT ANALYSIS 5
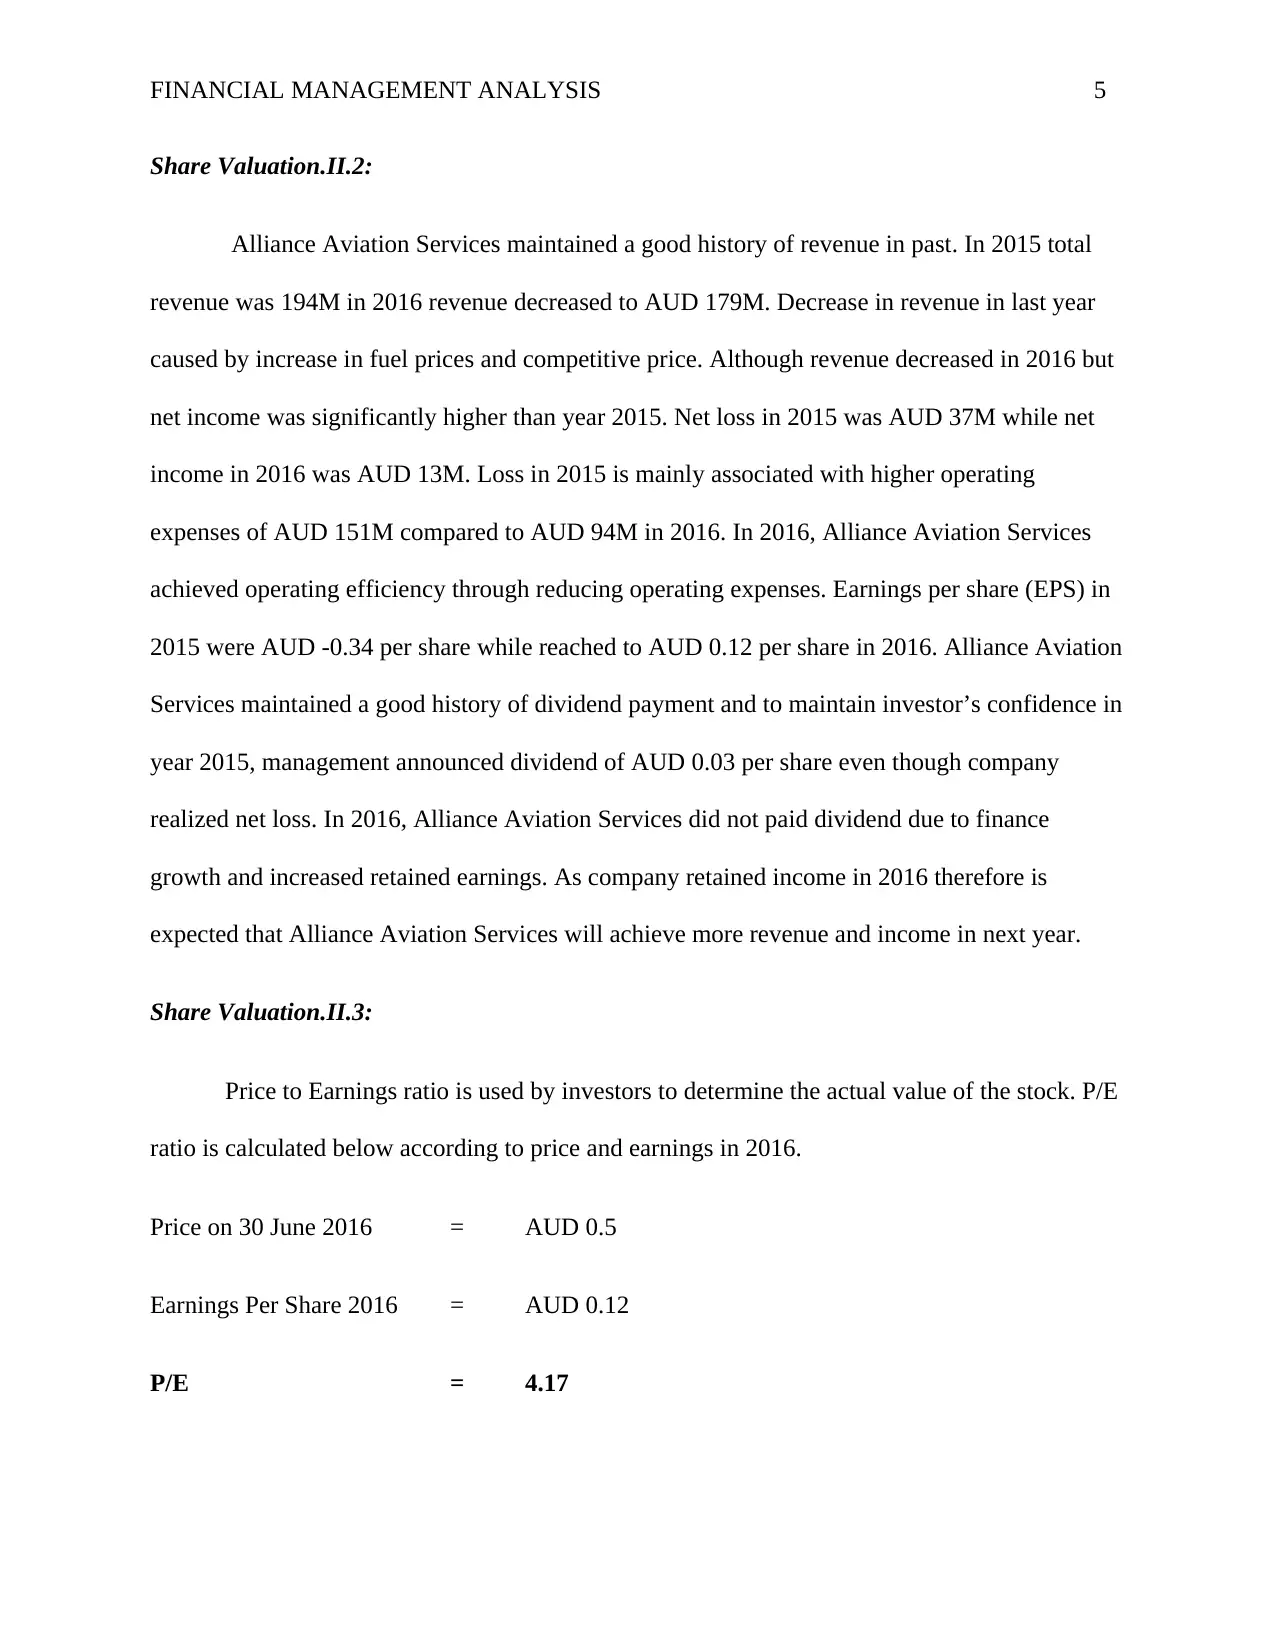
Share Valuation.II.2:
Alliance Aviation Services maintained a good history of revenue in past. In 2015 total
revenue was 194M in 2016 revenue decreased to AUD 179M. Decrease in revenue in last year
caused by increase in fuel prices and competitive price. Although revenue decreased in 2016 but
net income was significantly higher than year 2015. Net loss in 2015 was AUD 37M while net
income in 2016 was AUD 13M. Loss in 2015 is mainly associated with higher operating
expenses of AUD 151M compared to AUD 94M in 2016. In 2016, Alliance Aviation Services
achieved operating efficiency through reducing operating expenses. Earnings per share (EPS) in
2015 were AUD -0.34 per share while reached to AUD 0.12 per share in 2016. Alliance Aviation
Services maintained a good history of dividend payment and to maintain investor’s confidence in
year 2015, management announced dividend of AUD 0.03 per share even though company
realized net loss. In 2016, Alliance Aviation Services did not paid dividend due to finance
growth and increased retained earnings. As company retained income in 2016 therefore is
expected that Alliance Aviation Services will achieve more revenue and income in next year.
Share Valuation.II.3:
Price to Earnings ratio is used by investors to determine the actual value of the stock. P/E
ratio is calculated below according to price and earnings in 2016.
Price on 30 June 2016 = AUD 0.5
Earnings Per Share 2016 = AUD 0.12
P/E = 4.17
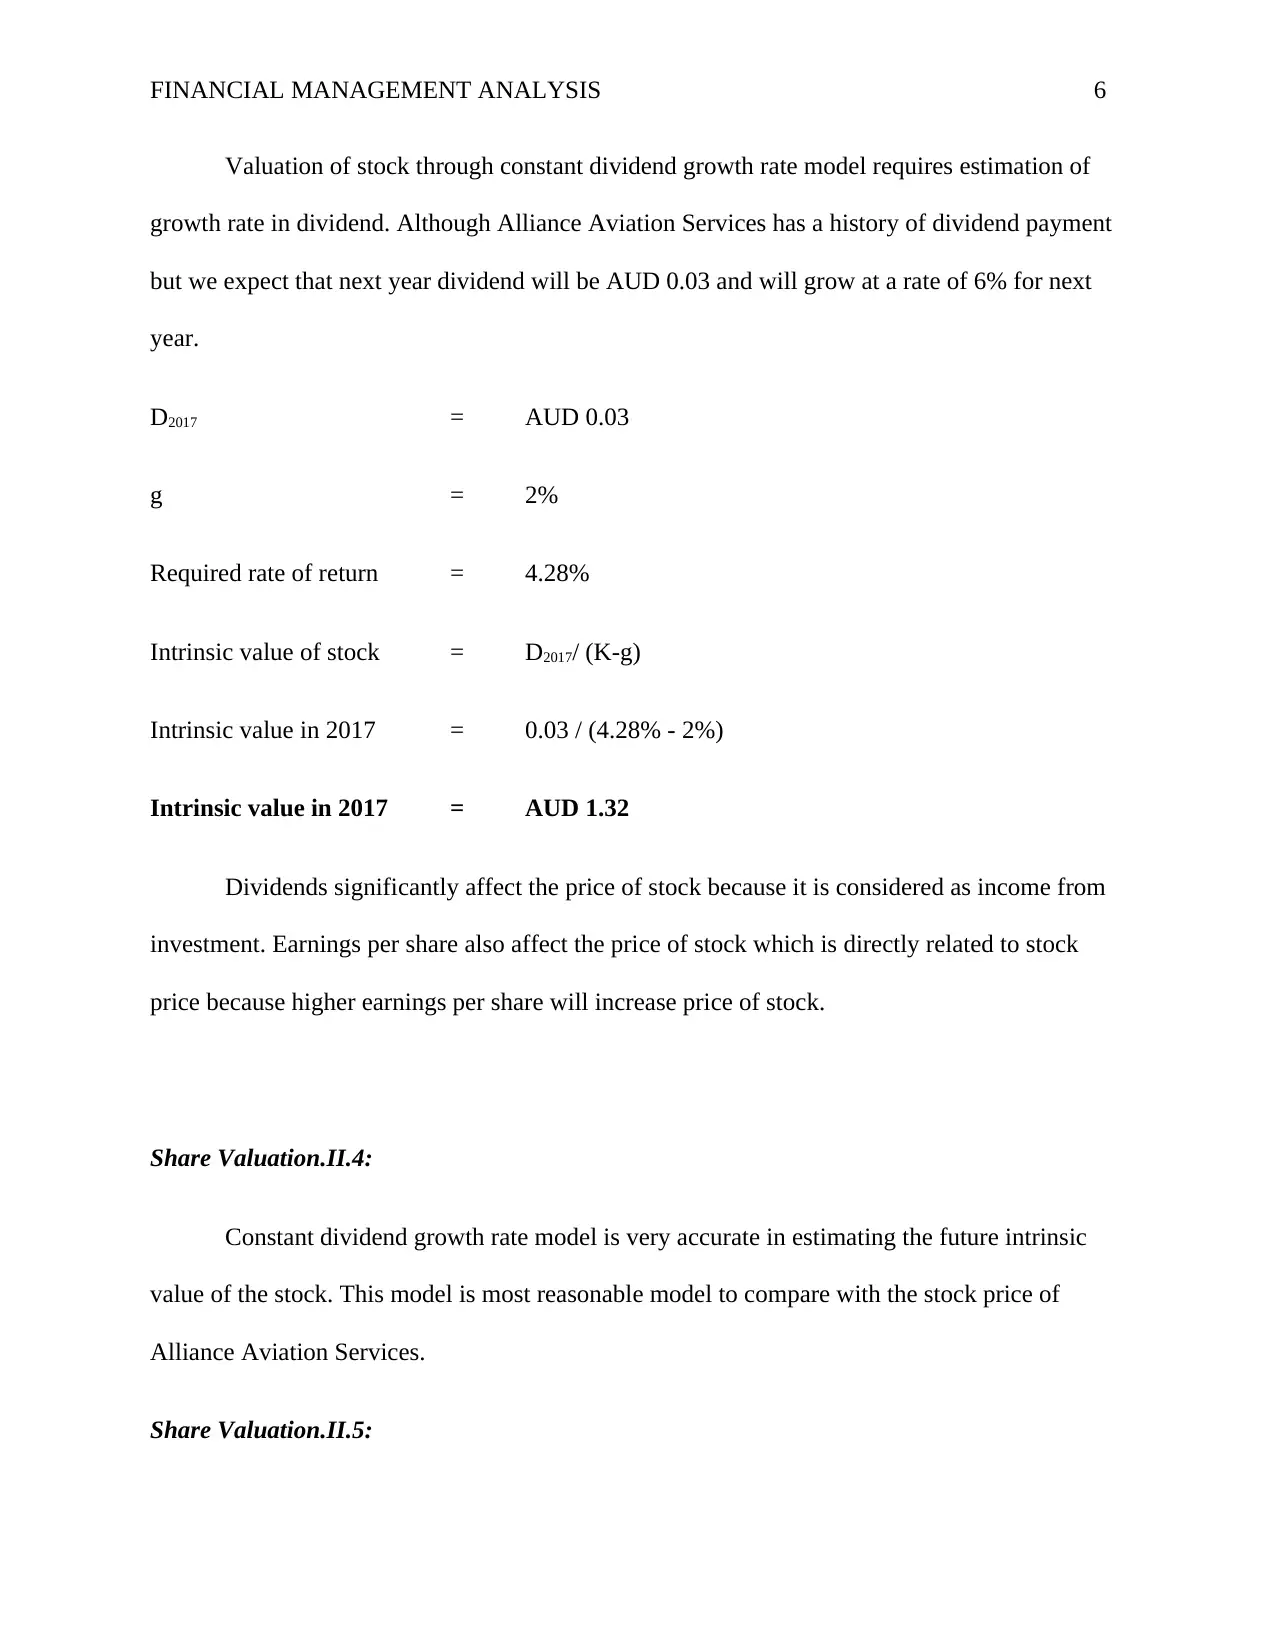
FINANCIAL MANAGEMENT ANALYSIS 6
Valuation of stock through constant dividend growth rate model requires estimation of
growth rate in dividend. Although Alliance Aviation Services has a history of dividend payment
but we expect that next year dividend will be AUD 0.03 and will grow at a rate of 6% for next
year.
D2017 = AUD 0.03
g = 2%
Required rate of return = 4.28%
Intrinsic value of stock = D2017/ (K-g)
Intrinsic value in 2017 = 0.03 / (4.28% - 2%)
Intrinsic value in 2017 = AUD 1.32
Dividends significantly affect the price of stock because it is considered as income from
investment. Earnings per share also affect the price of stock which is directly related to stock
price because higher earnings per share will increase price of stock.
Share Valuation.II.4:
Constant dividend growth rate model is very accurate in estimating the future intrinsic
value of the stock. This model is most reasonable model to compare with the stock price of
Alliance Aviation Services.
Share Valuation.II.5:
⊘ This is a preview!⊘
Do you want full access?
Subscribe today to unlock all pages.
Trusted by 1+ million students worldwide
FINANCIAL MANAGEMENT ANALYSIS 7
Share valuation is based on the forecast but accurate data will help to estimate an
accurate stock price. For good forecast, information such as management intention, future
projects and macroeconomic factors is necessary. This information will help to estimate a true
next year dividend and growth rate of dividends.
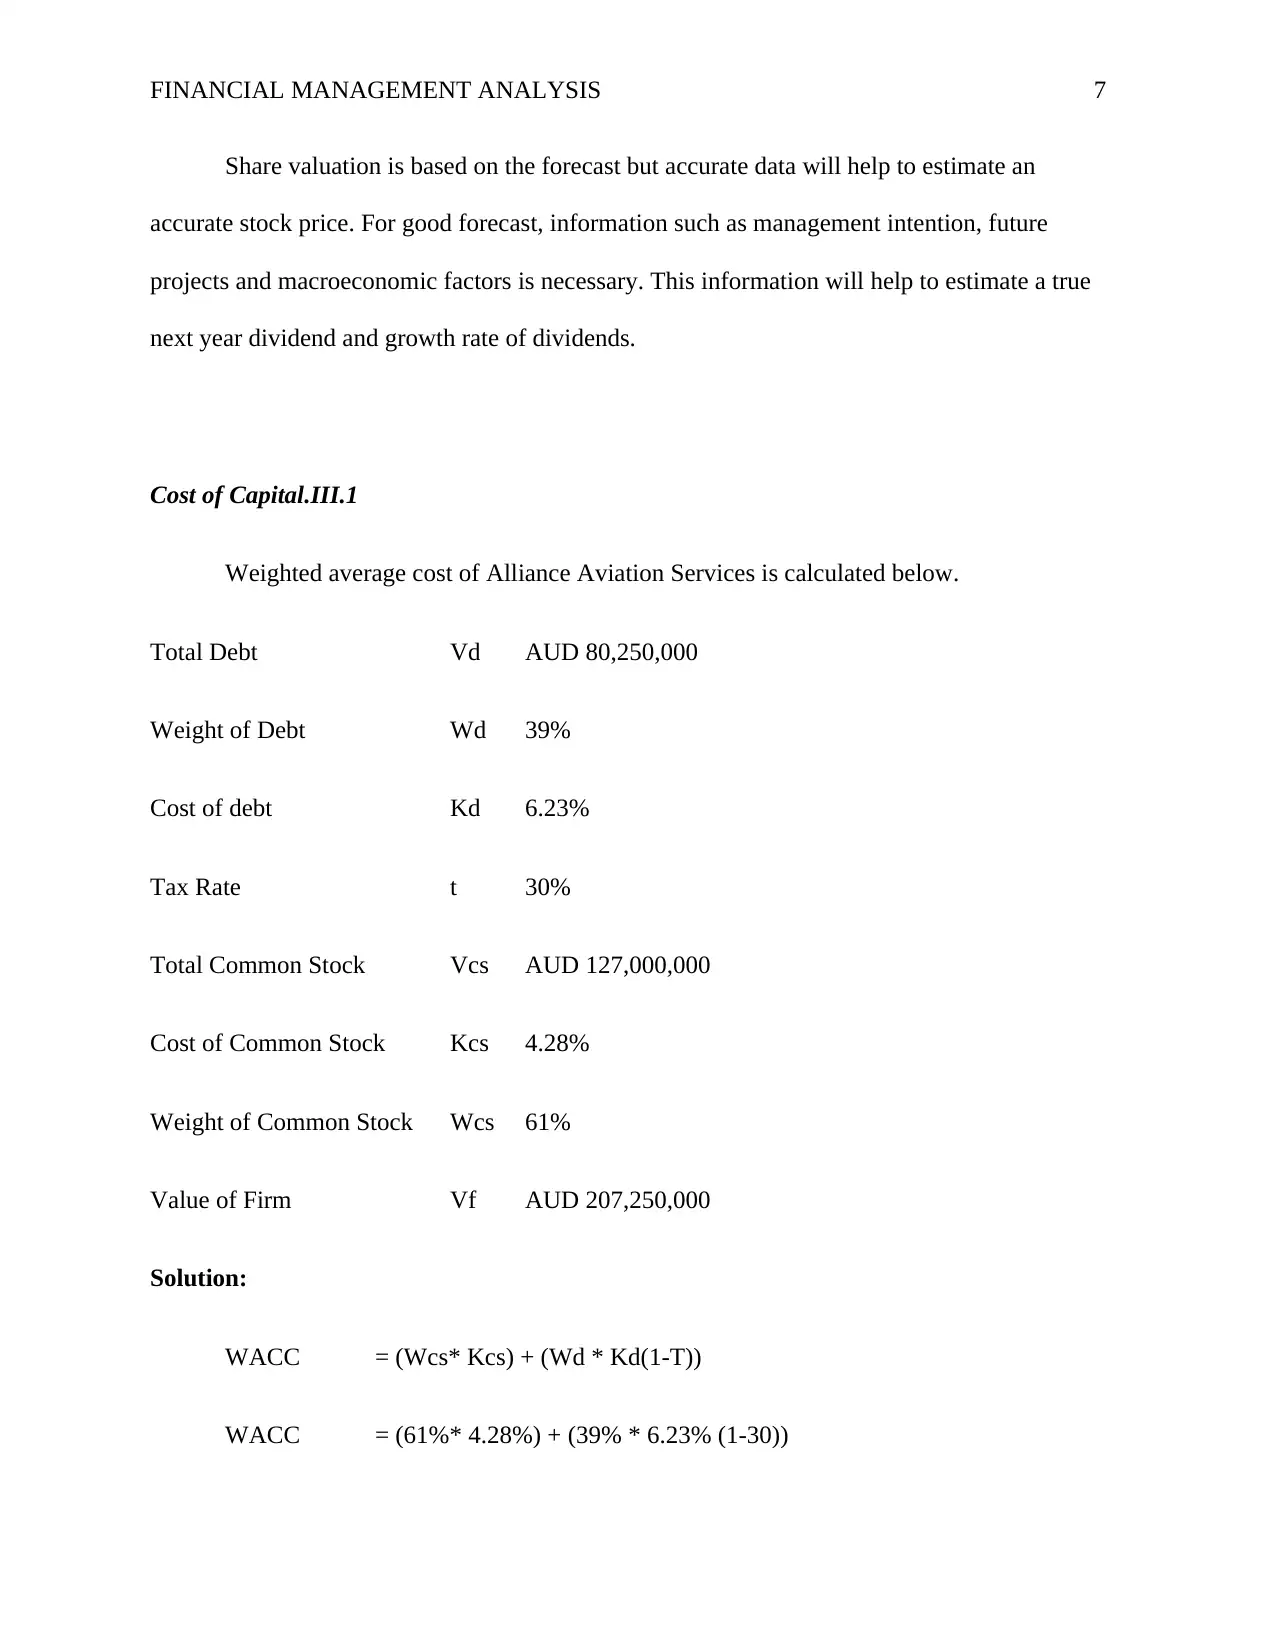
Cost of Capital.III.1
Weighted average cost of Alliance Aviation Services is calculated below.
Total Debt Vd AUD 80,250,000
Weight of Debt Wd 39%
Cost of debt Kd 6.23%
Tax Rate t 30%
Total Common Stock Vcs AUD 127,000,000
Cost of Common Stock Kcs 4.28%
Weight of Common Stock Wcs 61%
Value of Firm Vf AUD 207,250,000
Solution:
WACC = (Wcs* Kcs) + (Wd * Kd(1-T))
WACC = (61%* 4.28%) + (39% * 6.23% (1-30))
Share valuation is based on the forecast but accurate data will help to estimate an
accurate stock price. For good forecast, information such as management intention, future
projects and macroeconomic factors is necessary. This information will help to estimate a true
next year dividend and growth rate of dividends.
Cost of Capital.III.1
Weighted average cost of Alliance Aviation Services is calculated below.
Total Debt Vd AUD 80,250,000
Weight of Debt Wd 39%
Cost of debt Kd 6.23%
Tax Rate t 30%
Total Common Stock Vcs AUD 127,000,000
Cost of Common Stock Kcs 4.28%
Weight of Common Stock Wcs 61%
Value of Firm Vf AUD 207,250,000
Solution:
WACC = (Wcs* Kcs) + (Wd * Kd(1-T))
WACC = (61%* 4.28%) + (39% * 6.23% (1-30))
Paraphrase This Document
Need a fresh take? Get an instant paraphrase of this document with our AI Paraphraser
FINANCIAL MANAGEMENT ANALYSIS 8
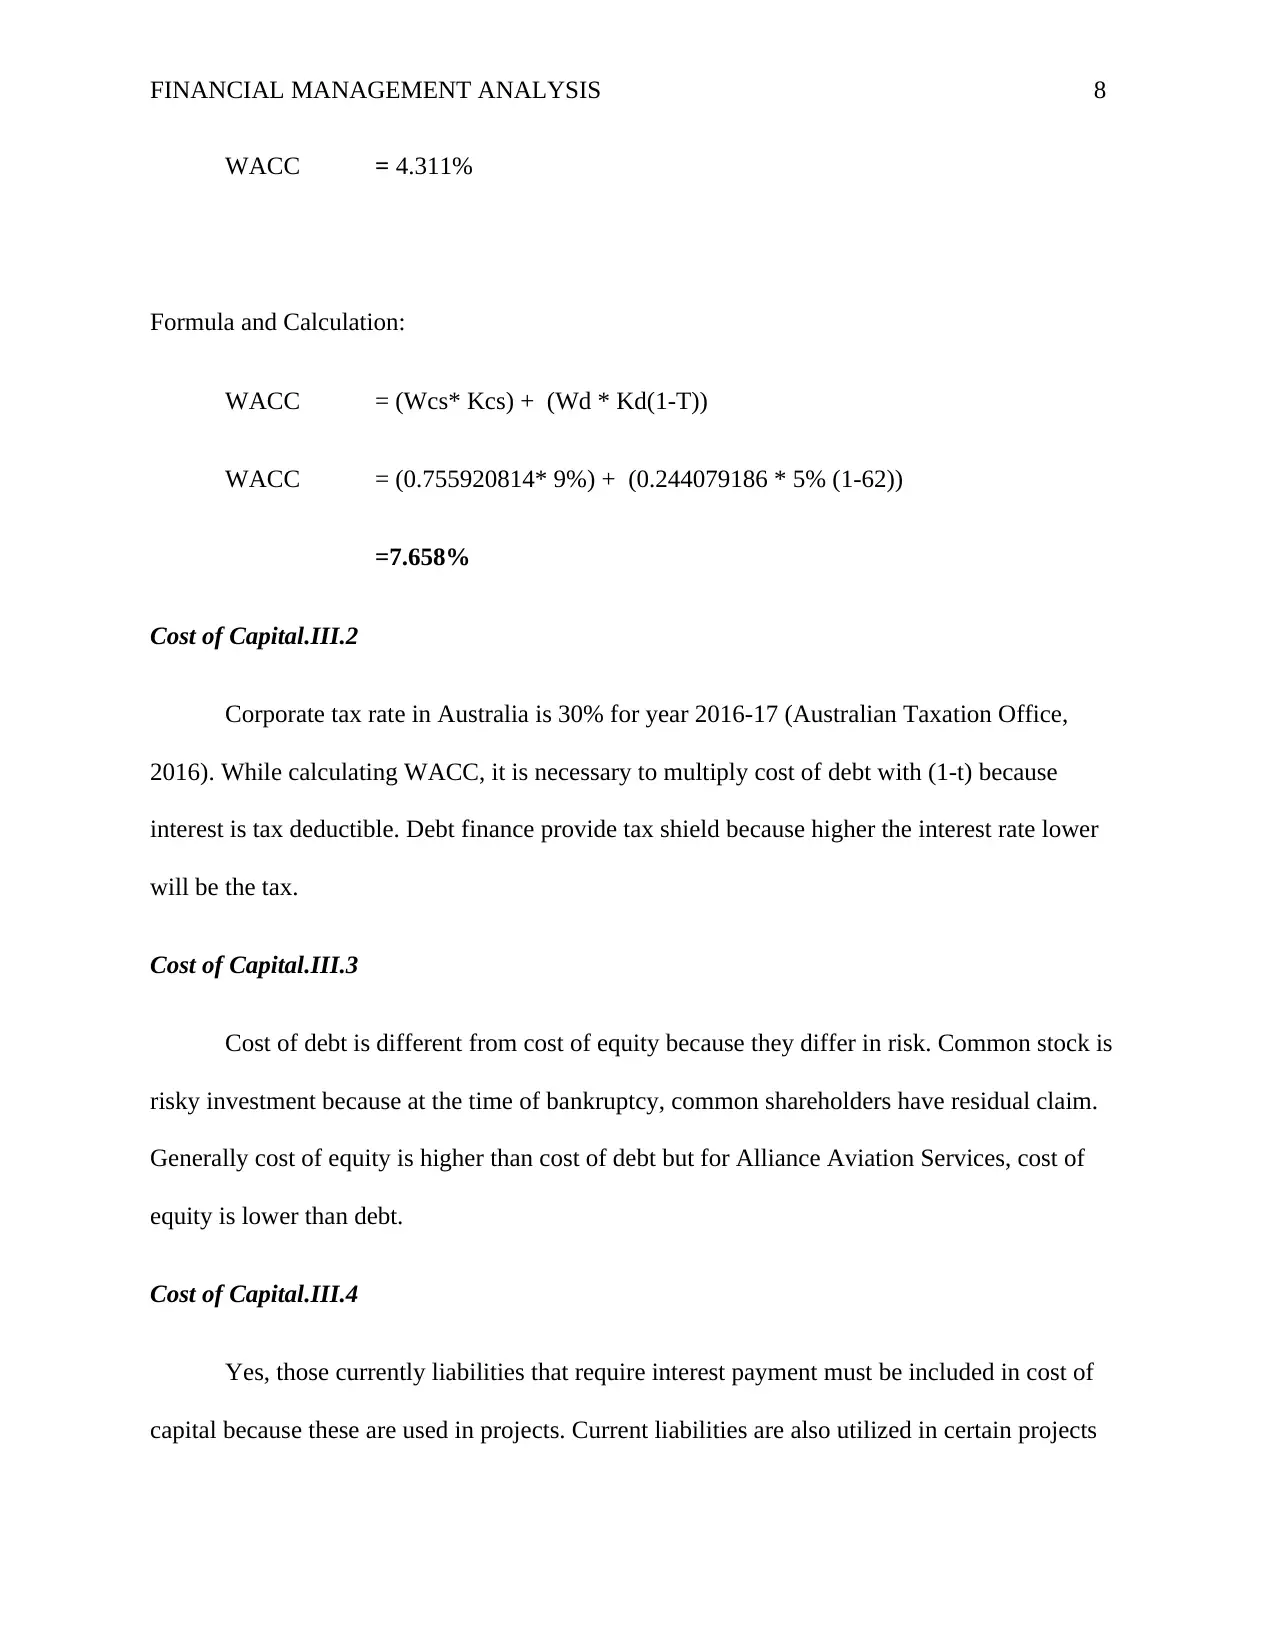
WACC = 4.311%
Formula and Calculation:
WACC = (Wcs* Kcs) + (Wd * Kd(1-T))
WACC = (0.755920814* 9%) + (0.244079186 * 5% (1-62))
=7.658%
Cost of Capital.III.2
Corporate tax rate in Australia is 30% for year 2016-17 (Australian Taxation Office,
2016). While calculating WACC, it is necessary to multiply cost of debt with (1-t) because
interest is tax deductible. Debt finance provide tax shield because higher the interest rate lower
will be the tax.
Cost of Capital.III.3
Cost of debt is different from cost of equity because they differ in risk. Common stock is
risky investment because at the time of bankruptcy, common shareholders have residual claim.
Generally cost of equity is higher than cost of debt but for Alliance Aviation Services, cost of
equity is lower than debt.
Cost of Capital.III.4
Yes, those currently liabilities that require interest payment must be included in cost of
capital because these are used in projects. Current liabilities are also utilized in certain projects
FINANCIAL MANAGEMENT ANALYSIS 9
and are necessary to paid in short period of time. Considering current liability in cost of capital
will give a tough hurdle rate that is will help in evaluating large projects.
Cost of Capital.III.5
Major value of WACC is cost of equity because it is not tax deductible and portion of
common equity is higher than debt. As common equity has major value in WACC therefore,
management prefers to finance projects with debt financing to achieve a lower cost of capital.
Lower cost of capital will increase return on investment.
Cost of Capital.III.6
Alliance Aviation Services use Weighted Average Cost of Capital for evaluation of
projects. Alliance Aviation Services use WACC because it helps management to achieve a target
return on projects. WACC is calculated according to the average cost of all sources of finances
and hence provide accurate results.
Cost of Capital.III.7
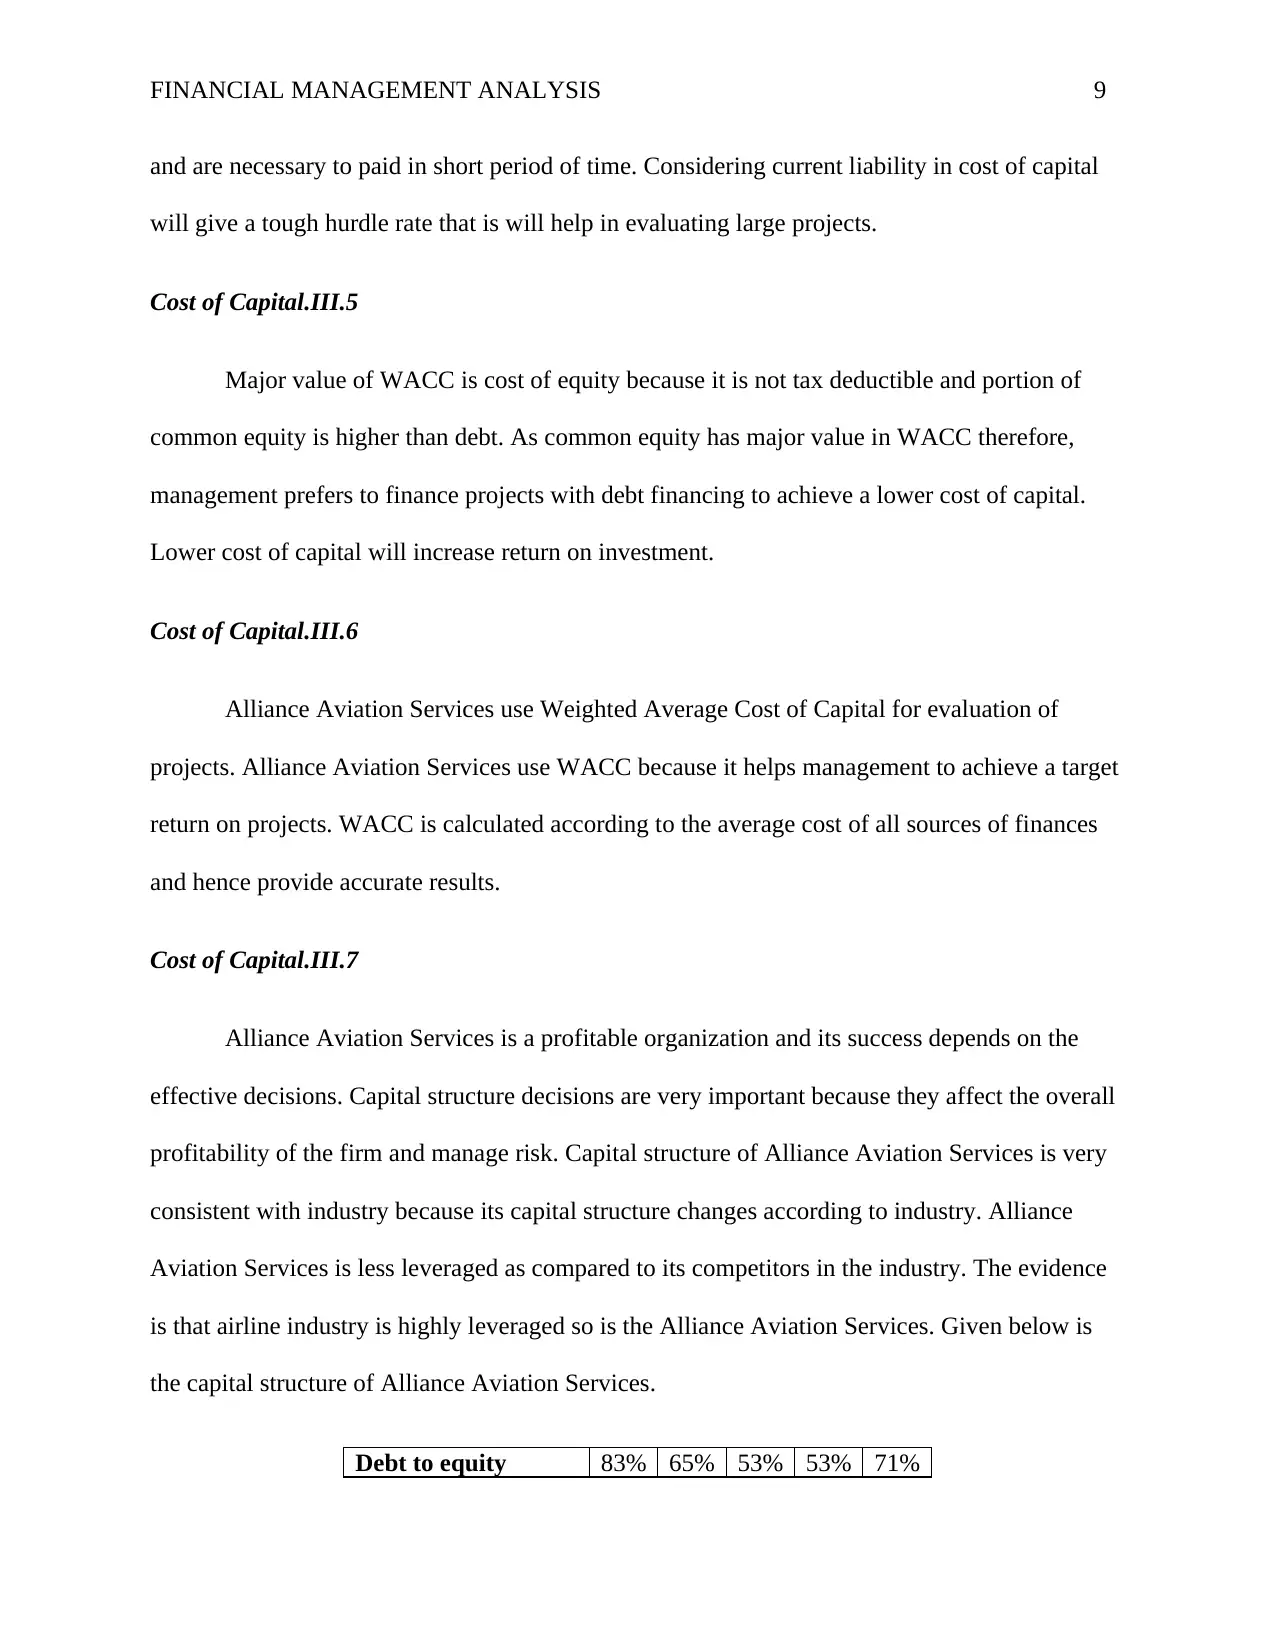
Alliance Aviation Services is a profitable organization and its success depends on the
effective decisions. Capital structure decisions are very important because they affect the overall
profitability of the firm and manage risk. Capital structure of Alliance Aviation Services is very
consistent with industry because its capital structure changes according to industry. Alliance
Aviation Services is less leveraged as compared to its competitors in the industry. The evidence
is that airline industry is highly leveraged so is the Alliance Aviation Services. Given below is
the capital structure of Alliance Aviation Services.
Debt to equity 83% 65% 53% 53% 71%
and are necessary to paid in short period of time. Considering current liability in cost of capital
will give a tough hurdle rate that is will help in evaluating large projects.
Cost of Capital.III.5
Major value of WACC is cost of equity because it is not tax deductible and portion of
common equity is higher than debt. As common equity has major value in WACC therefore,
management prefers to finance projects with debt financing to achieve a lower cost of capital.
Lower cost of capital will increase return on investment.
Cost of Capital.III.6
Alliance Aviation Services use Weighted Average Cost of Capital for evaluation of
projects. Alliance Aviation Services use WACC because it helps management to achieve a target
return on projects. WACC is calculated according to the average cost of all sources of finances
and hence provide accurate results.
Cost of Capital.III.7
Alliance Aviation Services is a profitable organization and its success depends on the
effective decisions. Capital structure decisions are very important because they affect the overall
profitability of the firm and manage risk. Capital structure of Alliance Aviation Services is very
consistent with industry because its capital structure changes according to industry. Alliance
Aviation Services is less leveraged as compared to its competitors in the industry. The evidence
is that airline industry is highly leveraged so is the Alliance Aviation Services. Given below is
the capital structure of Alliance Aviation Services.
Debt to equity 83% 65% 53% 53% 71%
⊘ This is a preview!⊘
Do you want full access?
Subscribe today to unlock all pages.
Trusted by 1+ million students worldwide
FINANCIAL MANAGEMENT ANALYSIS 10
ration
Cost of Capital.III.8
Optimal capital structure can be defined as capital structure which is less risky and result
in lower cost of capital (Miao, 2005). Optimal capital structure differ for each industry and
optimal capital structure in airline industry is 50% or below. It is difficult to generalize optimal
capital structure for whole industry but researchers are in consensus that optimal capital structure
of airline industry is 50%. Demand and cost of different source drive capital structure because
higher demand increase operations and management will raise more finances.
Market Analysis.IV.1:
Alliance Aviation Airline is very healthy and growing business. Key performance
indicators such as revenue, net income and Return on Invested Capital shows a growth trend.
The overall performance of Alliance Aviation Airline is better than its competitors because it has
achieved operating efficiency. Alliance Aviation Services Limited is performing better than its
competitors in all perspectives. Alliance Aviation Services Limited dominates the charter market
in airline industry which is strength of this firm. Higher market share in charter market in airline
industry grabs the attention of competitors. According to Freed, Virgin Airline proposed Alliance
Aviation Services for partnership in charter market to fight resource shortage (Freed, 2016).
Market Analysis.IV.2:
Paraphrase This Document
Need a fresh take? Get an instant paraphrase of this document with our AI Paraphraser
FINANCIAL MANAGEMENT ANALYSIS 11
Alliance Aviation Services is a competitive organization in Australia because it is
expecting higher growth in next decade. Although Alliance Aviation is expecting higher growth
in next decade while financial analyst showed a great concern regarding high leverage. Alliance
Aviation is less leveraged compared to industry leaders but it can lead to tough financial
situation in next decade. According to Haas, Alliance Aviation Services can borrow more money
because it has a good interest coverage ratio which is as much as 5 times (Haas, 2017).
Market Analysis.IV.3:
Alliance Aviation Services is consistent to industry in every aspect whether it is capital
structure or corporate strategies. In competitive business environment every organization must
pursue stable growth with focus on risk of management take over. Management take over happen
when one shareholder or institution hold more than 50% of total shares issued. Alliance Aviation
is following a very safe strategy to avoid management take over. Only 27% of shares are owned
by large a shareholder that is evidence that Alliance Aviation Service is secure from management
takeover by shareholders (Financial Times, 2017).
FINANCIAL MANAGEMENT ANALYSIS 12
References
Australian Taxation Office., 2016. Company tax rates. Australian Taxation Office Official. Data
retrieved from https://www.ato.gov.au/Rates/Company-tax/
Bloomberg., 2017. Australian Rates & Bonds. Bloomberg Official. Data retrieved from
https://www.bloomberg.com/markets/rates-bonds/government-bonds/australia
Financial Times., 2017. Alliance Aviation Services Limited. Financial Times Official. Data
retrieved from https://markets.ft.com/data/equities/tearsheet/profile?s=AQZ:ASX&mhq5j=e7
Freed, J., 2016. Virgin Australia looks to Alliance Aviation deal amid mining downturn. The
Sydney Morning Herald. Data retrieved from http://www.smh.com.au/business/aviation/virgin-
australia-looks-to-alliance-aviation-deal-amid-mining-downturn-20160429-goid82.html
Haas, A., 2017. How Financially Strong Is Alliance Aviation Services Limited (ASX:AQZ)?.
Simply Wall. Data retrieved from https://simplywall.st/news/2017/09/29/how-financially-strong-
is-alliance-aviation-services-limited-asxaqz/
Miao, J., 2005. Optimal capital structure and industry dynamics. The Journal of finance, 60(6),
pp.2621-2659. Data retrieved from http://people.bu.edu/miaoj/IndustryJF.pdf
Morrell, P.S., 2013. Airline finance. Ashgate Publishing, Ltd. Data retrieved from
https://books.google.com.pk/books?
hl=en&lr=&id=VszVCQAAQBAJ&oi=fnd&pg=PR9&dq=debt+financing+in+australian+airline
+industry&ots=sXaoeG30FQ&sig=C_HlNbLf8oU_aFM5w33adzjmF6s#v=onepage&q=airline
%20industry%20debt&f=false
⊘ This is a preview!⊘
Do you want full access?
Subscribe today to unlock all pages.
Trusted by 1+ million students worldwide
1 out of 13
Related Documents


Your All-in-One AI-Powered Toolkit for Academic Success.
+13062052269
info@desklib.com
Available 24*7 on WhatsApp / Email
![[object Object]](/_next/static/media/star-bottom.7253800d.svg)
Unlock your academic potential
Copyright © 2020–2026 A2Z Services. All Rights Reserved. Developed and managed by ZUCOL.