Financial Management Report: Valuation, Appraisal, and Techniques
VerifiedAdded on 2023/01/11
|14
|3957
|67
Report
AI Summary
This financial management report provides a comprehensive analysis of valuation techniques, including price/earnings ratio, dividend valuation, and discounted cash flow methods, applied to Trojan plc. It critically evaluates each method, highlighting their strengths and weaknesses in the context of mergers and takeovers. The report further delves into investment appraisal techniques, specifically the payback period, accounting rate of return, net present value, and internal rate of return. It applies these techniques to a case study, calculating relevant metrics and evaluating their benefits and limitations to determine the viability of an investment. The report emphasizes the importance of selecting appropriate valuation and appraisal methods for sound financial decision-making, concluding with recommendations for practical application.

FINANCIAL MANAGEMENT
Paraphrase This Document
Need a fresh take? Get an instant paraphrase of this document with our AI Paraphraser

TABLE OF CONTENTS
QUESTION 2 – MERGERS AND TAKEOVERS...................................................................3
Calculating the value of Trojan plc using the following valuation methods.........................3
Critical evaluation of various valuation techniques...............................................................4
QUESTION 3 – INVESTMENT APPRAISAL........................................................................7
1. Application of different investment appraisal techniques..................................................7
2. Benefits and limitations of different investment appraisal techniques............................11
REFERENCES.........................................................................................................................14
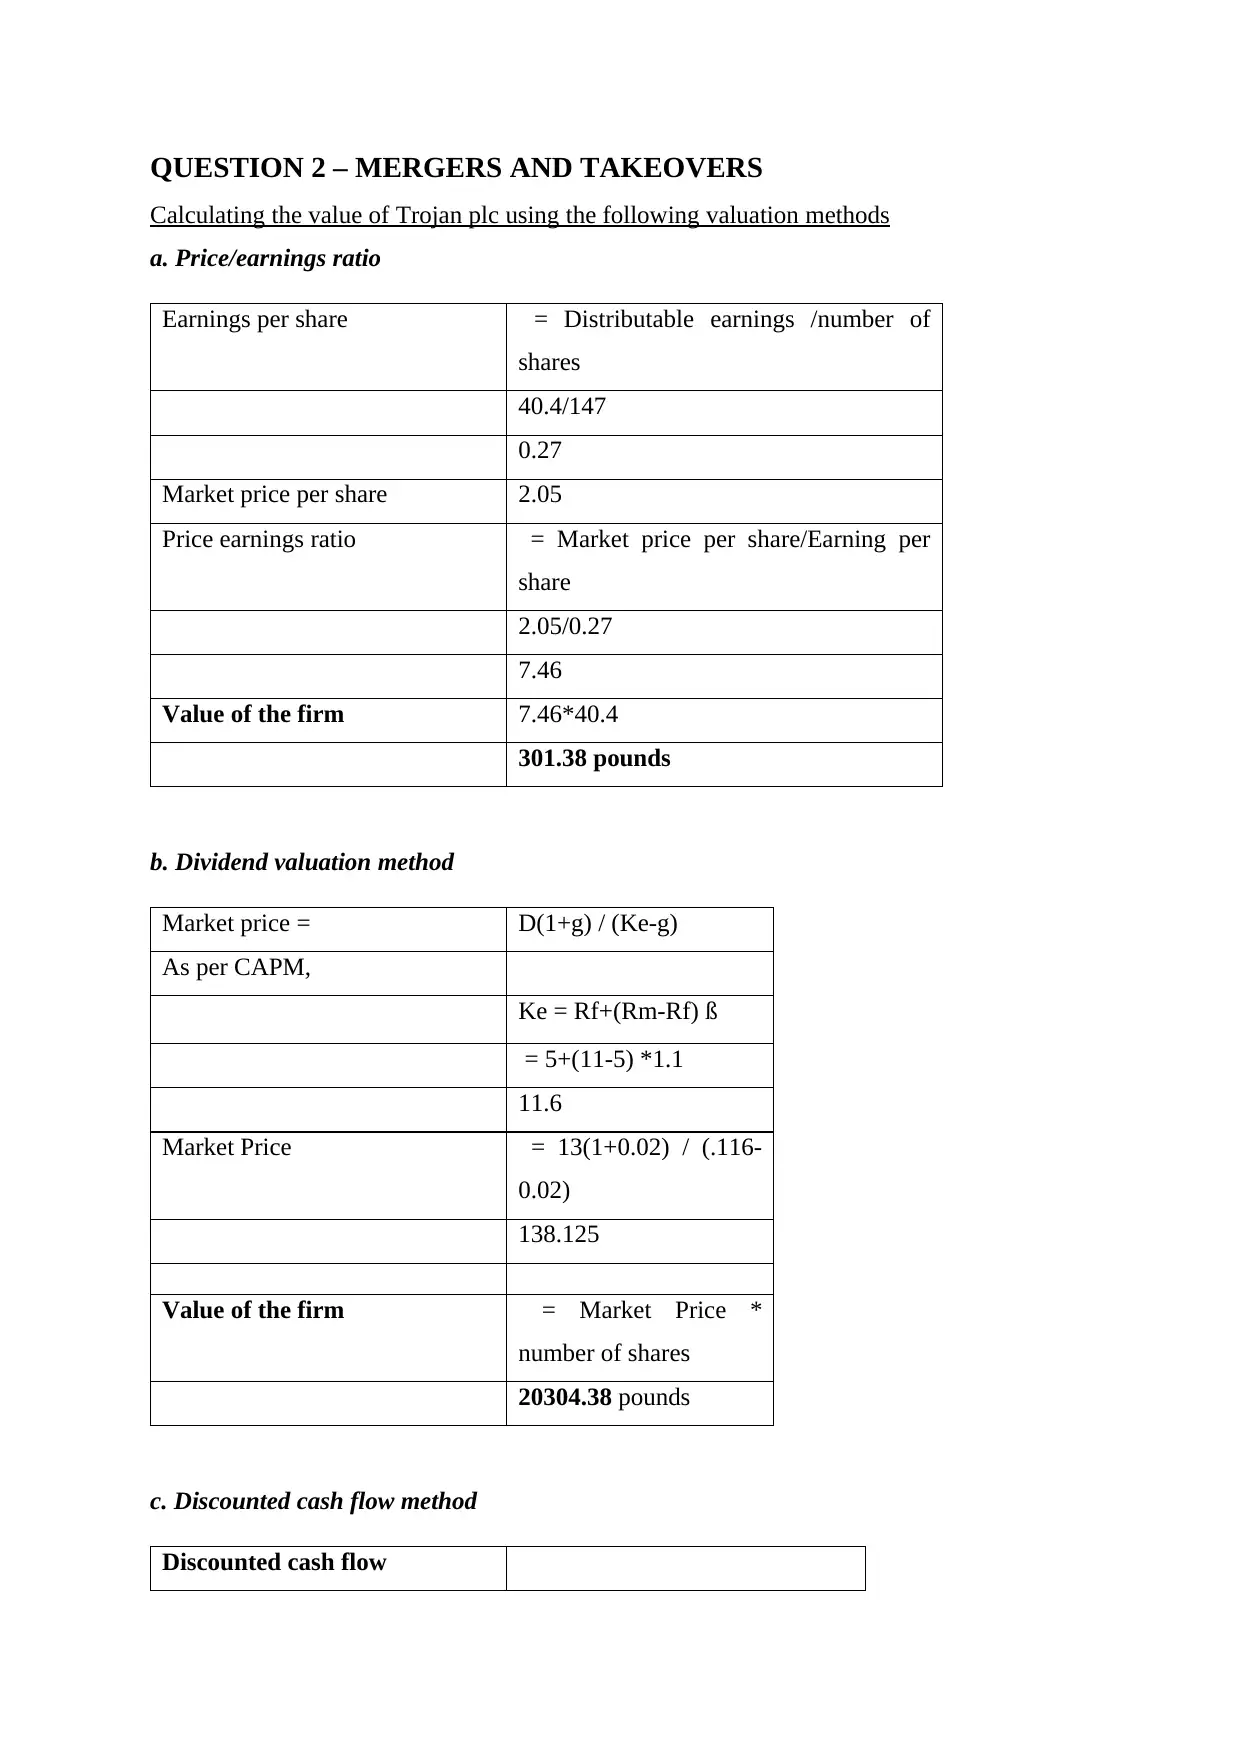
QUESTION 2 – MERGERS AND TAKEOVERS
Calculating the value of Trojan plc using the following valuation methods
a. Price/earnings ratio
Earnings per share = Distributable earnings /number of
shares
40.4/147
0.27
Market price per share 2.05
Price earnings ratio = Market price per share/Earning per
share
2.05/0.27
7.46
Value of the firm 7.46*40.4
301.38 pounds
b. Dividend valuation method
Market price = D(1+g) / (Ke-g)
As per CAPM,
Ke = Rf+(Rm-Rf) ß
= 5+(11-5) *1.1
11.6
Market Price = 13(1+0.02) / (.116-
0.02)
138.125
Value of the firm = Market Price *
number of shares
20304.38 pounds
c. Discounted cash flow method
Discounted cash flow
⊘ This is a preview!⊘
Do you want full access?
Subscribe today to unlock all pages.
Trusted by 1+ million students worldwide
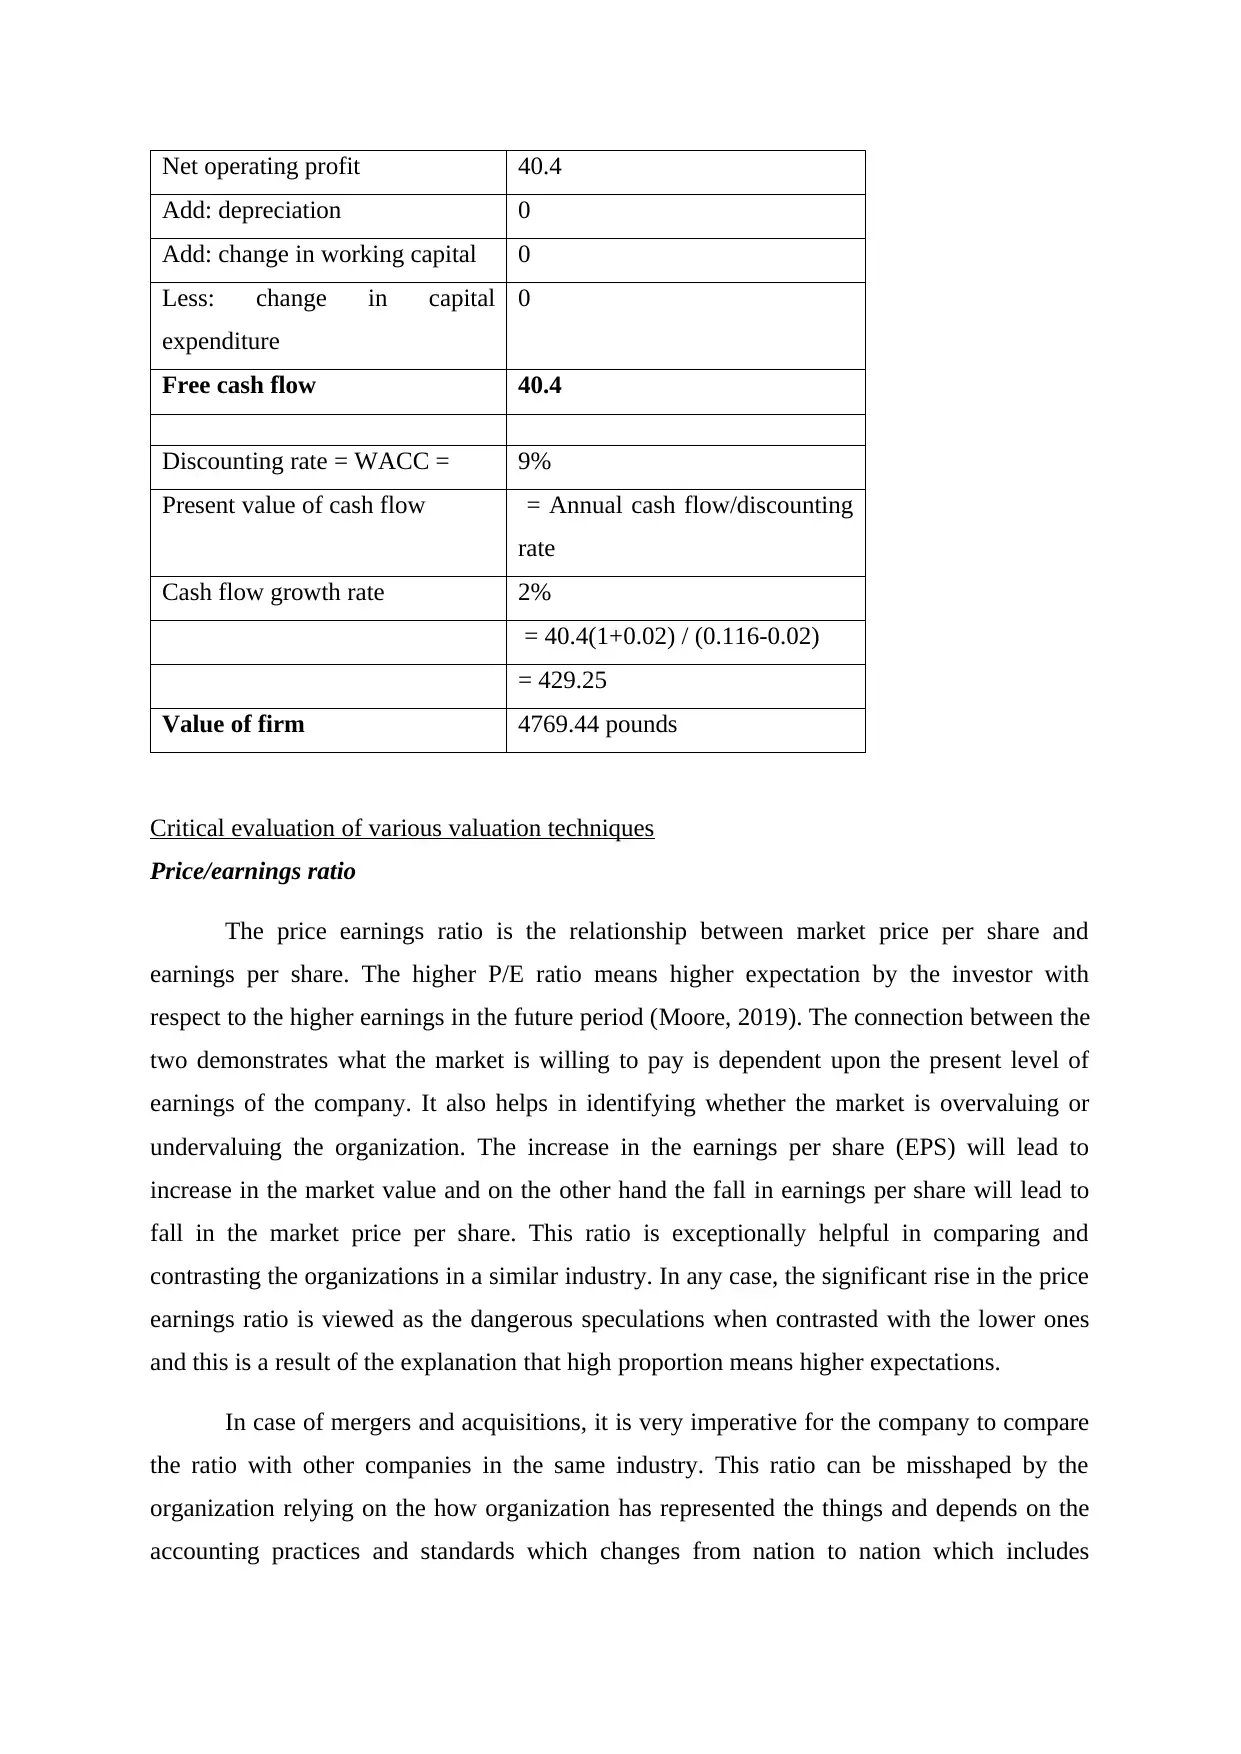
Net operating profit 40.4
Add: depreciation 0
Add: change in working capital 0
Less: change in capital
expenditure
0
Free cash flow 40.4
Discounting rate = WACC = 9%
Present value of cash flow = Annual cash flow/discounting
rate
Cash flow growth rate 2%
= 40.4(1+0.02) / (0.116-0.02)
= 429.25
Value of firm 4769.44 pounds
Critical evaluation of various valuation techniques
Price/earnings ratio
The price earnings ratio is the relationship between market price per share and
earnings per share. The higher P/E ratio means higher expectation by the investor with
respect to the higher earnings in the future period (Moore, 2019). The connection between the
two demonstrates what the market is willing to pay is dependent upon the present level of
earnings of the company. It also helps in identifying whether the market is overvaluing or
undervaluing the organization. The increase in the earnings per share (EPS) will lead to
increase in the market value and on the other hand the fall in earnings per share will lead to
fall in the market price per share. This ratio is exceptionally helpful in comparing and
contrasting the organizations in a similar industry. In any case, the significant rise in the price
earnings ratio is viewed as the dangerous speculations when contrasted with the lower ones
and this is a result of the explanation that high proportion means higher expectations.
In case of mergers and acquisitions, it is very imperative for the company to compare
the ratio with other companies in the same industry. This ratio can be misshaped by the
organization relying on the how organization has represented the things and depends on the
accounting practices and standards which changes from nation to nation which includes
Paraphrase This Document
Need a fresh take? Get an instant paraphrase of this document with our AI Paraphraser
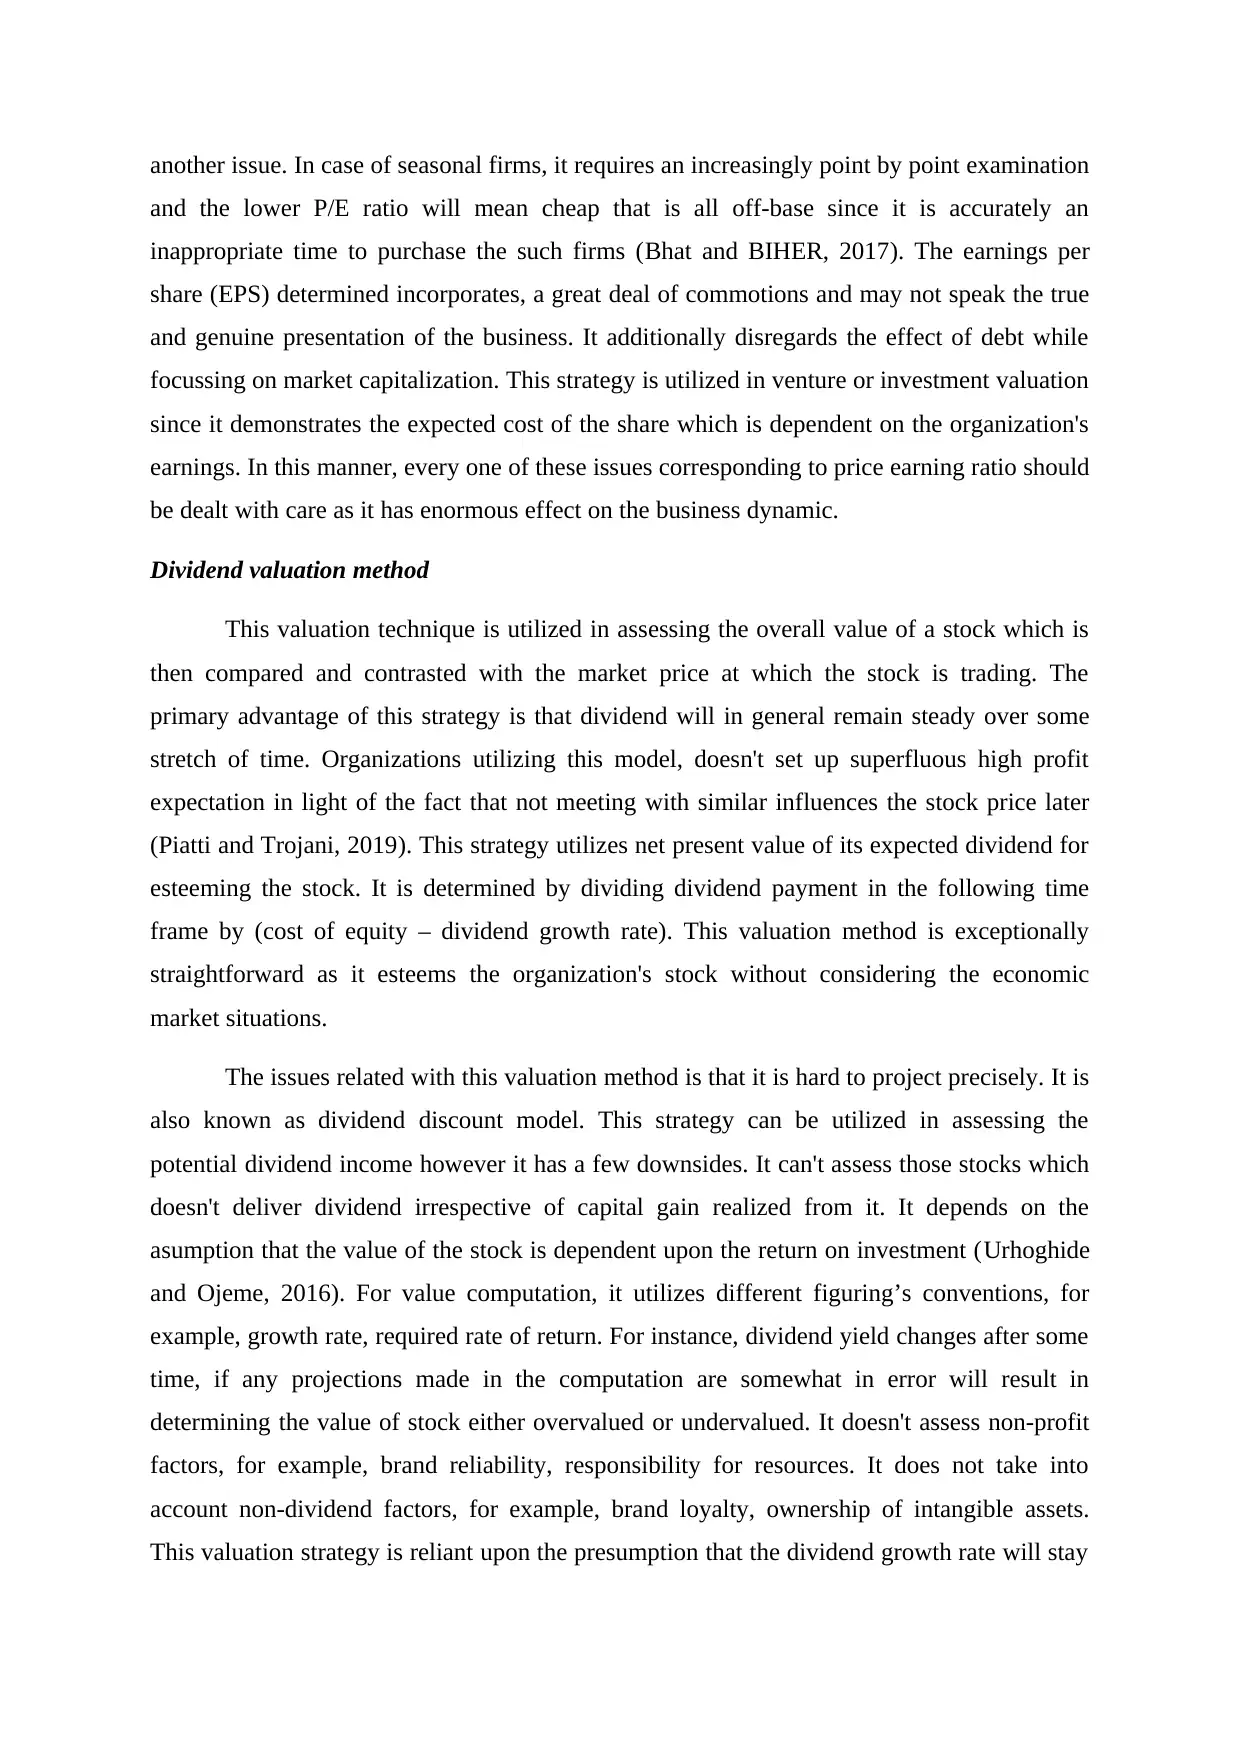
another issue. In case of seasonal firms, it requires an increasingly point by point examination
and the lower P/E ratio will mean cheap that is all off-base since it is accurately an
inappropriate time to purchase the such firms (Bhat and BIHER, 2017). The earnings per
share (EPS) determined incorporates, a great deal of commotions and may not speak the true
and genuine presentation of the business. It additionally disregards the effect of debt while
focussing on market capitalization. This strategy is utilized in venture or investment valuation
since it demonstrates the expected cost of the share which is dependent on the organization's
earnings. In this manner, every one of these issues corresponding to price earning ratio should
be dealt with care as it has enormous effect on the business dynamic.
Dividend valuation method
This valuation technique is utilized in assessing the overall value of a stock which is
then compared and contrasted with the market price at which the stock is trading. The
primary advantage of this strategy is that dividend will in general remain steady over some
stretch of time. Organizations utilizing this model, doesn't set up superfluous high profit
expectation in light of the fact that not meeting with similar influences the stock price later
(Piatti and Trojani, 2019). This strategy utilizes net present value of its expected dividend for
esteeming the stock. It is determined by dividing dividend payment in the following time
frame by (cost of equity – dividend growth rate). This valuation method is exceptionally
straightforward as it esteems the organization's stock without considering the economic
market situations.
The issues related with this valuation method is that it is hard to project precisely. It is
also known as dividend discount model. This strategy can be utilized in assessing the
potential dividend income however it has a few downsides. It can't assess those stocks which
doesn't deliver dividend irrespective of capital gain realized from it. It depends on the
asumption that the value of the stock is dependent upon the return on investment (Urhoghide
and Ojeme, 2016). For value computation, it utilizes different figuring’s conventions, for
example, growth rate, required rate of return. For instance, dividend yield changes after some
time, if any projections made in the computation are somewhat in error will result in
determining the value of stock either overvalued or undervalued. It doesn't assess non-profit
factors, for example, brand reliability, responsibility for resources. It does not take into
account non-dividend factors, for example, brand loyalty, ownership of intangible assets.
This valuation strategy is reliant upon the presumption that the dividend growth rate will stay
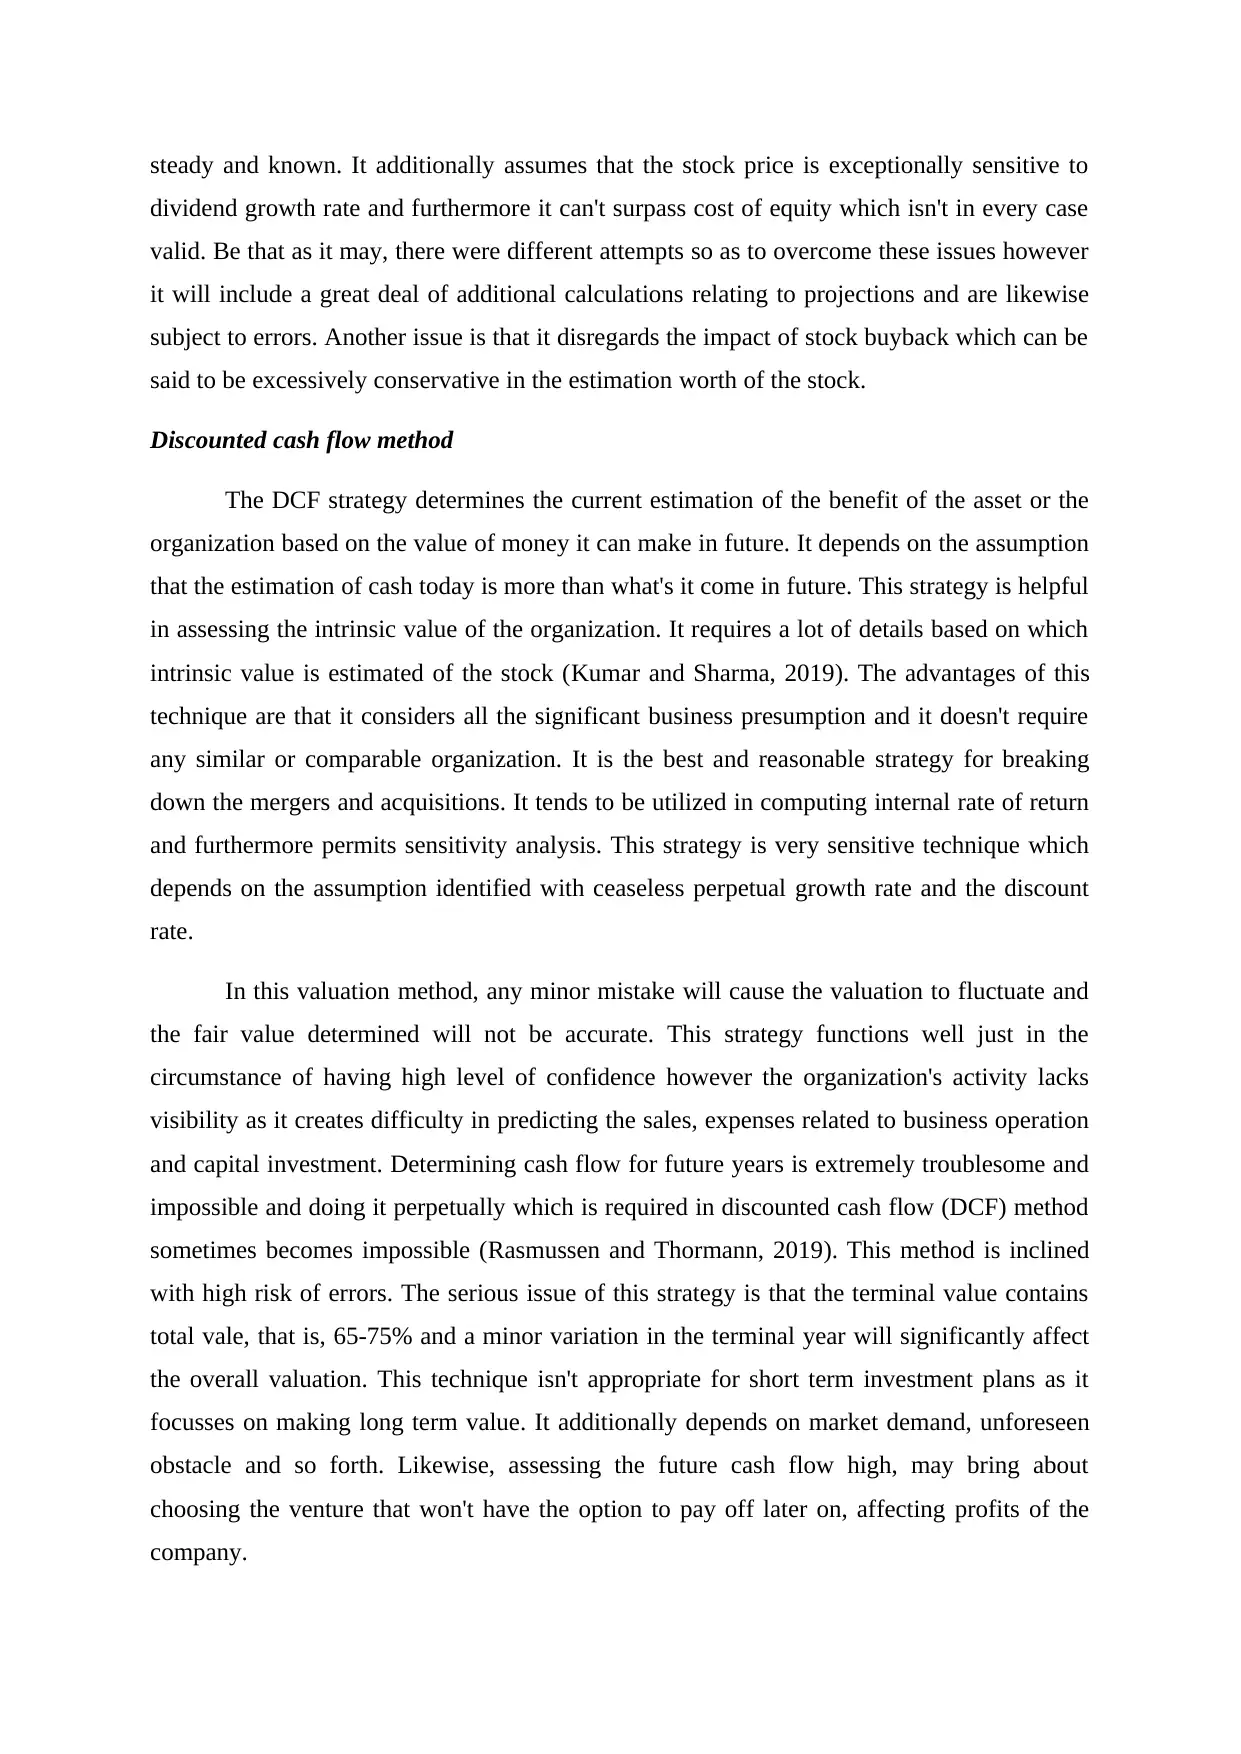
steady and known. It additionally assumes that the stock price is exceptionally sensitive to
dividend growth rate and furthermore it can't surpass cost of equity which isn't in every case
valid. Be that as it may, there were different attempts so as to overcome these issues however
it will include a great deal of additional calculations relating to projections and are likewise
subject to errors. Another issue is that it disregards the impact of stock buyback which can be
said to be excessively conservative in the estimation worth of the stock.
Discounted cash flow method
The DCF strategy determines the current estimation of the benefit of the asset or the
organization based on the value of money it can make in future. It depends on the assumption
that the estimation of cash today is more than what's it come in future. This strategy is helpful
in assessing the intrinsic value of the organization. It requires a lot of details based on which
intrinsic value is estimated of the stock (Kumar and Sharma, 2019). The advantages of this
technique are that it considers all the significant business presumption and it doesn't require
any similar or comparable organization. It is the best and reasonable strategy for breaking
down the mergers and acquisitions. It tends to be utilized in computing internal rate of return
and furthermore permits sensitivity analysis. This strategy is very sensitive technique which
depends on the assumption identified with ceaseless perpetual growth rate and the discount
rate.
In this valuation method, any minor mistake will cause the valuation to fluctuate and
the fair value determined will not be accurate. This strategy functions well just in the
circumstance of having high level of confidence however the organization's activity lacks
visibility as it creates difficulty in predicting the sales, expenses related to business operation
and capital investment. Determining cash flow for future years is extremely troublesome and
impossible and doing it perpetually which is required in discounted cash flow (DCF) method
sometimes becomes impossible (Rasmussen and Thormann, 2019). This method is inclined
with high risk of errors. The serious issue of this strategy is that the terminal value contains
total vale, that is, 65-75% and a minor variation in the terminal year will significantly affect
the overall valuation. This technique isn't appropriate for short term investment plans as it
focusses on making long term value. It additionally depends on market demand, unforeseen
obstacle and so forth. Likewise, assessing the future cash flow high, may bring about
choosing the venture that won't have the option to pay off later on, affecting profits of the
company.
⊘ This is a preview!⊘
Do you want full access?
Subscribe today to unlock all pages.
Trusted by 1+ million students worldwide
In this manner, from the above evaluation of different valuation techniques, it tends to
be said that discounting cash flow valuation method ought to be utilized by the organization.
Additionally, it ought to be utilized by financial experts with aptitude in the field as they are
extremely skilled in building financial models. It is the most appropriate strategy as it helps in
showing signs of improvement, better and exact outcomes. Alongside that legitimate
consideration and focus required in estimating and valuation on the grounds that even a minor
blunder will prompt wrong valuation which can influence the presentation and working of the
business.
QUESTION 3 – INVESTMENT APPRAISAL
1. Application of different investment appraisal techniques
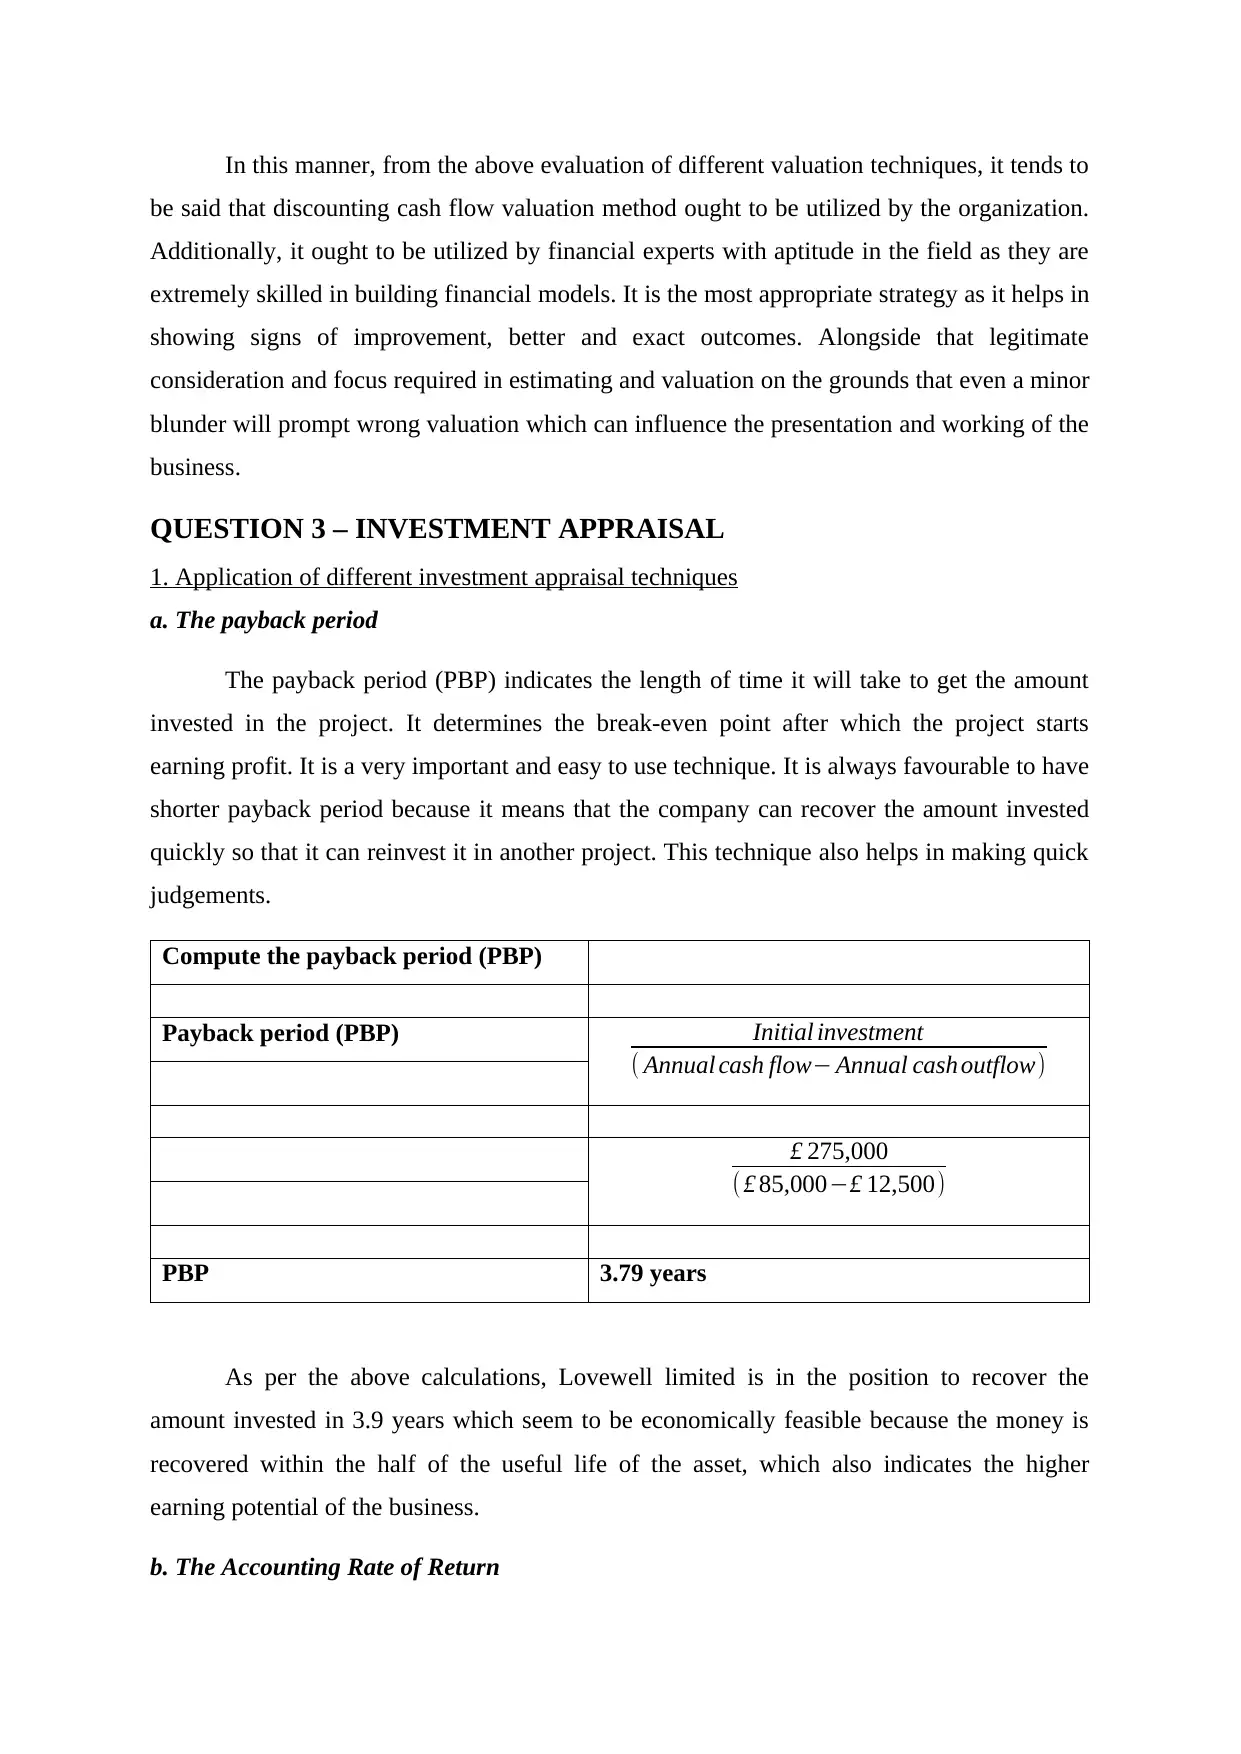
a. The payback period
The payback period (PBP) indicates the length of time it will take to get the amount
invested in the project. It determines the break-even point after which the project starts
earning profit. It is a very important and easy to use technique. It is always favourable to have
shorter payback period because it means that the company can recover the amount invested
quickly so that it can reinvest it in another project. This technique also helps in making quick
judgements.
Compute the payback period (PBP)
Payback period (PBP)
PBP 3.79 years
As per the above calculations, Lovewell limited is in the position to recover the
amount invested in 3.9 years which seem to be economically feasible because the money is
recovered within the half of the useful life of the asset, which also indicates the higher
earning potential of the business.
b. The Accounting Rate of Return
£ 275,000
( £ 85,000−£ 12,500)
Initial investment
( Annual cash flow− Annual cash outflow)
be said that discounting cash flow valuation method ought to be utilized by the organization.
Additionally, it ought to be utilized by financial experts with aptitude in the field as they are
extremely skilled in building financial models. It is the most appropriate strategy as it helps in
showing signs of improvement, better and exact outcomes. Alongside that legitimate
consideration and focus required in estimating and valuation on the grounds that even a minor
blunder will prompt wrong valuation which can influence the presentation and working of the
business.
QUESTION 3 – INVESTMENT APPRAISAL
1. Application of different investment appraisal techniques
a. The payback period
The payback period (PBP) indicates the length of time it will take to get the amount
invested in the project. It determines the break-even point after which the project starts
earning profit. It is a very important and easy to use technique. It is always favourable to have
shorter payback period because it means that the company can recover the amount invested
quickly so that it can reinvest it in another project. This technique also helps in making quick
judgements.
Compute the payback period (PBP)
Payback period (PBP)
PBP 3.79 years
As per the above calculations, Lovewell limited is in the position to recover the
amount invested in 3.9 years which seem to be economically feasible because the money is
recovered within the half of the useful life of the asset, which also indicates the higher
earning potential of the business.
b. The Accounting Rate of Return
£ 275,000
( £ 85,000−£ 12,500)
Initial investment
( Annual cash flow− Annual cash outflow)
Paraphrase This Document
Need a fresh take? Get an instant paraphrase of this document with our AI Paraphraser
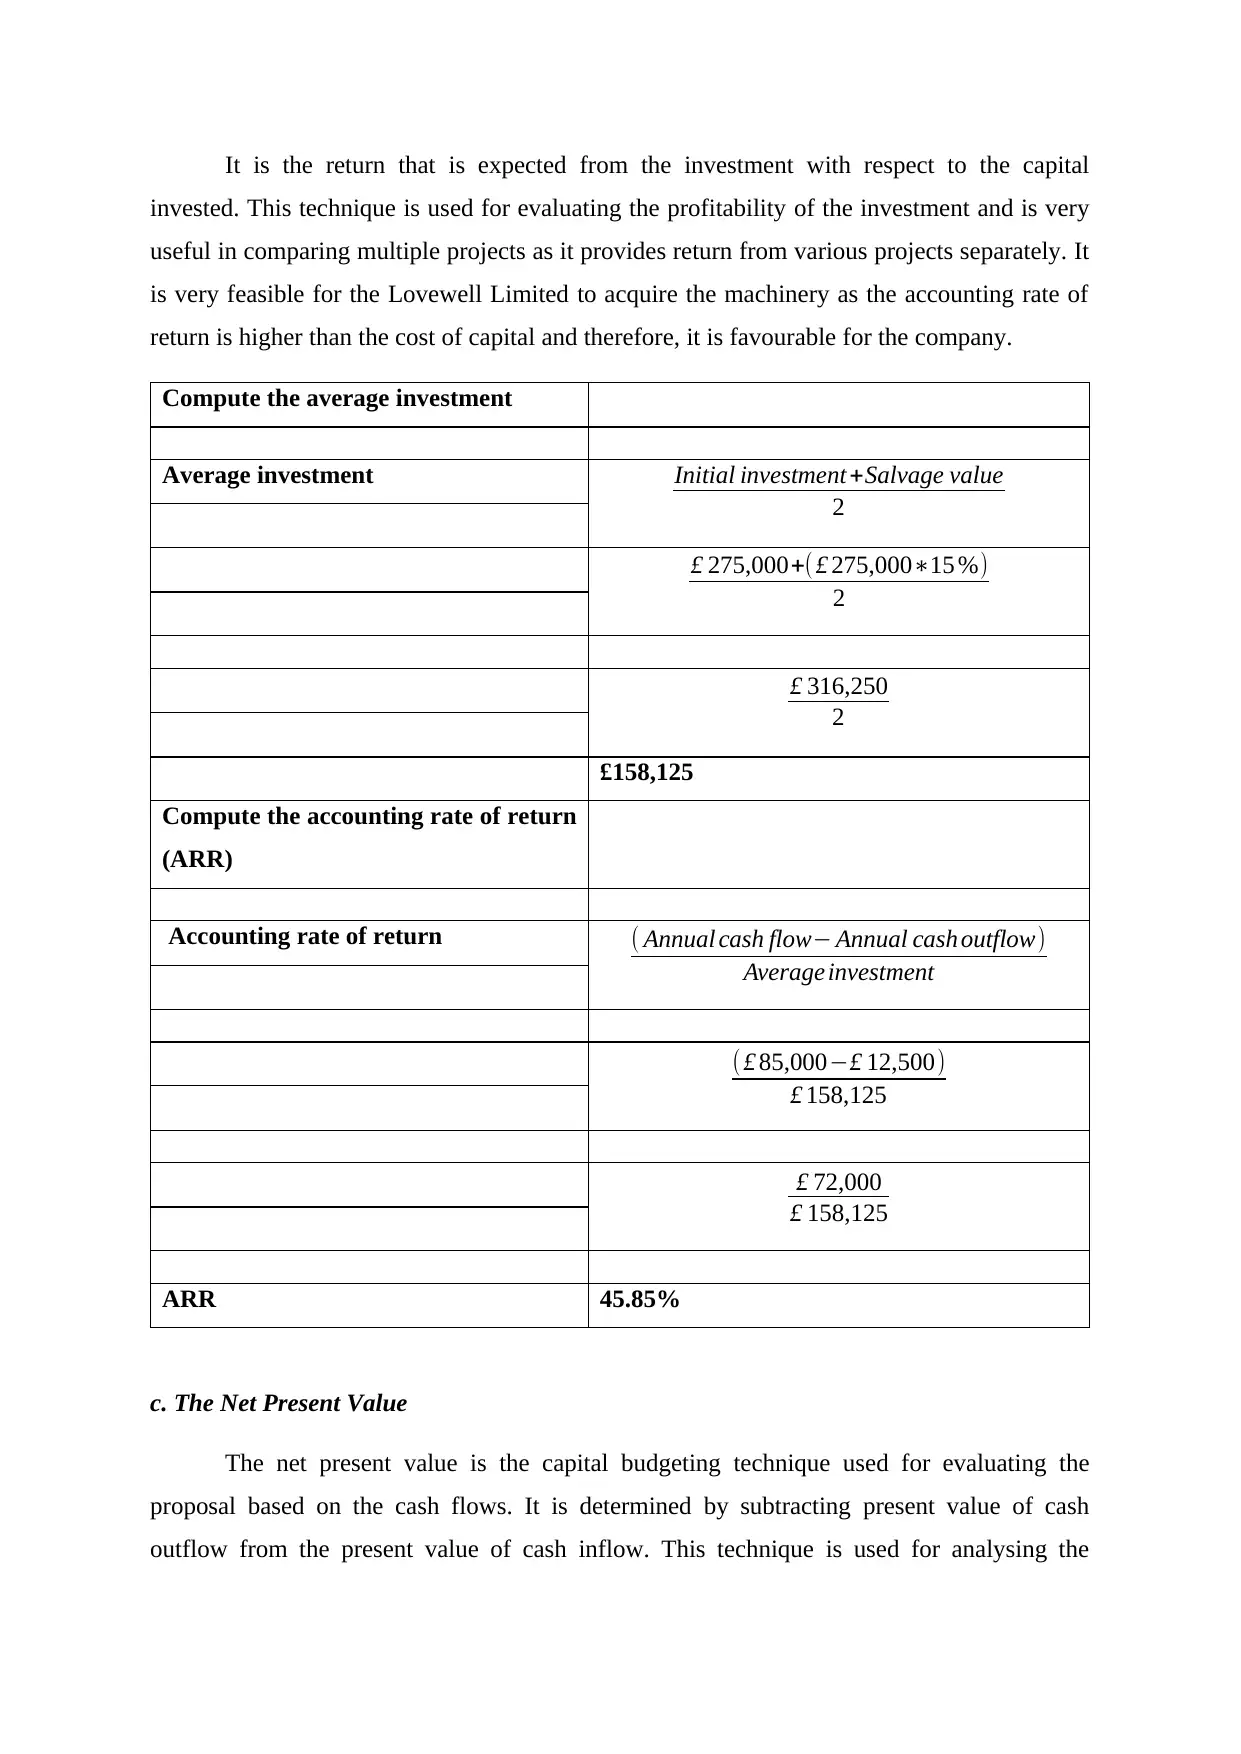
It is the return that is expected from the investment with respect to the capital
invested. This technique is used for evaluating the profitability of the investment and is very
useful in comparing multiple projects as it provides return from various projects separately. It
is very feasible for the Lovewell Limited to acquire the machinery as the accounting rate of
return is higher than the cost of capital and therefore, it is favourable for the company.
Compute the average investment
Average investment
£158,125
Compute the accounting rate of return
(ARR)
Accounting rate of return
ARR 45.85%
c. The Net Present Value
The net present value is the capital budgeting technique used for evaluating the
proposal based on the cash flows. It is determined by subtracting present value of cash
outflow from the present value of cash inflow. This technique is used for analysing the
Initial investment +Salvage value
2
£ 275,000+( £ 275,000∗15 %)
2
£ 316,250
2
( Annual cash flow− Annual cash outflow)
Average investment
( £ 85,000−£ 12,500)
£ 158,125
£ 72,000
£ 158,125
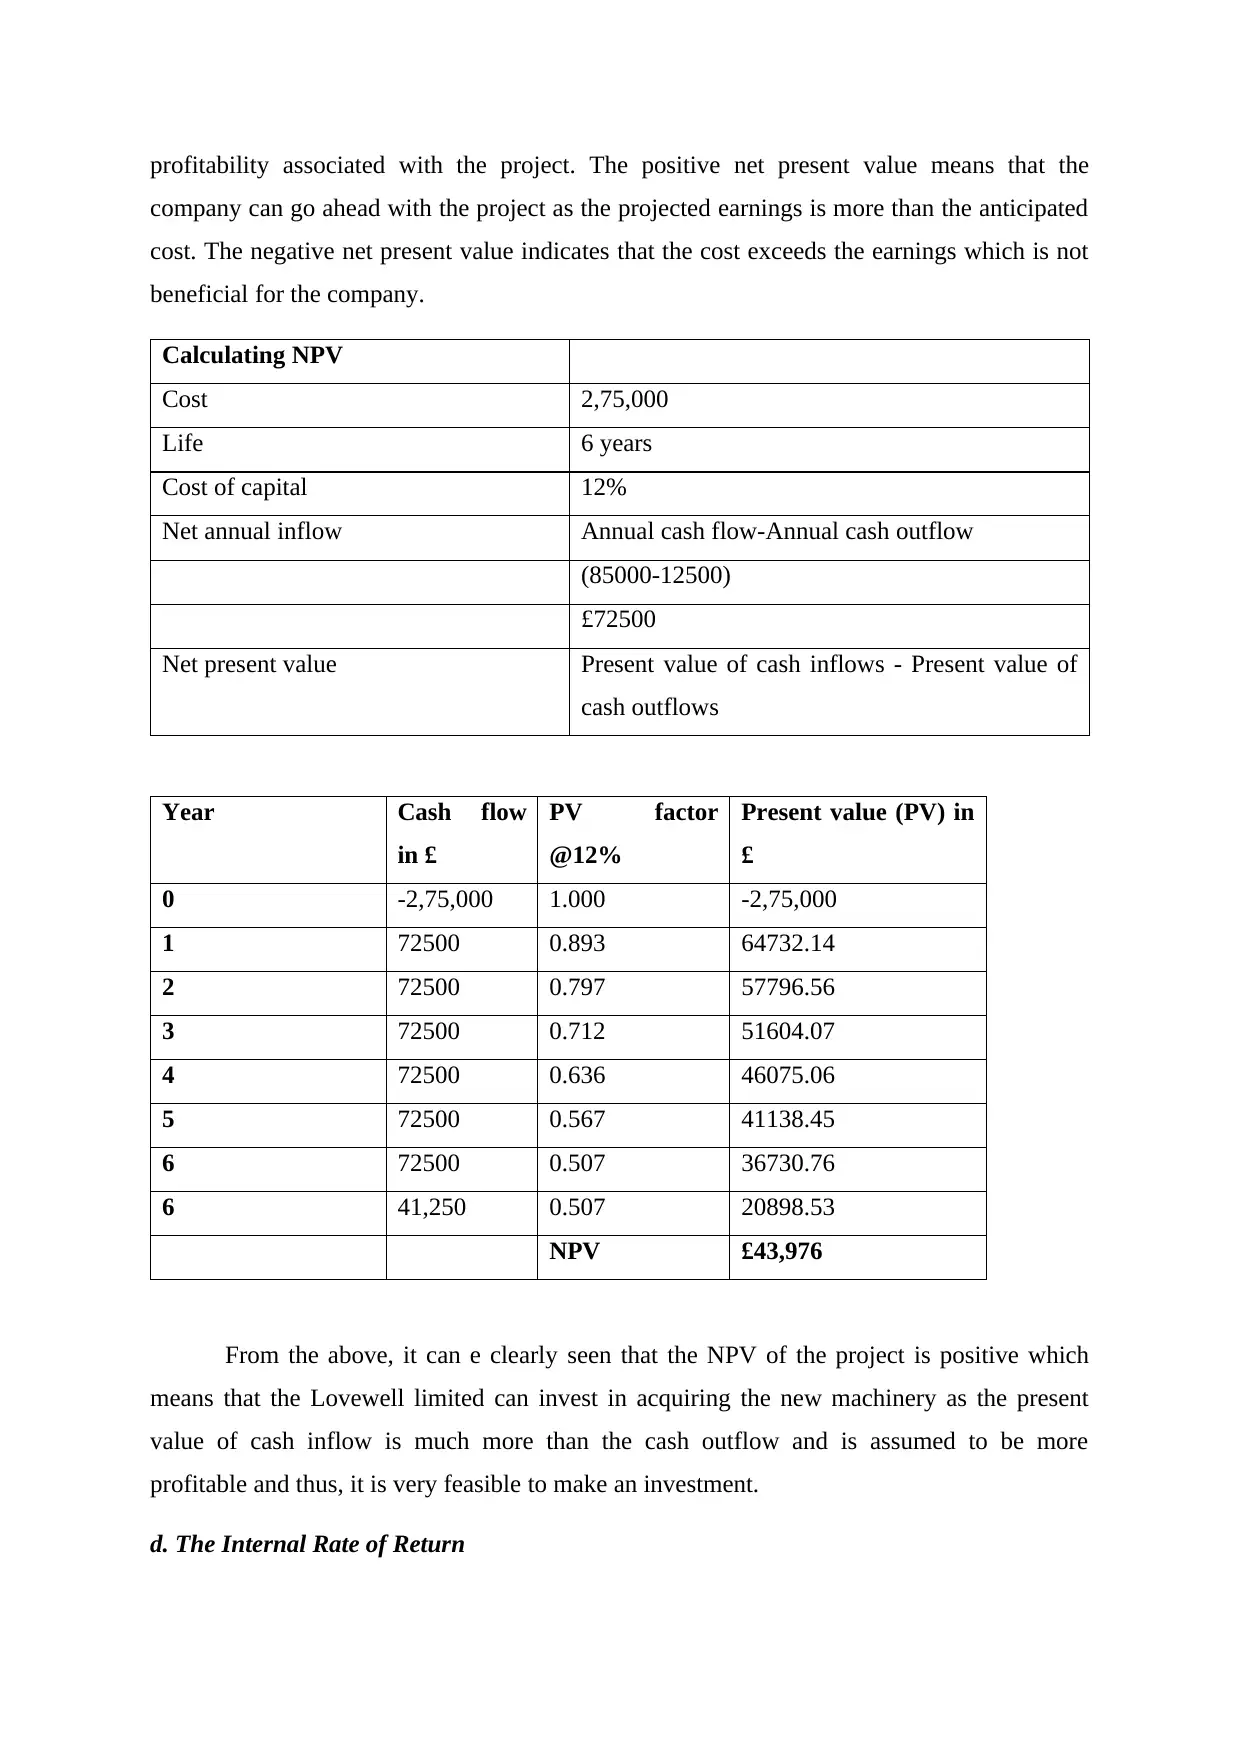
profitability associated with the project. The positive net present value means that the
company can go ahead with the project as the projected earnings is more than the anticipated
cost. The negative net present value indicates that the cost exceeds the earnings which is not
beneficial for the company.
Calculating NPV
Cost 2,75,000
Life 6 years
Cost of capital 12%
Net annual inflow Annual cash flow-Annual cash outflow
(85000-12500)
£72500
Net present value Present value of cash inflows - Present value of
cash outflows
Year Cash flow
in £
PV factor
@12%
Present value (PV) in
£
0 -2,75,000 1.000 -2,75,000
1 72500 0.893 64732.14
2 72500 0.797 57796.56
3 72500 0.712 51604.07
4 72500 0.636 46075.06
5 72500 0.567 41138.45
6 72500 0.507 36730.76
6 41,250 0.507 20898.53
NPV £43,976
From the above, it can e clearly seen that the NPV of the project is positive which
means that the Lovewell limited can invest in acquiring the new machinery as the present
value of cash inflow is much more than the cash outflow and is assumed to be more
profitable and thus, it is very feasible to make an investment.
d. The Internal Rate of Return
⊘ This is a preview!⊘
Do you want full access?
Subscribe today to unlock all pages.
Trusted by 1+ million students worldwide
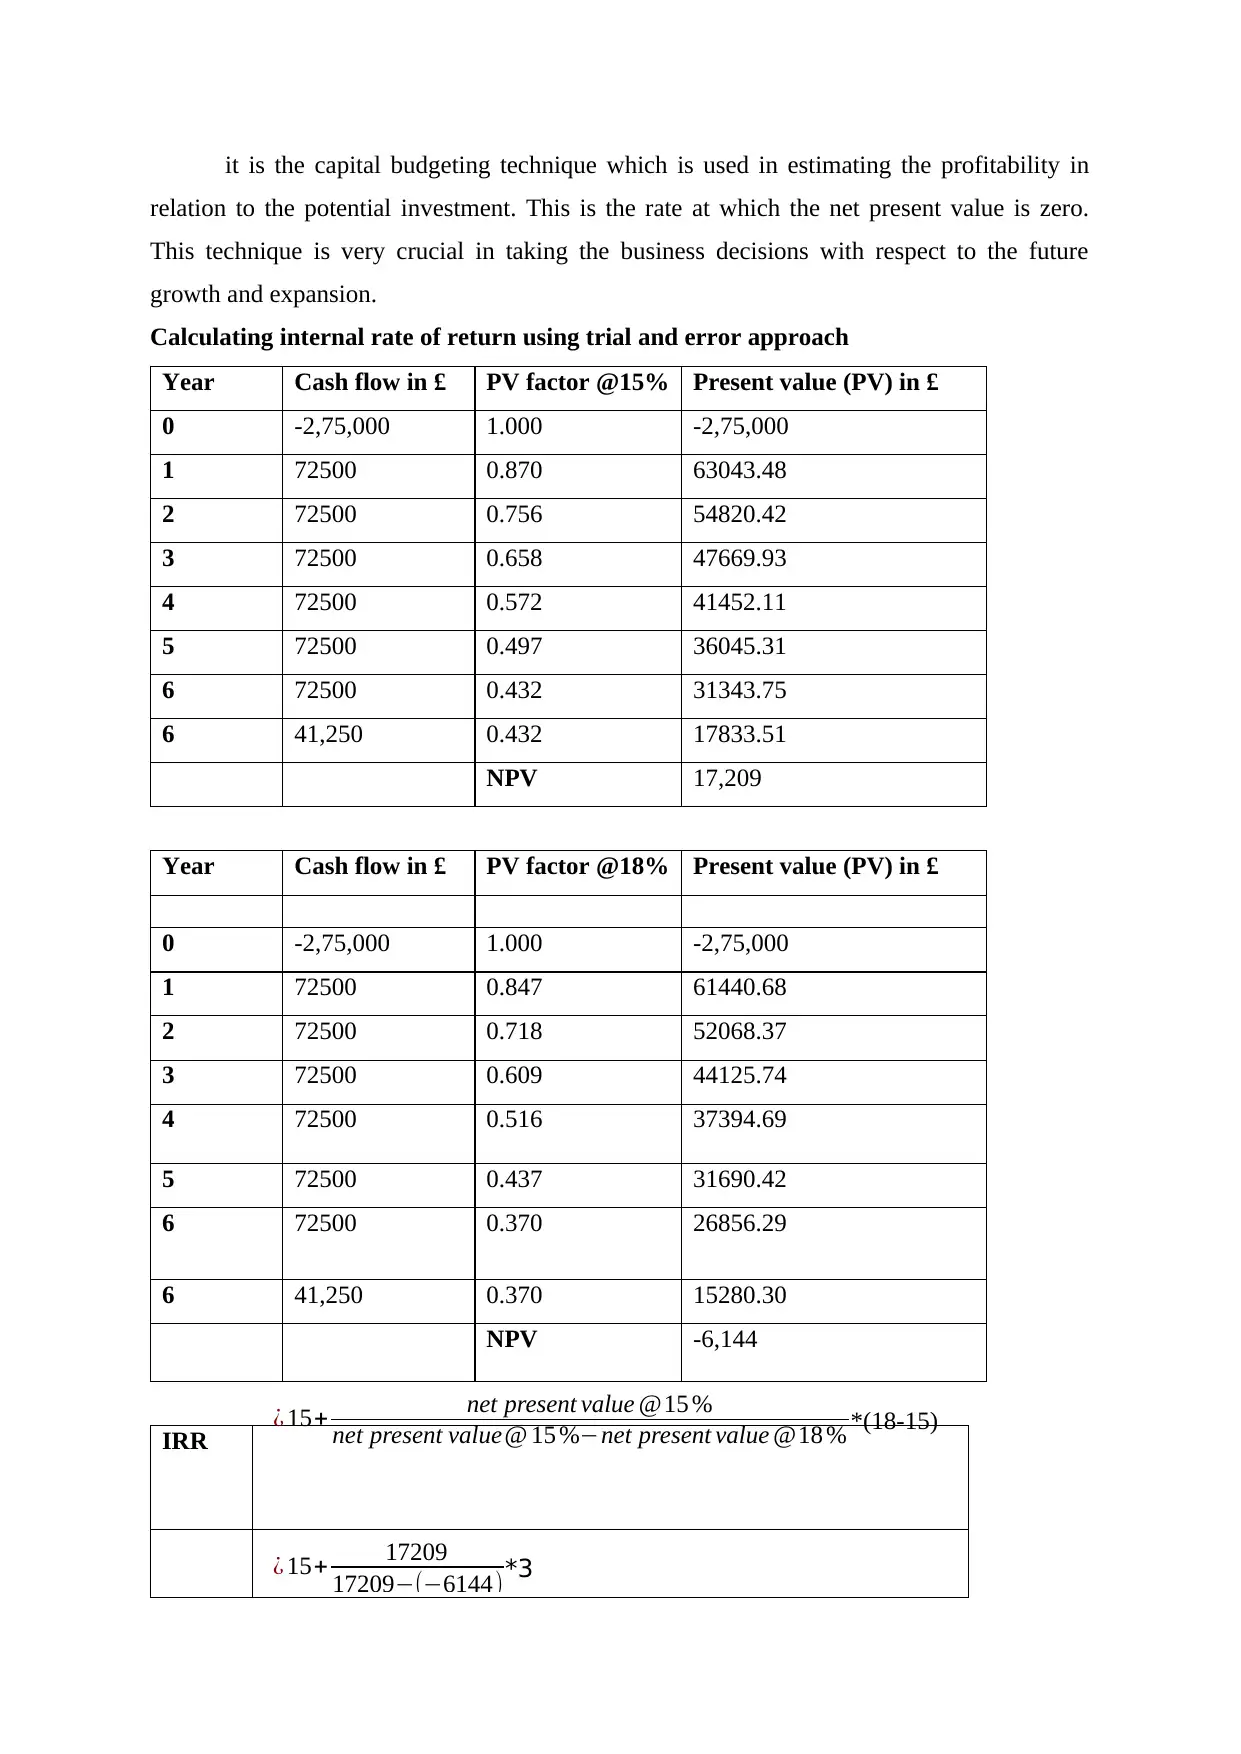
it is the capital budgeting technique which is used in estimating the profitability in
relation to the potential investment. This is the rate at which the net present value is zero.
This technique is very crucial in taking the business decisions with respect to the future
growth and expansion.
Calculating internal rate of return using trial and error approach
Year Cash flow in £ PV factor @15% Present value (PV) in £
0 -2,75,000 1.000 -2,75,000
1 72500 0.870 63043.48
2 72500 0.756 54820.42
3 72500 0.658 47669.93
4 72500 0.572 41452.11
5 72500 0.497 36045.31
6 72500 0.432 31343.75
6 41,250 0.432 17833.51
NPV 17,209
Year Cash flow in £ PV factor @18% Present value (PV) in £
0 -2,75,000 1.000 -2,75,000
1 72500 0.847 61440.68
2 72500 0.718 52068.37
3 72500 0.609 44125.74
4 72500 0.516 37394.69
5 72500 0.437 31690.42
6 72500 0.370 26856.29
6 41,250 0.370 15280.30
NPV -6,144
IRR ¿ 15+ net present value @15 %
net present value@ 15 %−net present value @18 % *(18-15)
¿ 15+ 17209
17209−(−6144)*3
Paraphrase This Document
Need a fresh take? Get an instant paraphrase of this document with our AI Paraphraser
17.18%
The above computation states that the Lovewell limited should invest in acquiring the
machinery as the internal rate of return is 17.18% more than the 12% rate of cost of capital.
This seems to very profitable to the company for its future growth and expansion.
2. Benefits and limitations of different investment appraisal techniques
The Payback Period
It is the measure of time takes to create the money inflow from the capital invested. It
identifies the break even point at which the initial investment is recovered from the earnings.
It is determined by initial investment by cash flow generated. The significant favourable point
of this technique is that it is very easy to calculate and understand and gives data on risk
related with the venture. It is a very useful tool utilized in estimating the liquidity (Krulický
and Horák, 2019). Be that as it may, then again, this technique doesn't contemplate time
estimation of cash and furthermore it is increasingly more concerned about the liquidity and
not profitability of the investment. It doesn't consider the cash flow outside the payback time
frame which may prompt or lead to inaccurate and misleading information ((Bril, Kalinina
and Ilin, 2017)). Another disadvantage is that it leans towards shorter payback period (PBP)
without considering the overall life of the project. This method cannot make differentiation
between the undertakings having same payback period. Another significant point is, it doesn't
take into account the scrap value of the asset at the end of the project.
The Accounting Rate of Return
It is the expected return on the venture which is represented in percentage. It is
determined by dividing yearly annual profit by the average investment. Higher the accounting
rate of return, it is well on the way to be productive. ARR is easy to use but difficult to
utilize. It considers net operating income which is used by investors for assessing the
performance of the company (Kengatharan, 2017). However, this strategy doesn't represent
time value of money and focusses on net operating income as opposed to money inflow and
furthermore it doesn't stay consistent over the life of the undertaking which makes the project
attractive at one time and bothersome at another point. This method cannot be used in
comparing and contrasting multiple projects with distinctive life expectancy (Asogwa and
Onyekwelu, 2019). The timings and the patterns of money inflow is totally overlooked and
¿ 15+ 17209
23353 *3
doesn't for uncertainty and inflation. It additionally doesn't represent wealth and performance.
On account of which it is generally utilized in short term projects, consequently, it ought to
be utilized cautiously.
The Net Present Value
This technique is the most widely used discounting method. It is essentially the
estimation of future cash inflows over the life of the undertaking or investment which is
discounted to the present. It helps in assessing the value of the investment in regard to cash
flow and profitability. This technique considers the time value of money in regard to all the
cash flows over the life of the project and furthermore represents the timings and patterns of
the earnings (Häcker and Ernst, 2017). It measures the net worth of the firm which may result
as for the adjustments in association with the investment. Not at all like, IRR it doesn't expect
that the cash flows will be reinvested at IRR. This technique helps in recognizing whether the
specific project is having the ability to produce enough cash flow that will surpass the
expense of the project. The positive net present value (NPV) means that the project can be
undertaken and negative NPV means it can't to be attempted or not profitable to the business.
This technique is valuable in the event of picking just one project from the various by
estimating the profitability of each undertaking and afterward choosing the highly beneficial
investment.
Apart from the benefits associated with this technique, there are certain
disadvantages. Computing NPV is a little difficult procedure and also identifying the right
discounting rate is very significant for ascertaining present value (Saputra and et.al , 2018).
Accordingly, cost of capital represents different elements which helps in ensuring greatest
objectivity. It considers economic market conditions and risk. In situations like mutually
exclusive projects, NPV may give misleading results. There is no set rule for ascertaining
NPV and it is left at the discretion of organization to select discounting rate which may lead
to unexpected return. Short term projects with high NPV may not help increasing the earning
per share and return on equity and probably won't work in the favour of the organization's
investors.
The Internal Rate of Return
IRR is the discounted rate at which NPV is equivalent to zero. It is utilized to measure
and analyse the growth rate of different projects and plans and this technique is the measure
used to choose which undertaking yield more significant returns in comparison to others. IRR
⊘ This is a preview!⊘
Do you want full access?
Subscribe today to unlock all pages.
Trusted by 1+ million students worldwide
1 out of 14
Related Documents


Your All-in-One AI-Powered Toolkit for Academic Success.
+13062052269
info@desklib.com
Available 24*7 on WhatsApp / Email
![[object Object]](/_next/static/media/star-bottom.7253800d.svg)
Unlock your academic potential
Copyright © 2020–2026 A2Z Services. All Rights Reserved. Developed and managed by ZUCOL.