International Financial Management Report and Financial Analysis
VerifiedAdded on 2023/01/07
|10
|2232
|56
Report
AI Summary
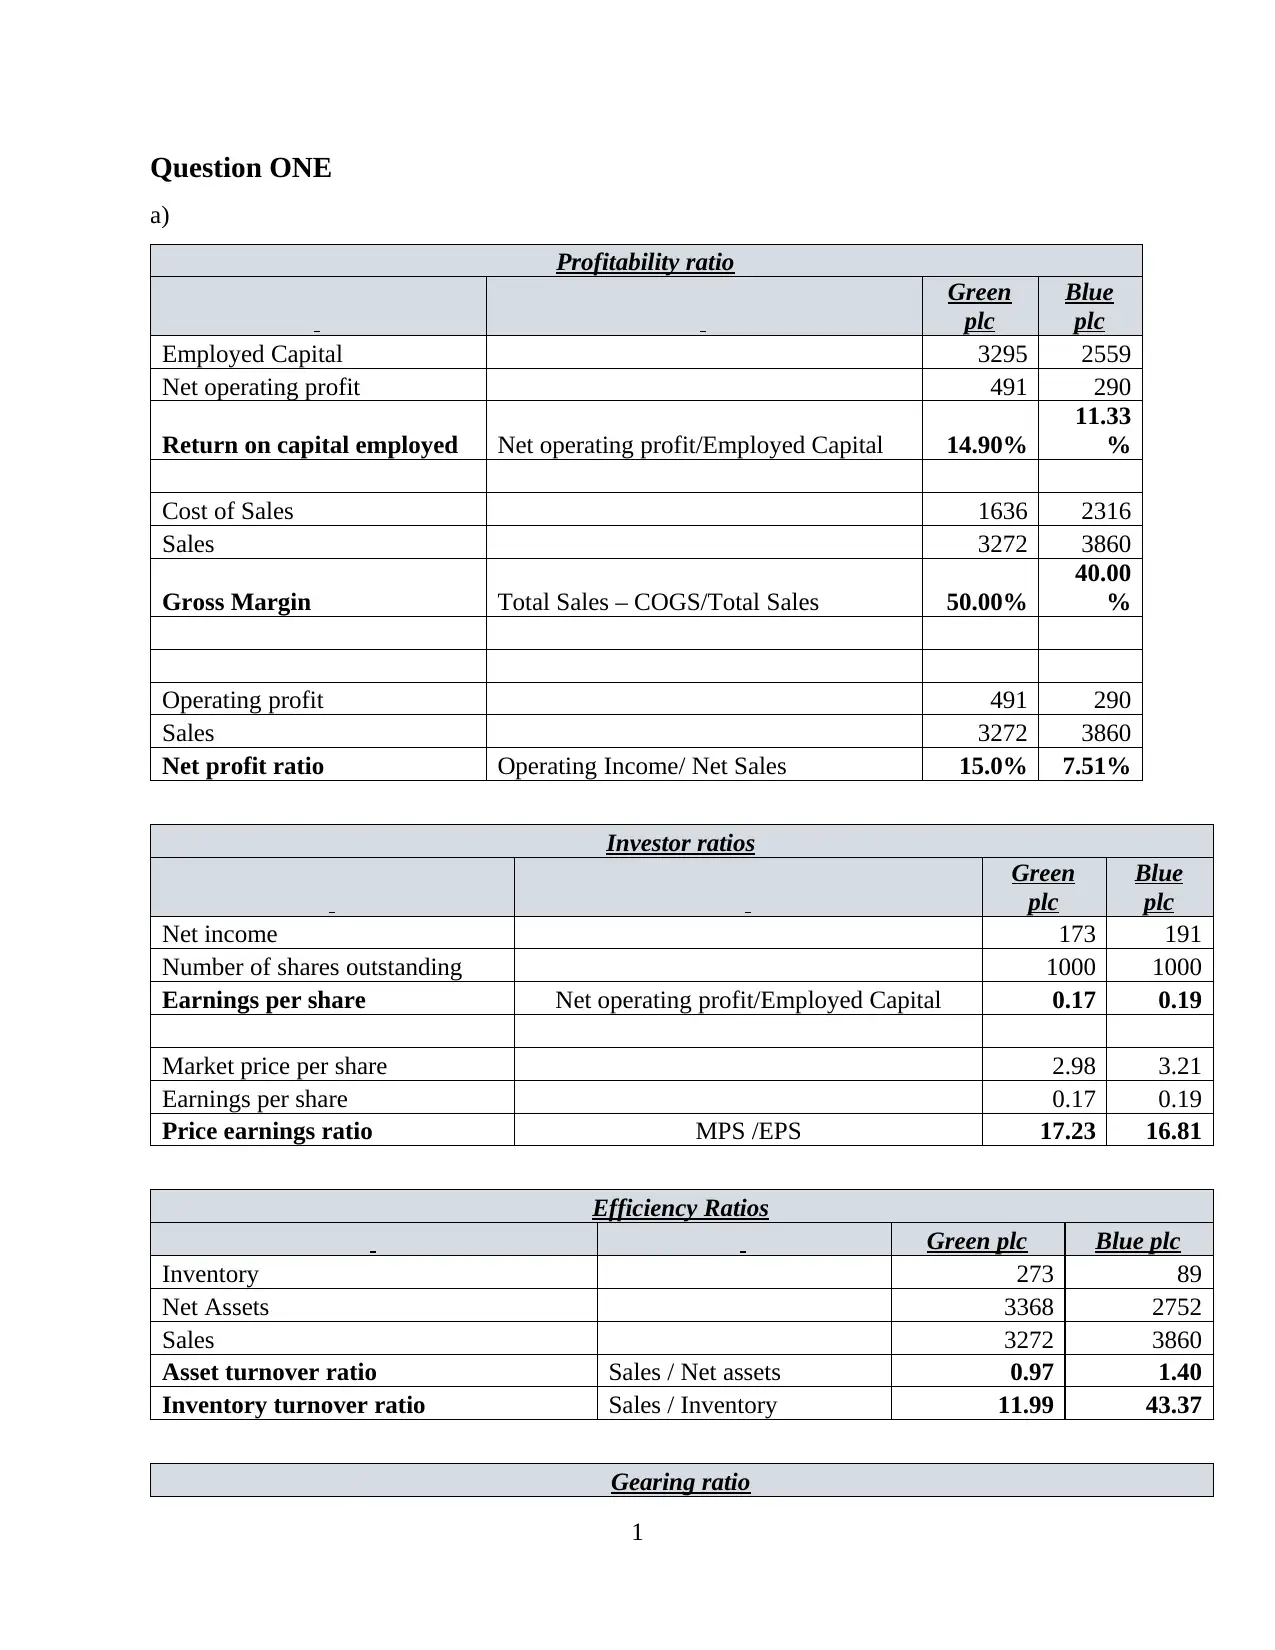
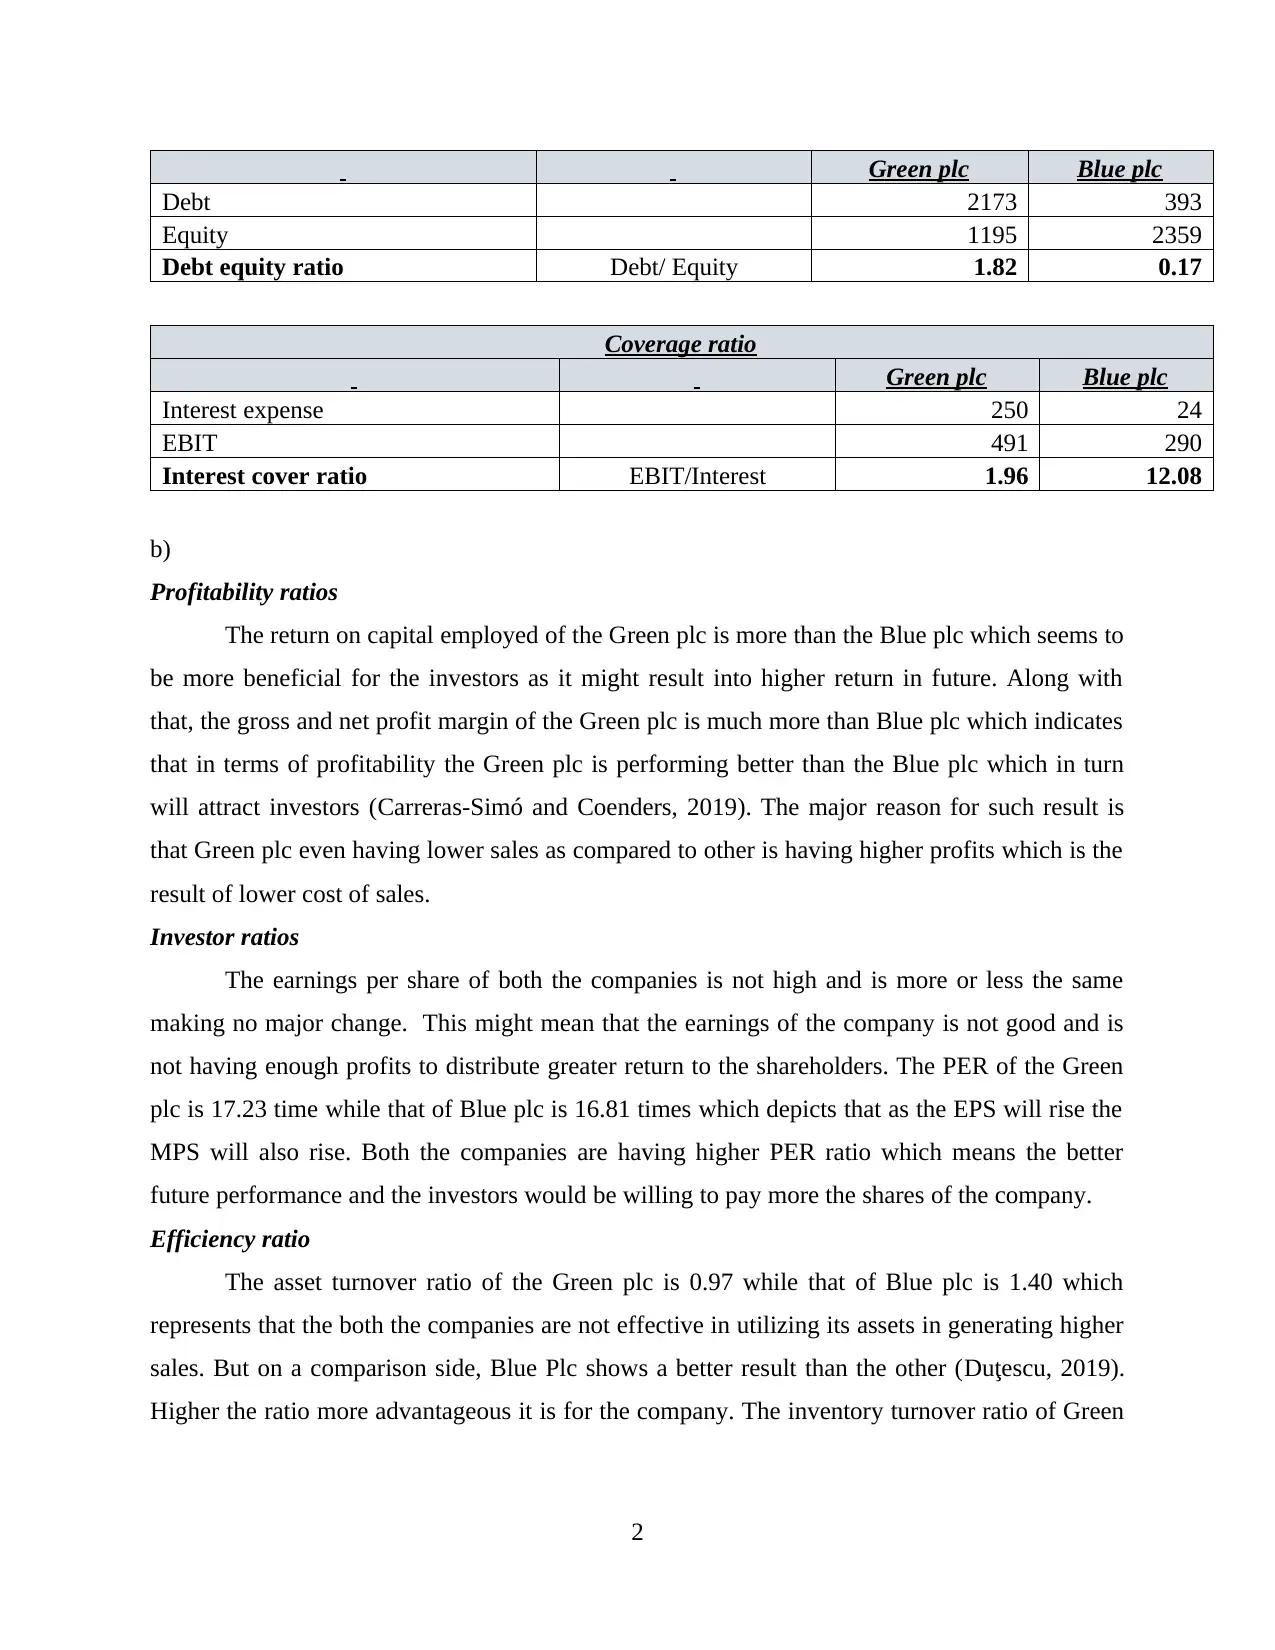
This report provides a comprehensive analysis of international financial management, encompassing three key questions. Question one delves into the profitability, investor, efficiency, and gearing ratios of two hypothetical companies, Green plc and Blue plc, comparing their financial performance. The analysis includes an assessment of the limitations of ratio analysis, such as its reliance on historical data and the potential impact of accounting practices. Question two focuses on calculating the Weighted Average Cost of Capital (WACC) for Art Co., using both book value and market value methods. The report explains the differences in WACC calculation based on these two methods and discusses the implications of WACC in investment decisions. Question three addresses the objectives of working capital management, emphasizing the trade-off between profitability and liquidity. It explores the conservative and aggressive approaches to working capital management and highlights the importance of effective working capital management for financial stability and investor returns. The report concludes with a list of cited references.
Contribute Materials
Your contribution can guide someone’s learning journey. Share your
documents today.

INTERNATIONAL FINANCIAL
MANAGMENT
MANAGMENT
Secure Best Marks with AI Grader
Need help grading? Try our AI Grader for instant feedback on your assignments.

TABLE OF CONTENTS
Question ONE..................................................................................................................................1
Question TWO.................................................................................................................................3
Question THREE.............................................................................................................................6
REFERENCES................................................................................................................................8

Question ONE
a)
Profitability ratio
Green
plc
Blue
plc
Employed Capital 3295 2559
Net operating profit 491 290
Return on capital employed Net operating profit/Employed Capital 14.90%
11.33
%
Cost of Sales 1636 2316
Sales 3272 3860
Gross Margin Total Sales – COGS/Total Sales 50.00%
40.00
%
Operating profit 491 290
Sales 3272 3860
Net profit ratio Operating Income/ Net Sales 15.0% 7.51%
Investor ratios
Green
plc
Blue
plc
Net income 173 191
Number of shares outstanding 1000 1000
Earnings per share Net operating profit/Employed Capital 0.17 0.19
Market price per share 2.98 3.21
Earnings per share 0.17 0.19
Price earnings ratio MPS /EPS 17.23 16.81
Efficiency Ratios
Green plc Blue plc
Inventory 273 89
Net Assets 3368 2752
Sales 3272 3860
Asset turnover ratio Sales / Net assets 0.97 1.40
Inventory turnover ratio Sales / Inventory 11.99 43.37
Gearing ratio
1

Green plc Blue plc
Debt 2173 393
Equity 1195 2359
Debt equity ratio Debt/ Equity 1.82 0.17
Coverage ratio
Green plc Blue plc
Interest expense 250 24
EBIT 491 290
Interest cover ratio EBIT/Interest 1.96 12.08
b)
Profitability ratios
The return on capital employed of the Green plc is more than the Blue plc which seems to
be more beneficial for the investors as it might result into higher return in future. Along with
that, the gross and net profit margin of the Green plc is much more than Blue plc which indicates
that in terms of profitability the Green plc is performing better than the Blue plc which in turn
will attract investors (Carreras-Simó and Coenders, 2019). The major reason for such result is
that Green plc even having lower sales as compared to other is having higher profits which is the
result of lower cost of sales.
Investor ratios
The earnings per share of both the companies is not high and is more or less the same
making no major change. This might mean that the earnings of the company is not good and is
not having enough profits to distribute greater return to the shareholders. The PER of the Green
plc is 17.23 time while that of Blue plc is 16.81 times which depicts that as the EPS will rise the
MPS will also rise. Both the companies are having higher PER ratio which means the better
future performance and the investors would be willing to pay more the shares of the company.
Efficiency ratio
The asset turnover ratio of the Green plc is 0.97 while that of Blue plc is 1.40 which
represents that the both the companies are not effective in utilizing its assets in generating higher
sales. But on a comparison side, Blue Plc shows a better result than the other (Duţescu, 2019).
Higher the ratio more advantageous it is for the company. The inventory turnover ratio of Green
2
Secure Best Marks with AI Grader
Need help grading? Try our AI Grader for instant feedback on your assignments.

plc is lower than the Blue plc which means that the blue plc is more efficient in selling out its
stock more quickly. Therefore, in terms of efficiency, the Blue plc is performing sound.
Gearing ratio
This ratio states about the inclusion debt in the capital structure of the company. The debt
equity ratio of Green plc is 1.82 which is greater than the Blue plc of 0.17 which demonstrate
that the Green plc is having higher risk of financial burden as compared to the other and for
paying it back it requires to undertake additional funds. Thus, Blue plc is having lower risk.
Interest cover ratio
The interest coverage ratio states about the ability of the company in paying its interest
obligations from its earnings. The Blue plc is having higher ratio and shows its ability to easily
meeting up with the financial burden as compared to the other.
Based on the above analysis, it can be said that it is better to investment in Blue plc even
though it is low profitability but has the ability to effectively and efficiently meet with its
obligation which reduces the risk of investor which is not in the case of Green plc.
c)
The major limitation in the above analysis is that it is based on the historical information and
overlooks the price level changes with respect to inflation. This does not highlight the true
financial situation of the company. There are no set standards with regard to the formula to be
used for computing the ratios and the figures may vary with the application of different practices
(Das and Pandit, 2020). In case, there is a change in the accounting practice and policies being
followed by the company, it might cause alteration in the financial ratios computed. Also, if the
company changes its operational structure, then the comparison of the metrics before and after
the change might give misleading information about the organization’s performance.
Question TWO
a) Calculation of the Weighted Average Cost of Capital and Book value weighted average cost
of capital of Art Co.
Calculation of costs
Cost of Equity
Face Value 0.5
3

Market Price 5.85
Beta 1.15
Risk free return 4%
Equity Risk premium 6%
Corporation tax 25%
Cost of Equity
Rf +(Rm -
Rf)*Beta
4% + (6% * 1.15)
10.9%
Cost of Debt
Nominal Value 100
Current Marker price 103.5
Interest on loan 6%
Redemption after 6 years 6%
Corporation tax 25%
Cost of debt Coupon rate *(1-tax rate)
6%*(1-25%)
4.5%
Computation of the weights of capital
Weights of capital BV weights MV weights
Equity Capital 200 (400*5.85) 2340
Debt 200 (2*103.5) 207
Total Capital 400 2547
Weight of equity 0.5 0.92
Weight of Debt 0.5 0.08
Computation of the WACC under Book value and Market value method
4

Book Value WACC
Type of Capital Amount % of total Cost pre
tax
Cost after
tax
Weighted
Cost
Equity Value 200 50% 10.9% 10.9% 5.5%
Seller's note 200 50% 6% 4.5% 2.3%
WACC 7.7%
Market Value WACC
Type of Capital Amount % of total Cost pre
tax
Cost after
tax
Weighted
Cost
Equity Value
(400*5.85)
2340 92% 10.9% 10.9% 10.0%
Seller's note
(2*103.5)
207 8% 6.0% 4.5% 0.4%
WACC 10.4%
From the above calculation it is analysed that the costs of capital under book value and
under market value are different. Difference between cost of capital under is seen because of the
weights as value under books and in market of the equity and debt are different. Book value cost
of capital of the company 7.7% where cost of capital under market weights is 10.4%. Book value
weights are used by the internal management of the company for framing policies and strategies
for having an optimum capital structure. On the other market value weights are used by the
external investors for assessing the current cost of capital of the company. Value of equity is
higher in market as compared with the nominal value. Market value COC gives more accurate
and reliable results which are used by the investors for analysing capital structure of the business.
b)
The current WACC of an organization mirrors the necessary returns of existing suppliers of
fund, for example, the cost of equity (Ke) of investors and the cost of debt (Kd) of suppliers of
debt obligation, for instance, banks and credit note holders. The Ke and the Kd rely upon specific
components of the current risk profile of the organization, for example, business and the
5
Type of Capital Amount % of total Cost pre
tax
Cost after
tax
Weighted
Cost
Equity Value 200 50% 10.9% 10.9% 5.5%
Seller's note 200 50% 6% 4.5% 2.3%
WACC 7.7%
Market Value WACC
Type of Capital Amount % of total Cost pre
tax
Cost after
tax
Weighted
Cost
Equity Value
(400*5.85)
2340 92% 10.9% 10.9% 10.0%
Seller's note
(2*103.5)
207 8% 6.0% 4.5% 0.4%
WACC 10.4%
From the above calculation it is analysed that the costs of capital under book value and
under market value are different. Difference between cost of capital under is seen because of the
weights as value under books and in market of the equity and debt are different. Book value cost
of capital of the company 7.7% where cost of capital under market weights is 10.4%. Book value
weights are used by the internal management of the company for framing policies and strategies
for having an optimum capital structure. On the other market value weights are used by the
external investors for assessing the current cost of capital of the company. Value of equity is
higher in market as compared with the nominal value. Market value COC gives more accurate
and reliable results which are used by the investors for analysing capital structure of the business.
b)
The current WACC of an organization mirrors the necessary returns of existing suppliers of
fund, for example, the cost of equity (Ke) of investors and the cost of debt (Kd) of suppliers of
debt obligation, for instance, banks and credit note holders. The Ke and the Kd rely upon specific
components of the current risk profile of the organization, for example, business and the
5
Paraphrase This Document
Need a fresh take? Get an instant paraphrase of this document with our AI Paraphraser

financial risk. Giving the business risk and money related risk of an organization stay unaltered,
the Ke and the Kd, and henceforth the WACC, ought to stay unaltered (Armitage, 2017). Doing
venture evaluation, the WACC could be utilized as the discounting rate in ascertaining the
current estimations of venture’s cash flow. Since the discounting rate utilized ought to mirror the
risk of venture incomes, utilizing the WACC as the discounting rate might be fitting if the
speculation venture doesn't bring about an adjustment in the financial and the business risk of the
investing organization. One of the conditions which is probably going to leave business risk
unaltered is if the venture were a development of existing business exercises. WACC could in
this way be utilized as the discount rate in evaluating a speculation venture which hoped to grow
existing business tasks. Be that as it may, business chance relies upon the size and extent of
business operations along on its nature, thus a venture which grows existing business activities
ought to be little corresponding to the size of the current business (Ma’aji and Barnett, 2018).
The financial will stay unaltered if the speculation venture is financed so that the overall
weighting of the current source of funds is unaltered, leaving the current capital structure of the
investing organization unaltered. While this is improbable practically speaking, an organization
may fund venture in light of an objective capital structure, about which little variations are
allowed. In the event that business risk changes because of an investment proposal, with the goal
that utilizing the WACC of an organization in venture evaluation isn't proper, an undertaking
explicit discount rate ought to be determined. The CAPM can be utilized to calculate an
undertaking explicit cost of equity and this can be utilized in ascertaining a venture explicit
WACC.
Question THREE
The main objective of the working capital (WC) management are normally taken to be
profitability and the liquidity. Profitability is partnered to the financial goal of raising the
shareholders wealth, while liquidity is required so as to settle liabilities as they fall due. An
organization must have adequate money to meet its liabilities, since else it might come up short.
In any case, these two targets are in fight, since the liquid assets have very low or no return at all
and consequently leads to decline in the profitability (Chauhan and Banerjee, 2018). Under the
conservative approach of dealing with the working capital (WC) management will help in
diminishing the risk of coming short of money, preferring liquidity over the profitability and
diminishing the risk. On the other hand, an aggressive way to deal with working capital will put
6

emphasis on the profitability over liquidity, which leads to expanding the risk of coming up short
on money while expanding profit. Working capital (WC) management is integral and central part
of financial management because of several reasons (Altaf and Shah, 2017). In the first place,
money is the life-blood of an organization's business exercises and without enough money to
meet current liabilities, an organization would come up as failure. Second, the current resources
can represent the greater part of an organization's assets, thus should be managed carefully.
Ineffective management of the current resources can prompt loss of profits and would diminish
the better return to investors. Third, for SMEs current liabilities are a significant source of
account and should be deliberately and effectively managed so as to guarantee proceeding with
accessibility of such fund.
7

REFERENCES
Books and Journals
Altaf, N. and Shah, F., 2017. Working capital management, firm performance and financial
constraints. Asia-Pacific Journal of Business Administration.
Armitage, S., 2017. Discount rates for long-term projects: the cost of capital and social discount
rate compared. The European Journal of Finance, 23(1), pp.60-79.
Carreras-Simó, M. and Coenders, G., 2019. Principal component analysis of financial statements.
A compositional approach. Revista de Métodos Cuantitativos para la Economía y la
Empresa. 29.
Chauhan, G. S. and Banerjee, P., 2018. Financial constraints and optimal working capital–
evidence from an emerging market. International Journal of Managerial Finance.
Das, S. and Pandit, S., 2020. Financial Statement Analysis and Forecasting. Equity Markets,
Valuation, and Analysis.
Duţescu, A., 2019. Closing Procedures, Financial Statements and Financial Analysis.
In Financial Accounting (pp. 261-293). Palgrave Macmillan, Cham.
Ma’aji, M. M. and Barnett, C., 2018. CAPITAL BUDGETING PRACTICES AND RISKS
ADJUSTMENT: PRACTICES AMONG CAMBODIAN COMPANIES. ICMEBSS
2018. p.101.
8
1 out of 10
Related Documents

Your All-in-One AI-Powered Toolkit for Academic Success.
+13062052269
info@desklib.com
Available 24*7 on WhatsApp / Email
Unlock your academic potential
© 2024 | Zucol Services PVT LTD | All rights reserved.