IFM Report: Calculating NPV, IRR, and Investment Decisions Analysis
VerifiedAdded on 2022/12/14
|15
|3357
|158
Report
AI Summary
This report delves into the realm of international financial management, offering a comprehensive analysis of key concepts such as Net Present Value (NPV), Internal Rate of Return (IRR), and their application in investment appraisal. The report begins by calculating the expected NPV and standard deviation of NPV for Toughnut plc, followed by an analysis of RJW's estimated NPV, determining its feasibility. The report also explores the calculation of NPV, IRR, fund allocation, and cash flow for Alder plc, alongside a comparative analysis of different projects based on their NPV rankings. Furthermore, the report examines cash flow calculations, emphasizing the importance of positive NPV in investment decisions. The analysis incorporates financial formulas, tabular representations, and statistical techniques to evaluate the viability of various investment opportunities. Overall, the report aims to provide a practical understanding of financial management principles within an international context, offering insights into making informed investment decisions.

INTERNATIONAL FINANCIAL
MANAGEMENT
MANAGEMENT
Paraphrase This Document
Need a fresh take? Get an instant paraphrase of this document with our AI Paraphraser
TABLE OF CONTENTS
INTRODUCTION...........................................................................................................................1
1. Calculation of expected NPV and standard deviation of NPV of Toughnut plc.....................1
2. RJW's estimated Net present value..........................................................................................3
3. Calculation of the following for Alder plc...............................................................................4
A. Calculation of net present value..............................................................................................4
B. Internal rate of return for calculating appraisal of project......................................................5
C. Allocation of funds for achieving optimum return for getting high NPV...............................6
D. Calculation of cash flow.........................................................................................................6
CONCLUSION..............................................................................................................................11
REFERENCES..............................................................................................................................12
INTRODUCTION
International financial management is also referred as international finance deals in the
management of finance in the business environment which is international. This means making
money by trading through foreign currency exchange. This differs from financial management in
various aspects because as the IFM deals in finance of different countries various aspects are
covered in this such as political situations, diversified opportunity sets, currency and imperfect
markets (Knoke, Gosling and Paul, 2020). These factors are different in all the countries which
must be considered.
The report will shed light on the major areas of finance management such as NPV,
standard deviation of NPV of the companies such as Toughnut plc., RJW plc. etc. Net Present
Value (NPV) deals in the financial metric which helps in capturing the total value of the potential
investment opportunity. This also deals in projecting the future cash flows and the outflows
which are associated with the investment. The calculation of NPV takes into consideration many
factors such as opportunity cost; cost of capital of investor and risk tolerance through the rate of
discount. This is why, NPV or the Net Present Value is the approach which is used for financial
analysis to determine the feasibility of investment in the business or the project (Gaspars-
Wieloch, 2019).
NPV is basically the current value of the future cash flows which are then compared with
the initial investments. This report will also focus on calculating the standard deviation of NPV
which is basically a statistical technique for capital budgeting decisions for determining the
deviation from the means of project cash flows (Madura, 2020). The report will therefore shed
more light on calculation of the NPV and the standard deviation of NPV by using specific
formulas and tables.
1. Calculation of expected NPV and standard deviation of NPV of Toughnut plc
Investment at the initial level = 15000
Year 1
Returns Probability Expected
value
Returns Probability Expected
value
8000 0.1 800 4000 0.3 1200
1
⊘ This is a preview!⊘
Do you want full access?
Subscribe today to unlock all pages.
Trusted by 1+ million students worldwide
10000 0.6 6000 8000 0.7 5600
12000 0.3 3600
Expected
value of
returns in
year 1
10400 Expected
value of
returns in
year 2
6800
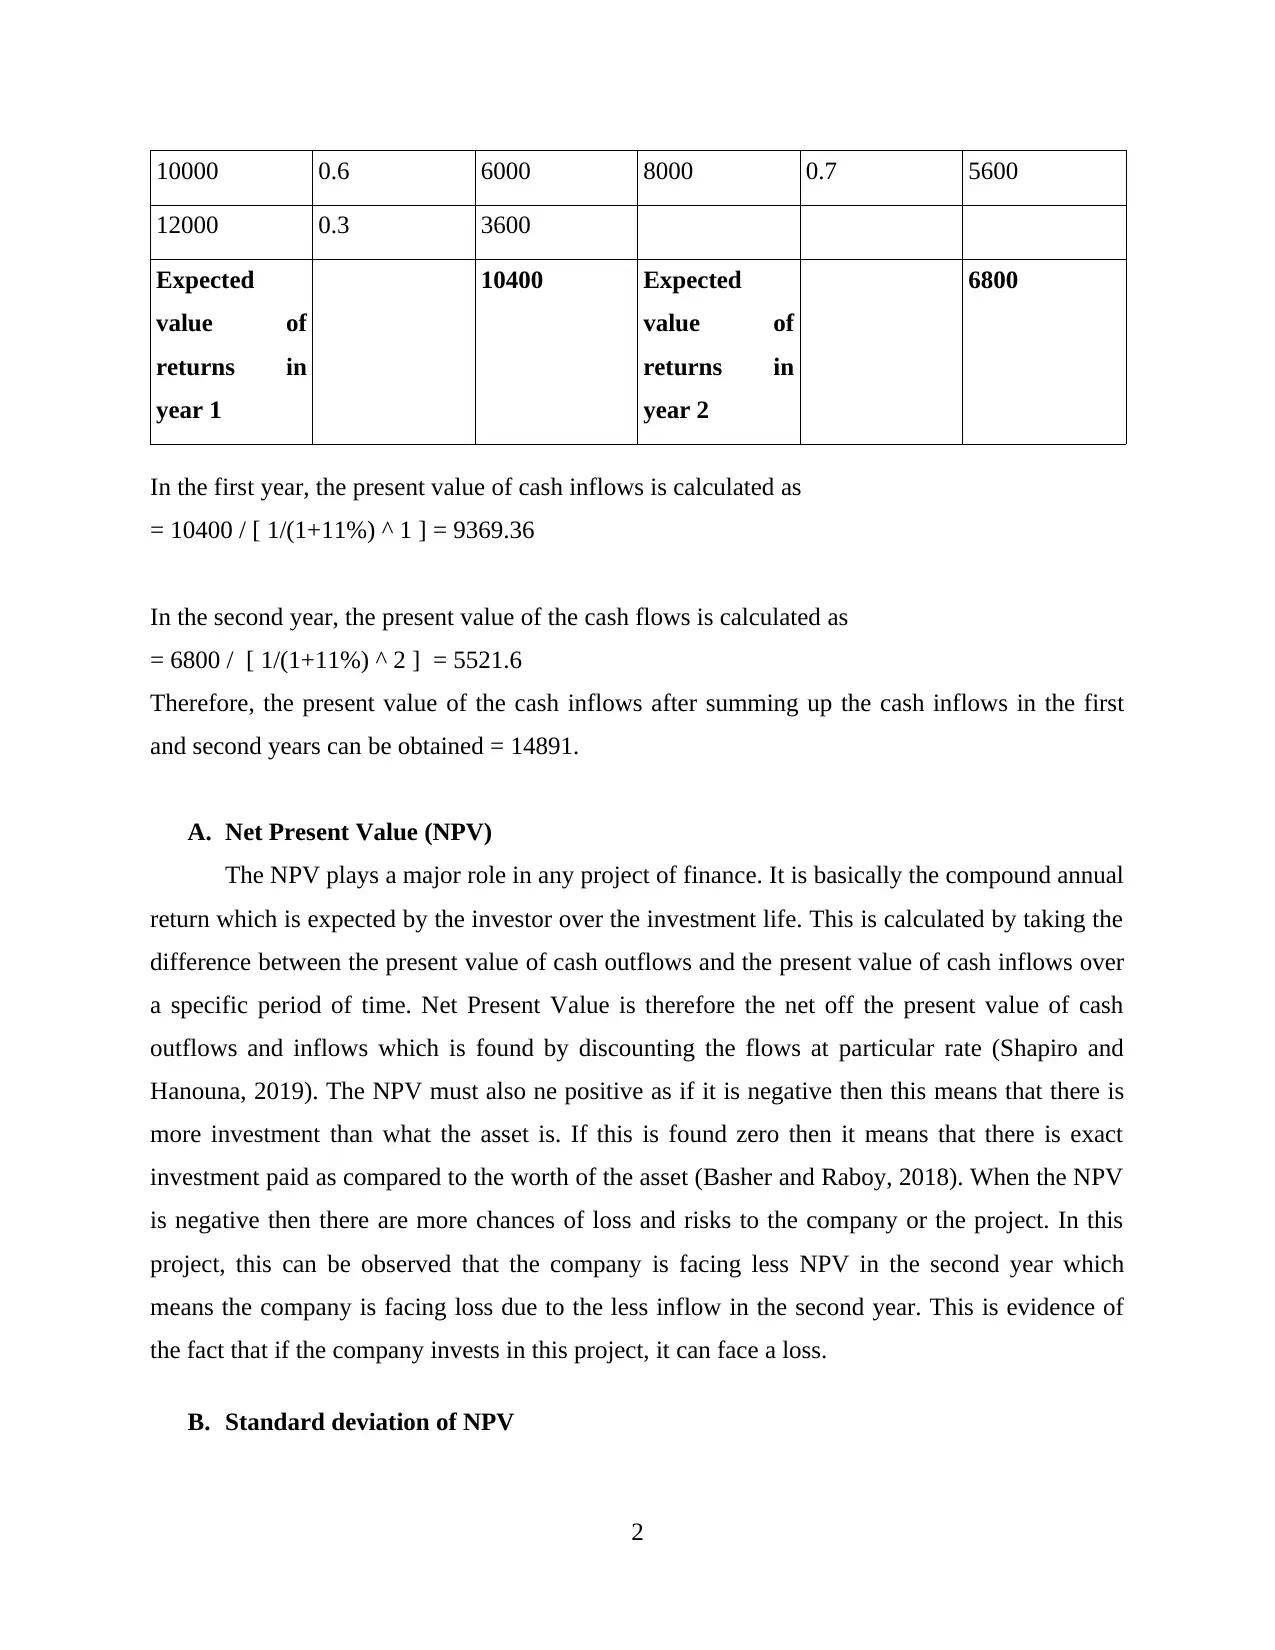
In the first year, the present value of cash inflows is calculated as
= 10400 / [ 1/(1+11%) ^ 1 ] = 9369.36
In the second year, the present value of the cash flows is calculated as
= 6800 / [ 1/(1+11%) ^ 2 ] = 5521.6
Therefore, the present value of the cash inflows after summing up the cash inflows in the first
and second years can be obtained = 14891.
A. Net Present Value (NPV)
The NPV plays a major role in any project of finance. It is basically the compound annual
return which is expected by the investor over the investment life. This is calculated by taking the
difference between the present value of cash outflows and the present value of cash inflows over
a specific period of time. Net Present Value is therefore the net off the present value of cash
outflows and inflows which is found by discounting the flows at particular rate (Shapiro and
Hanouna, 2019). The NPV must also ne positive as if it is negative then this means that there is
more investment than what the asset is. If this is found zero then it means that there is exact
investment paid as compared to the worth of the asset (Basher and Raboy, 2018). When the NPV
is negative then there are more chances of loss and risks to the company or the project. In this
project, this can be observed that the company is facing less NPV in the second year which
means the company is facing loss due to the less inflow in the second year. This is evidence of
the fact that if the company invests in this project, it can face a loss.
B. Standard deviation of NPV
2
12000 0.3 3600
Expected
value of
returns in
year 1
10400 Expected
value of
returns in
year 2
6800
In the first year, the present value of cash inflows is calculated as
= 10400 / [ 1/(1+11%) ^ 1 ] = 9369.36
In the second year, the present value of the cash flows is calculated as
= 6800 / [ 1/(1+11%) ^ 2 ] = 5521.6
Therefore, the present value of the cash inflows after summing up the cash inflows in the first
and second years can be obtained = 14891.
A. Net Present Value (NPV)
The NPV plays a major role in any project of finance. It is basically the compound annual
return which is expected by the investor over the investment life. This is calculated by taking the
difference between the present value of cash outflows and the present value of cash inflows over
a specific period of time. Net Present Value is therefore the net off the present value of cash
outflows and inflows which is found by discounting the flows at particular rate (Shapiro and
Hanouna, 2019). The NPV must also ne positive as if it is negative then this means that there is
more investment than what the asset is. If this is found zero then it means that there is exact
investment paid as compared to the worth of the asset (Basher and Raboy, 2018). When the NPV
is negative then there are more chances of loss and risks to the company or the project. In this
project, this can be observed that the company is facing less NPV in the second year which
means the company is facing loss due to the less inflow in the second year. This is evidence of
the fact that if the company invests in this project, it can face a loss.
B. Standard deviation of NPV
2
Paraphrase This Document
Need a fresh take? Get an instant paraphrase of this document with our AI Paraphraser
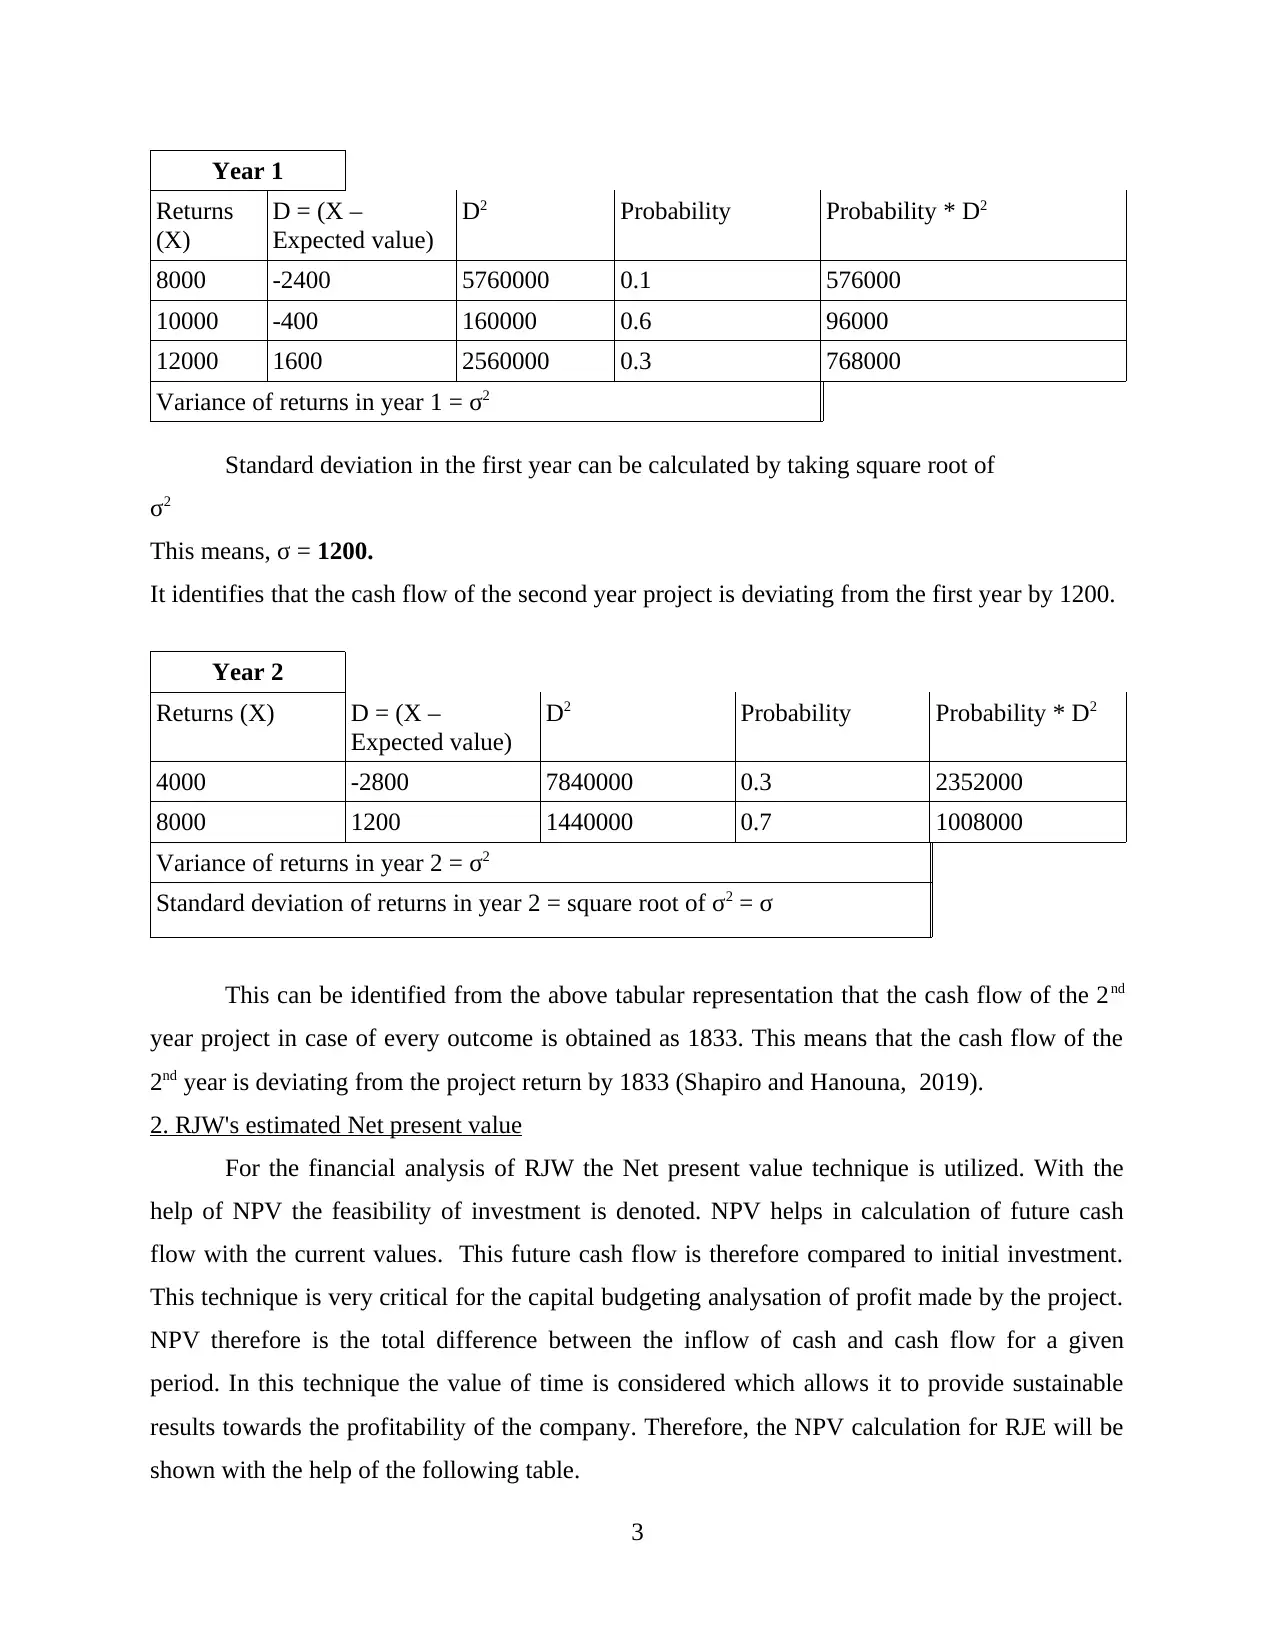
Year 1
Returns
(X)
D = (X –
Expected value)
D2 Probability Probability * D2
8000 -2400 5760000 0.1 576000
10000 -400 160000 0.6 96000
12000 1600 2560000 0.3 768000
Variance of returns in year 1 = σ2
Standard deviation in the first year can be calculated by taking square root of
σ2
This means, σ = 1200.
It identifies that the cash flow of the second year project is deviating from the first year by 1200.
Year 2
Returns (X) D = (X –
Expected value)
D2 Probability Probability * D2
4000 -2800 7840000 0.3 2352000
8000 1200 1440000 0.7 1008000
Variance of returns in year 2 = σ2
Standard deviation of returns in year 2 = square root of σ2 = σ
This can be identified from the above tabular representation that the cash flow of the 2nd
year project in case of every outcome is obtained as 1833. This means that the cash flow of the
2nd year is deviating from the project return by 1833 (Shapiro and Hanouna, 2019).
2. RJW's estimated Net present value
For the financial analysis of RJW the Net present value technique is utilized. With the
help of NPV the feasibility of investment is denoted. NPV helps in calculation of future cash
flow with the current values. This future cash flow is therefore compared to initial investment.
This technique is very critical for the capital budgeting analysation of profit made by the project.
NPV therefore is the total difference between the inflow of cash and cash flow for a given
period. In this technique the value of time is considered which allows it to provide sustainable
results towards the profitability of the company. Therefore, the NPV calculation for RJE will be
shown with the help of the following table.
3
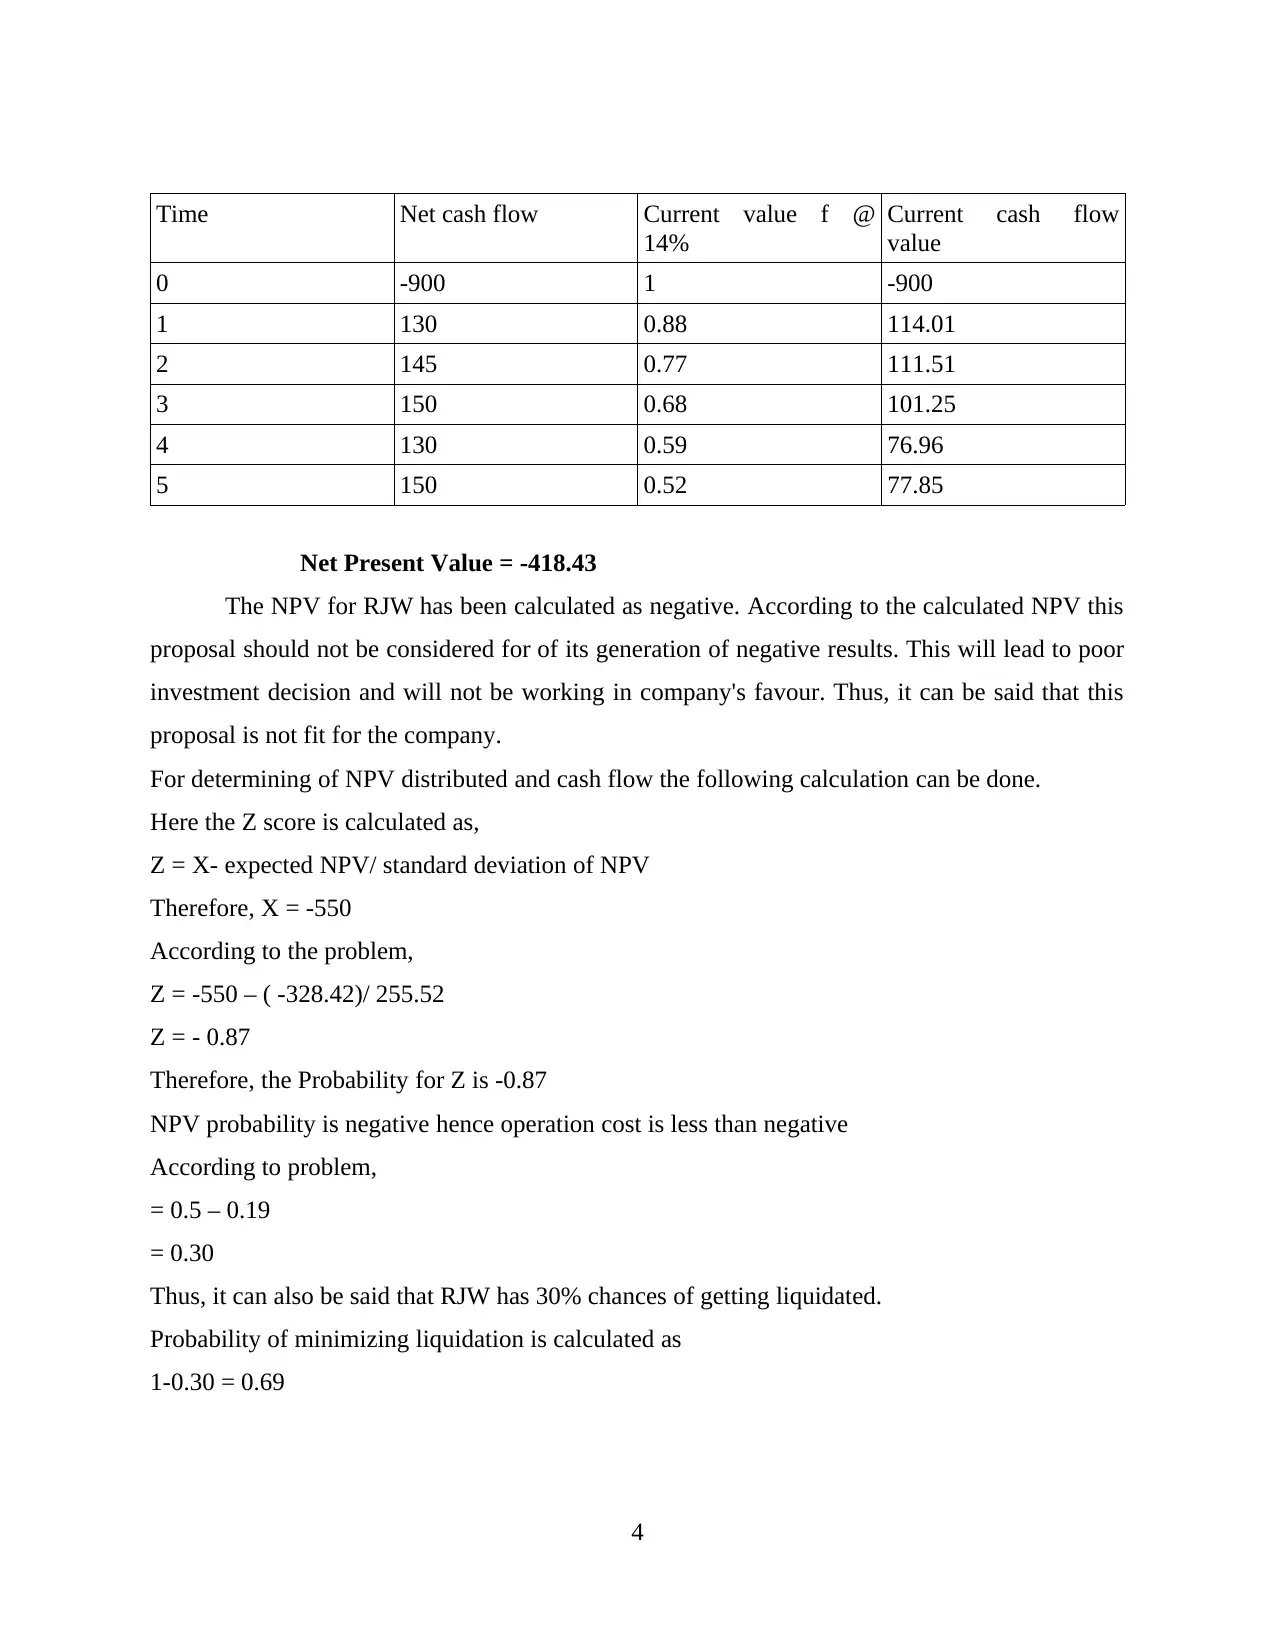
Time Net cash flow Current value f @
14%
Current cash flow
value
0 -900 1 -900
1 130 0.88 114.01
2 145 0.77 111.51
3 150 0.68 101.25
4 130 0.59 76.96
5 150 0.52 77.85
Net Present Value = -418.43
The NPV for RJW has been calculated as negative. According to the calculated NPV this
proposal should not be considered for of its generation of negative results. This will lead to poor
investment decision and will not be working in company's favour. Thus, it can be said that this
proposal is not fit for the company.
For determining of NPV distributed and cash flow the following calculation can be done.
Here the Z score is calculated as,
Z = X- expected NPV/ standard deviation of NPV
Therefore, X = -550
According to the problem,
Z = -550 – ( -328.42)/ 255.52
Z = - 0.87
Therefore, the Probability for Z is -0.87
NPV probability is negative hence operation cost is less than negative
According to problem,
= 0.5 – 0.19
= 0.30
Thus, it can also be said that RJW has 30% chances of getting liquidated.
Probability of minimizing liquidation is calculated as
1-0.30 = 0.69
4
⊘ This is a preview!⊘
Do you want full access?
Subscribe today to unlock all pages.
Trusted by 1+ million students worldwide
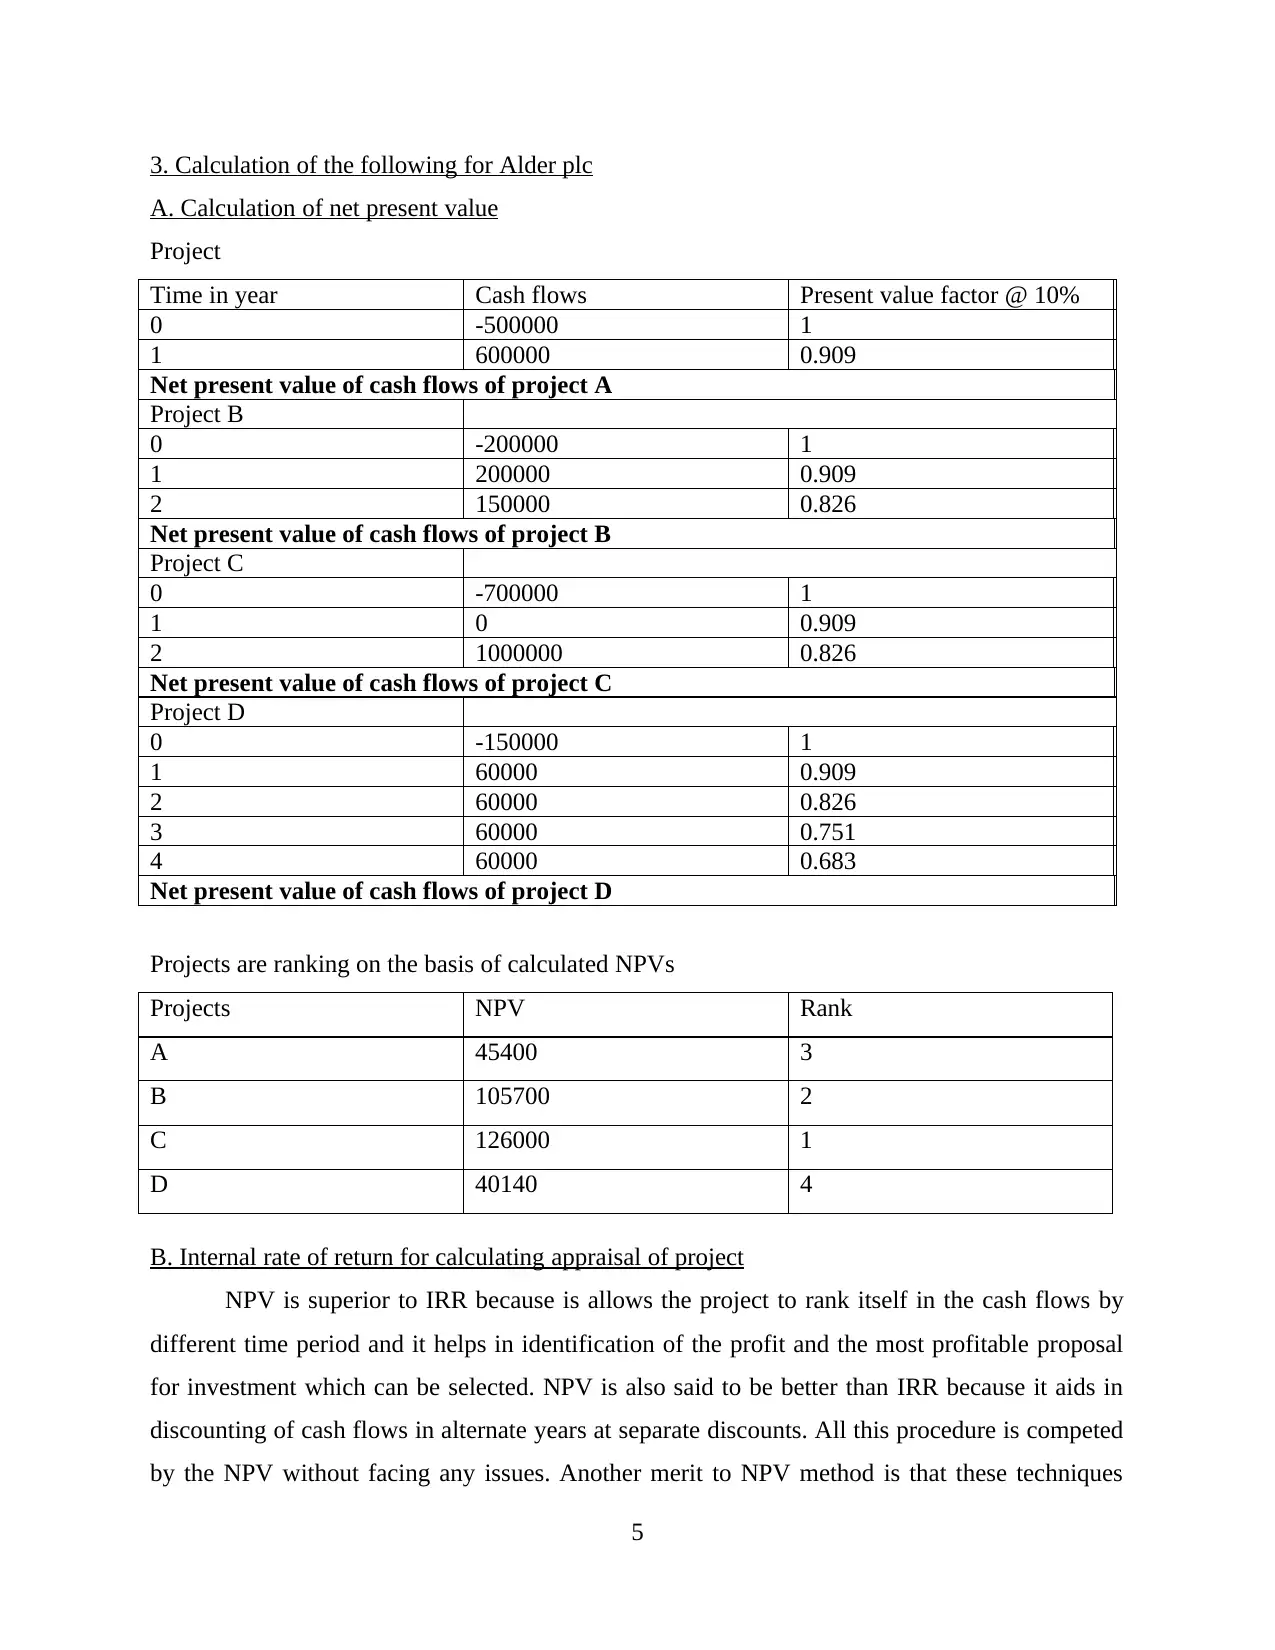
3. Calculation of the following for Alder plc
A. Calculation of net present value
Project
Time in year Cash flows Present value factor @ 10%
0 -500000 1
1 600000 0.909
Net present value of cash flows of project A
Project B
0 -200000 1
1 200000 0.909
2 150000 0.826
Net present value of cash flows of project B
Project C
0 -700000 1
1 0 0.909
2 1000000 0.826
Net present value of cash flows of project C
Project D
0 -150000 1
1 60000 0.909
2 60000 0.826
3 60000 0.751
4 60000 0.683
Net present value of cash flows of project D
Projects are ranking on the basis of calculated NPVs
Projects NPV Rank
A 45400 3
B 105700 2
C 126000 1
D 40140 4
B. Internal rate of return for calculating appraisal of project
NPV is superior to IRR because is allows the project to rank itself in the cash flows by
different time period and it helps in identification of the profit and the most profitable proposal
for investment which can be selected. NPV is also said to be better than IRR because it aids in
discounting of cash flows in alternate years at separate discounts. All this procedure is competed
by the NPV without facing any issues. Another merit to NPV method is that these techniques
5
Paraphrase This Document
Need a fresh take? Get an instant paraphrase of this document with our AI Paraphraser
allows the calculation of lots of discounted rates for making the business more flexible allowing
the company more options during selection of its investments. IRR tool do not have this system
present in it making it less flexible enough.
Another technique which is very useful when it comes to making investment decision is
the decision-making technique. With the help of NPV all the factors of inflow can be found
according to the life of the project. In IRR the discounting rate for return and reinvestment rates
both can be said as same as per NPV. Thus, it makes both the techniques quite different from
each other. All the factors of financial management influences the decision-making of context of
investment in the project.
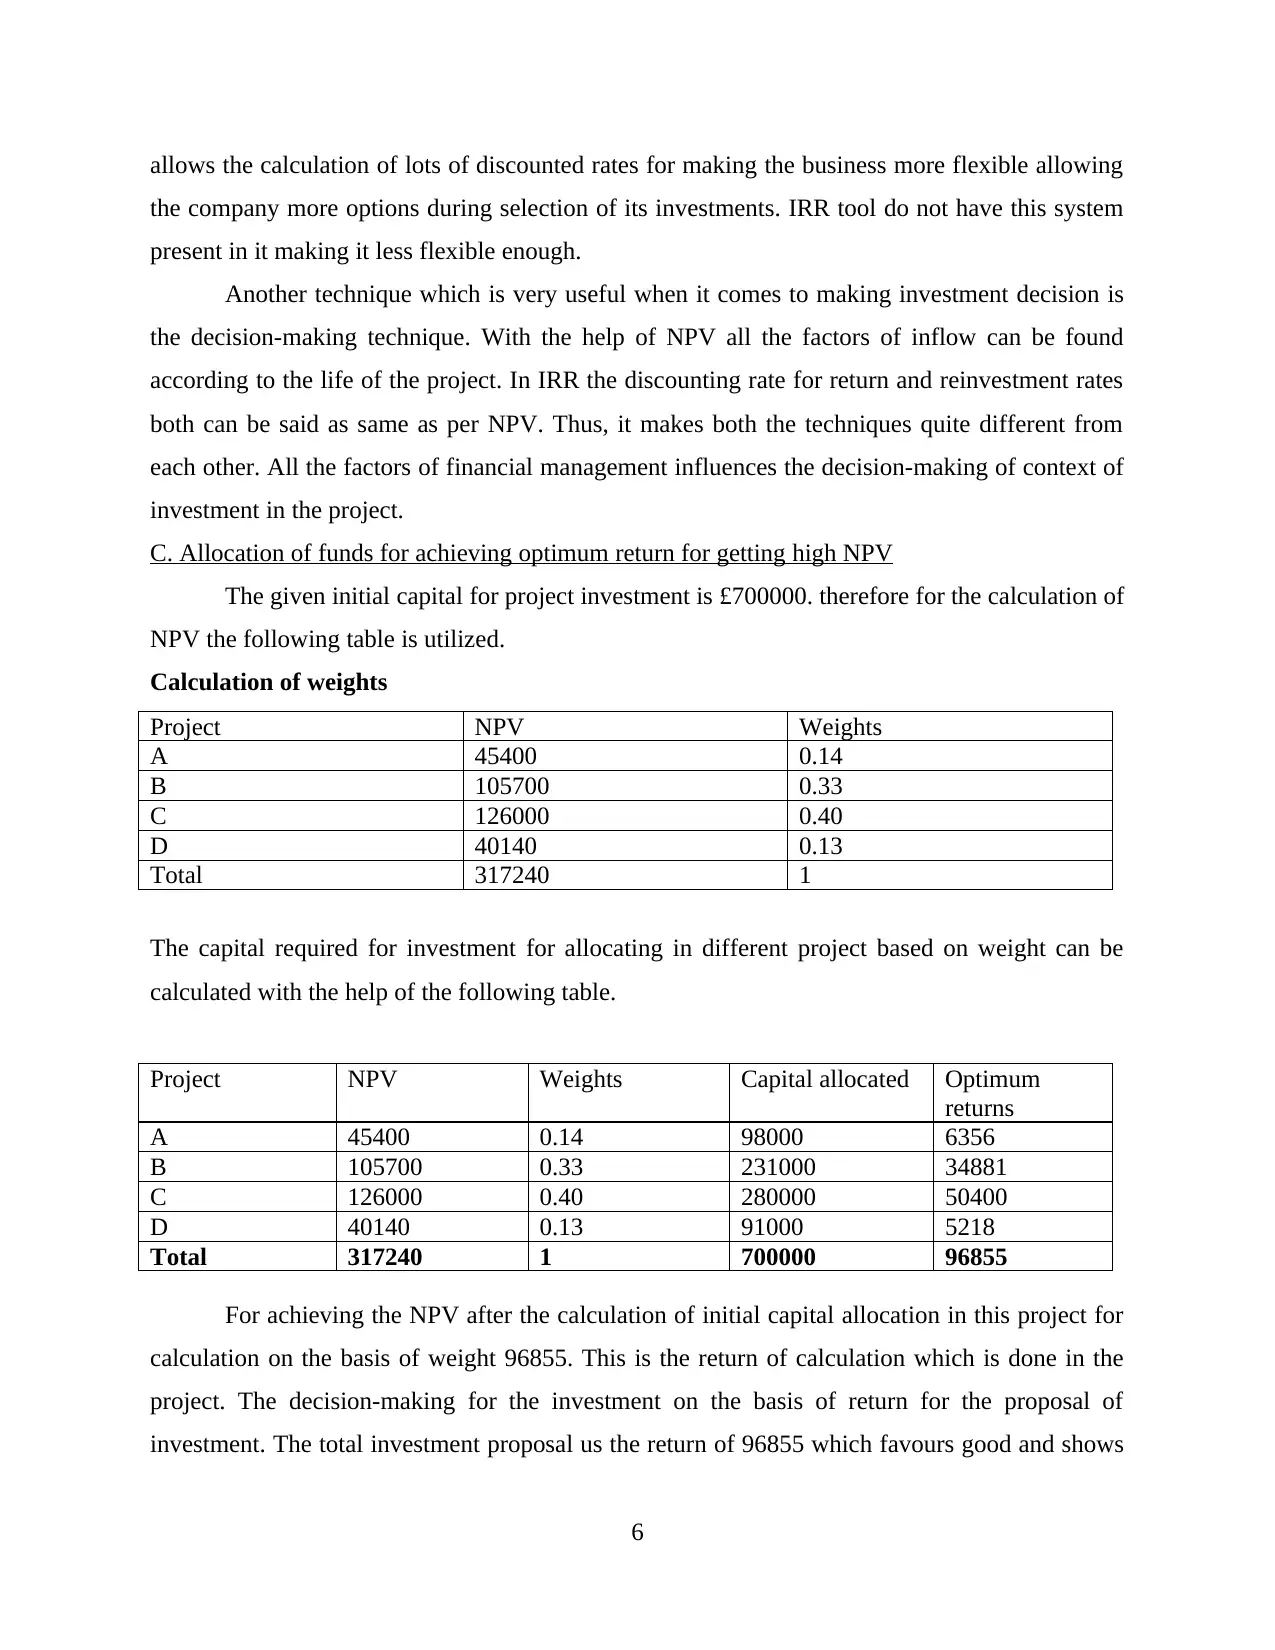
C. Allocation of funds for achieving optimum return for getting high NPV
The given initial capital for project investment is £700000. therefore for the calculation of
NPV the following table is utilized.
Calculation of weights
Project NPV Weights
A 45400 0.14
B 105700 0.33
C 126000 0.40
D 40140 0.13
Total 317240 1
The capital required for investment for allocating in different project based on weight can be
calculated with the help of the following table.
Project NPV Weights Capital allocated Optimum
returns
A 45400 0.14 98000 6356
B 105700 0.33 231000 34881
C 126000 0.40 280000 50400
D 40140 0.13 91000 5218
Total 317240 1 700000 96855
For achieving the NPV after the calculation of initial capital allocation in this project for
calculation on the basis of weight 96855. This is the return of calculation which is done in the
project. The decision-making for the investment on the basis of return for the proposal of
investment. The total investment proposal us the return of 96855 which favours good and shows
6
the company more options during selection of its investments. IRR tool do not have this system
present in it making it less flexible enough.
Another technique which is very useful when it comes to making investment decision is
the decision-making technique. With the help of NPV all the factors of inflow can be found
according to the life of the project. In IRR the discounting rate for return and reinvestment rates
both can be said as same as per NPV. Thus, it makes both the techniques quite different from
each other. All the factors of financial management influences the decision-making of context of
investment in the project.
C. Allocation of funds for achieving optimum return for getting high NPV
The given initial capital for project investment is £700000. therefore for the calculation of
NPV the following table is utilized.
Calculation of weights
Project NPV Weights
A 45400 0.14
B 105700 0.33
C 126000 0.40
D 40140 0.13
Total 317240 1
The capital required for investment for allocating in different project based on weight can be
calculated with the help of the following table.
Project NPV Weights Capital allocated Optimum
returns
A 45400 0.14 98000 6356
B 105700 0.33 231000 34881
C 126000 0.40 280000 50400
D 40140 0.13 91000 5218
Total 317240 1 700000 96855
For achieving the NPV after the calculation of initial capital allocation in this project for
calculation on the basis of weight 96855. This is the return of calculation which is done in the
project. The decision-making for the investment on the basis of return for the proposal of
investment. The total investment proposal us the return of 96855 which favours good and shows
6
the value of net present value and technique for selection of profitability in the project (Dikov,
2020).
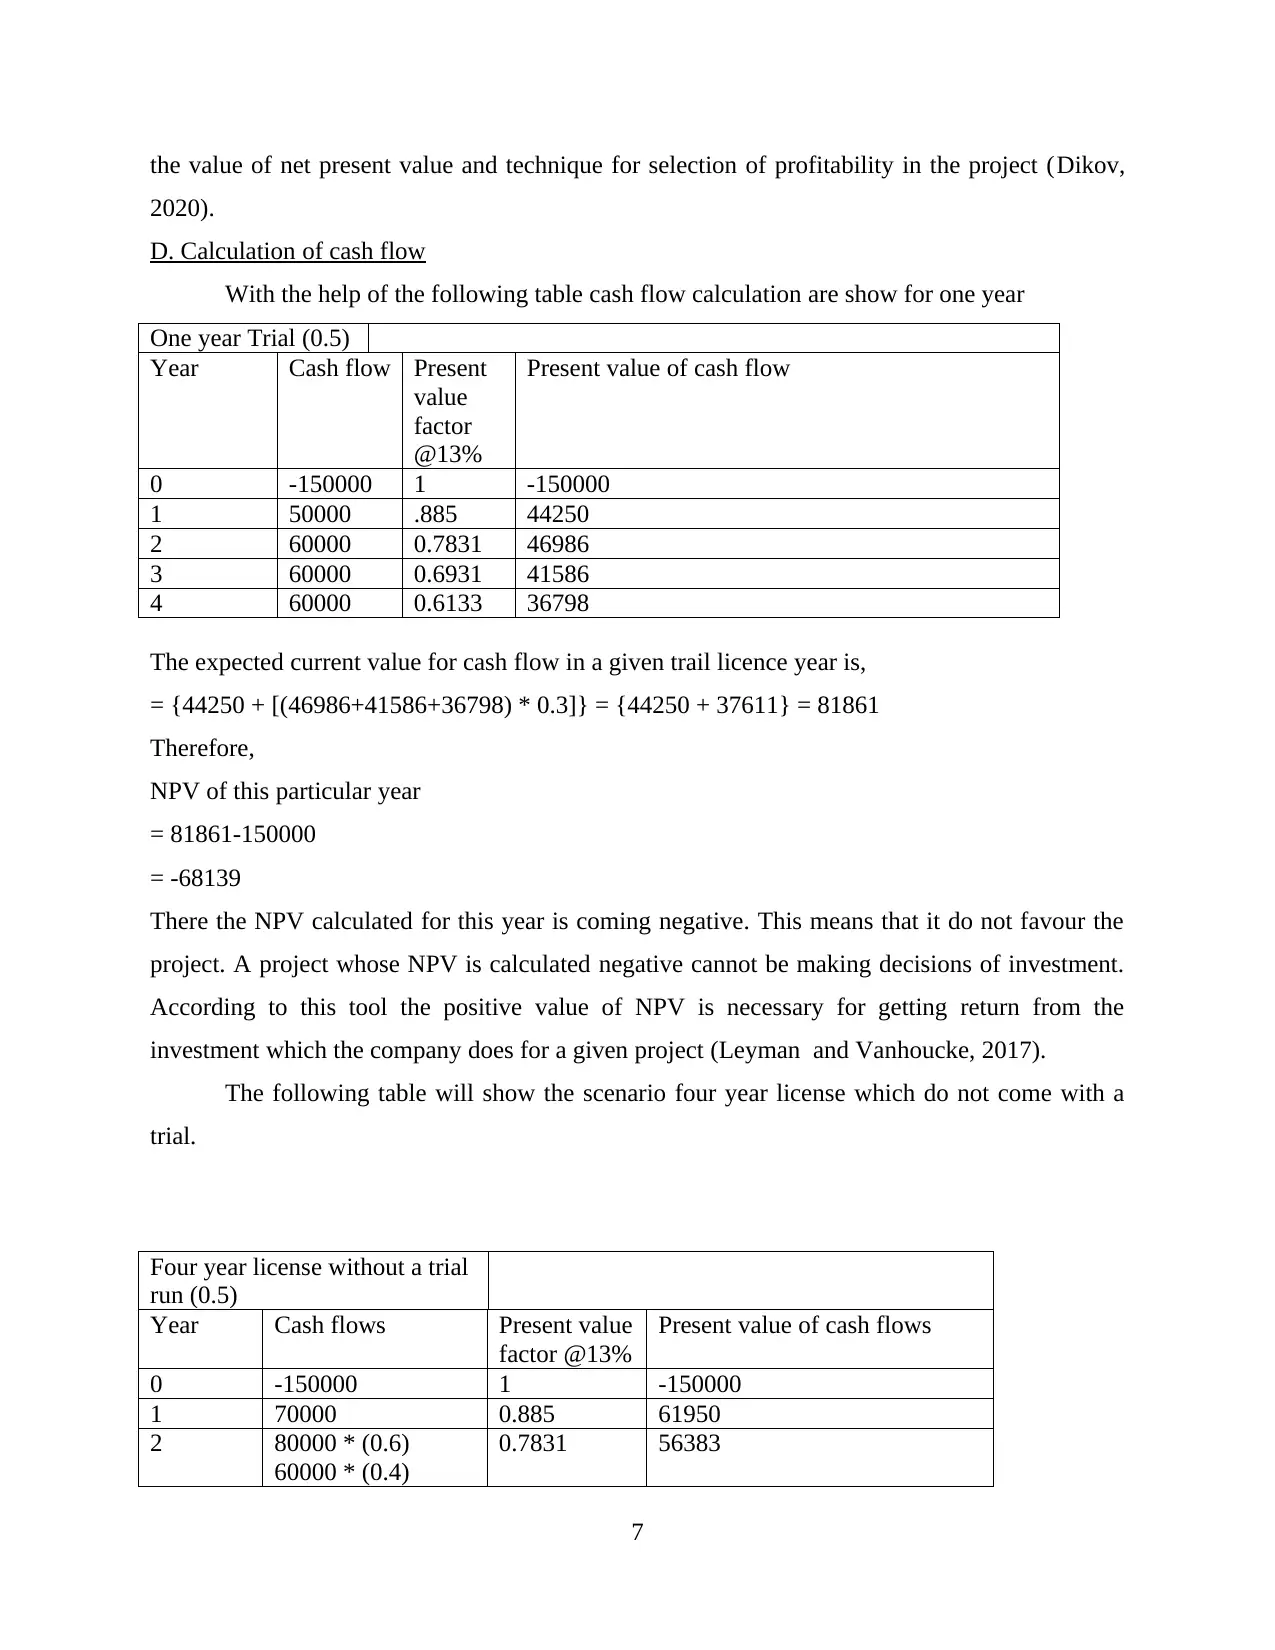
D. Calculation of cash flow
With the help of the following table cash flow calculation are show for one year
One year Trial (0.5)
Year Cash flow Present
value
factor
@13%
Present value of cash flow
0 -150000 1 -150000
1 50000 .885 44250
2 60000 0.7831 46986
3 60000 0.6931 41586
4 60000 0.6133 36798
The expected current value for cash flow in a given trail licence year is,
= {44250 + [(46986+41586+36798) * 0.3]} = {44250 + 37611} = 81861
Therefore,
NPV of this particular year
= 81861-150000
= -68139
There the NPV calculated for this year is coming negative. This means that it do not favour the
project. A project whose NPV is calculated negative cannot be making decisions of investment.
According to this tool the positive value of NPV is necessary for getting return from the
investment which the company does for a given project (Leyman and Vanhoucke, 2017).
The following table will show the scenario four year license which do not come with a
trial.
Four year license without a trial
run (0.5)
Year Cash flows Present value
factor @13%
Present value of cash flows
0 -150000 1 -150000
1 70000 0.885 61950
2 80000 * (0.6)
60000 * (0.4)
0.7831 56383
7
2020).
D. Calculation of cash flow
With the help of the following table cash flow calculation are show for one year
One year Trial (0.5)
Year Cash flow Present
value
factor
@13%
Present value of cash flow
0 -150000 1 -150000
1 50000 .885 44250
2 60000 0.7831 46986
3 60000 0.6931 41586
4 60000 0.6133 36798
The expected current value for cash flow in a given trail licence year is,
= {44250 + [(46986+41586+36798) * 0.3]} = {44250 + 37611} = 81861
Therefore,
NPV of this particular year
= 81861-150000
= -68139
There the NPV calculated for this year is coming negative. This means that it do not favour the
project. A project whose NPV is calculated negative cannot be making decisions of investment.
According to this tool the positive value of NPV is necessary for getting return from the
investment which the company does for a given project (Leyman and Vanhoucke, 2017).
The following table will show the scenario four year license which do not come with a
trial.
Four year license without a trial
run (0.5)
Year Cash flows Present value
factor @13%
Present value of cash flows
0 -150000 1 -150000
1 70000 0.885 61950
2 80000 * (0.6)
60000 * (0.4)
0.7831 56383
7
⊘ This is a preview!⊘
Do you want full access?
Subscribe today to unlock all pages.
Trusted by 1+ million students worldwide
3 80000 * (0.6)
60000 * (0.4)
0.6931 49903
4 80000 * (0.6)
60000 * (0.4)
0.6133 44158
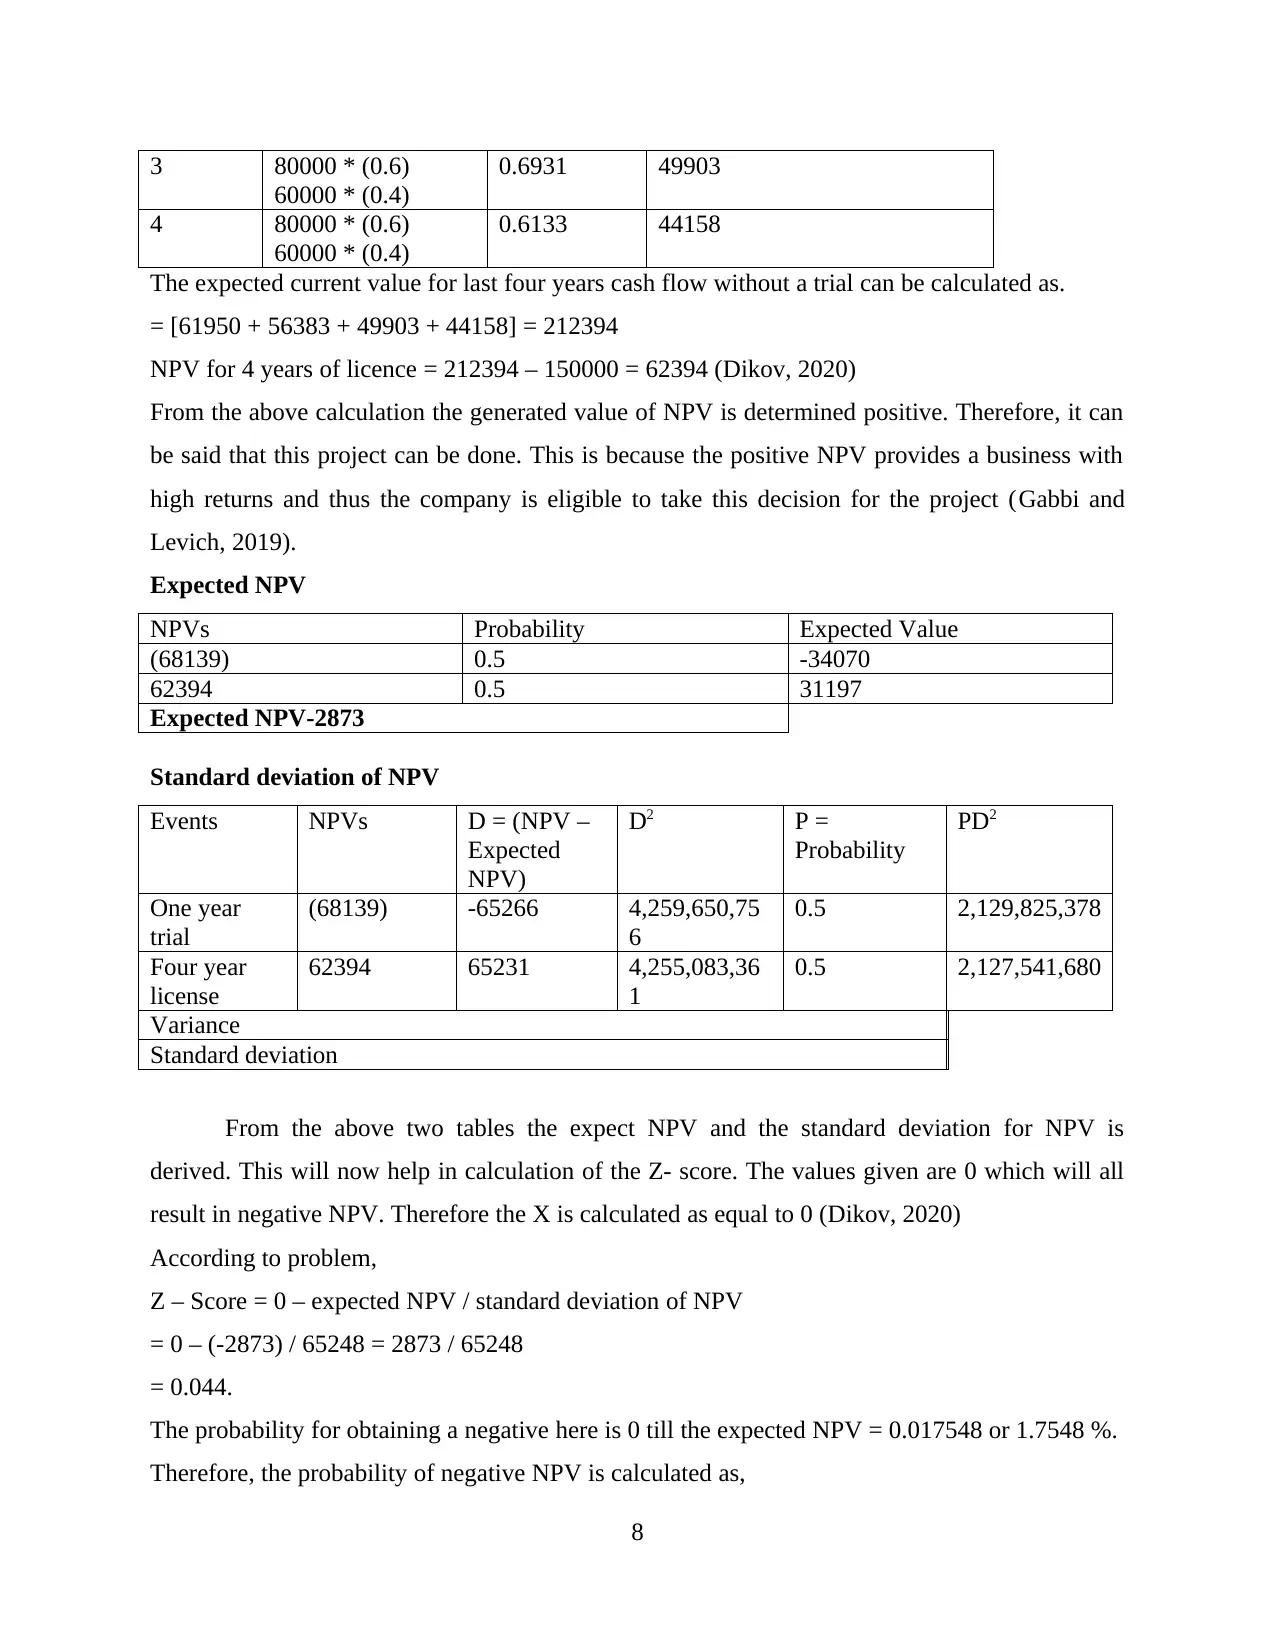
The expected current value for last four years cash flow without a trial can be calculated as.
= [61950 + 56383 + 49903 + 44158] = 212394
NPV for 4 years of licence = 212394 – 150000 = 62394 (Dikov, 2020)
From the above calculation the generated value of NPV is determined positive. Therefore, it can
be said that this project can be done. This is because the positive NPV provides a business with
high returns and thus the company is eligible to take this decision for the project (Gabbi and
Levich, 2019).
Expected NPV
NPVs Probability Expected Value
(68139) 0.5 -34070
62394 0.5 31197
Expected NPV-2873
Standard deviation of NPV
Events NPVs D = (NPV –
Expected
NPV)
D2 P =
Probability
PD2
One year
trial
(68139) -65266 4,259,650,75
6
0.5 2,129,825,378
Four year
license
62394 65231 4,255,083,36
1
0.5 2,127,541,680
Variance
Standard deviation
From the above two tables the expect NPV and the standard deviation for NPV is
derived. This will now help in calculation of the Z- score. The values given are 0 which will all
result in negative NPV. Therefore the X is calculated as equal to 0 (Dikov, 2020)
According to problem,
Z – Score = 0 – expected NPV / standard deviation of NPV
= 0 – (-2873) / 65248 = 2873 / 65248
= 0.044.
The probability for obtaining a negative here is 0 till the expected NPV = 0.017548 or 1.7548 %.
Therefore, the probability of negative NPV is calculated as,
8
60000 * (0.4)
0.6931 49903
4 80000 * (0.6)
60000 * (0.4)
0.6133 44158
The expected current value for last four years cash flow without a trial can be calculated as.
= [61950 + 56383 + 49903 + 44158] = 212394
NPV for 4 years of licence = 212394 – 150000 = 62394 (Dikov, 2020)
From the above calculation the generated value of NPV is determined positive. Therefore, it can
be said that this project can be done. This is because the positive NPV provides a business with
high returns and thus the company is eligible to take this decision for the project (Gabbi and
Levich, 2019).
Expected NPV
NPVs Probability Expected Value
(68139) 0.5 -34070
62394 0.5 31197
Expected NPV-2873
Standard deviation of NPV
Events NPVs D = (NPV –
Expected
NPV)
D2 P =
Probability
PD2
One year
trial
(68139) -65266 4,259,650,75
6
0.5 2,129,825,378
Four year
license
62394 65231 4,255,083,36
1
0.5 2,127,541,680
Variance
Standard deviation
From the above two tables the expect NPV and the standard deviation for NPV is
derived. This will now help in calculation of the Z- score. The values given are 0 which will all
result in negative NPV. Therefore the X is calculated as equal to 0 (Dikov, 2020)
According to problem,
Z – Score = 0 – expected NPV / standard deviation of NPV
= 0 – (-2873) / 65248 = 2873 / 65248
= 0.044.
The probability for obtaining a negative here is 0 till the expected NPV = 0.017548 or 1.7548 %.
Therefore, the probability of negative NPV is calculated as,
8
Paraphrase This Document
Need a fresh take? Get an instant paraphrase of this document with our AI Paraphraser
= 0.5 + 0.017548
= 0.5175 or 51.75%.
In all the analysed project there remains a factor of negative NPV which helps in not making
decisions of investment. In the scenario were the company has made an investment decision it
will be very difficult for the company to handle and the business will start facing losses. The
negative value of NPV shows that the business will not be successful in earning from investment
in there project. This it is required by the business to make careful evaluation for all the types of
investments. This shows the importance of NPV and also provides exact picture of the given
project based on the investment of the business (Yusrina and et.al 2017).
For the calculation of NPV for optimistic forecast the following table is presented.
Time Net cash flows Present value factor @
14%
Present value of cash
flows
0 -900 1 -900
1 260 0.88 228.02
2 276.6 0.77 212.71
3 283.33 0.68 191.25
4 271 0.59 160.43
5 280 0.52 145.32
Net present value 37.73
For the calculation of NPV for pessimistic forecast the following table is presented
(Jinadu and et.al., 2017).
Time Net cash flows Present value factor @ 14%
0 -900 1
1 96.67 0.88
2 111.7 0.77
3 116.67 0.68
9
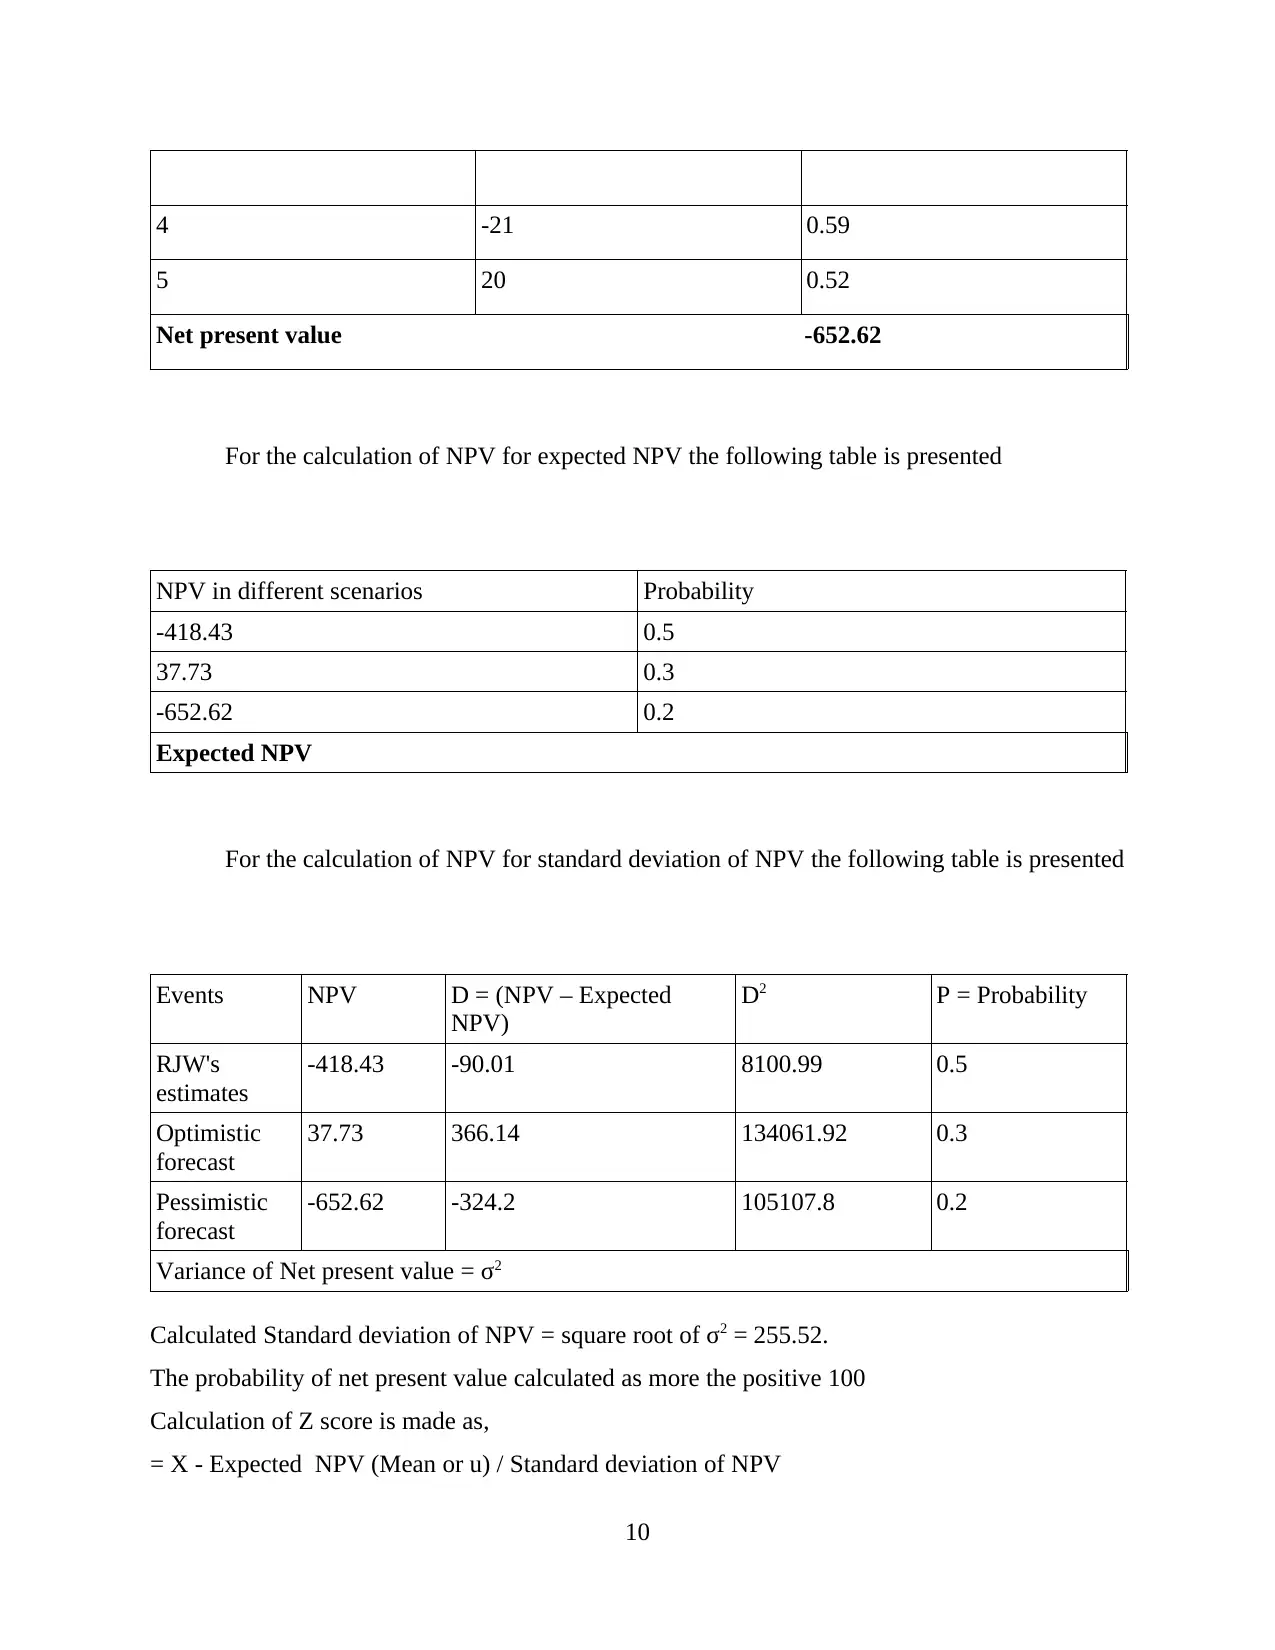
4 -21 0.59
5 20 0.52
Net present value -652.62
For the calculation of NPV for expected NPV the following table is presented
NPV in different scenarios Probability
-418.43 0.5
37.73 0.3
-652.62 0.2
Expected NPV
For the calculation of NPV for standard deviation of NPV the following table is presented
Events NPV D = (NPV – Expected
NPV)
D2 P = Probability
RJW's
estimates
-418.43 -90.01 8100.99 0.5
Optimistic
forecast
37.73 366.14 134061.92 0.3
Pessimistic
forecast
-652.62 -324.2 105107.8 0.2
Variance of Net present value = σ2
Calculated Standard deviation of NPV = square root of σ2 = 255.52.
The probability of net present value calculated as more the positive 100
Calculation of Z score is made as,
= X - Expected NPV (Mean or u) / Standard deviation of NPV
10
⊘ This is a preview!⊘
Do you want full access?
Subscribe today to unlock all pages.
Trusted by 1+ million students worldwide
1 out of 15
Related Documents

![International Finance Management Assignment - Finance [Course Code]](/_next/image/?url=https%3A%2F%2Fdesklib.com%2Fmedia%2Fimages%2Ffd%2F69271dad5c5f4f2c8ab93e7e6daf77ee.jpg&w=256&q=75)


Your All-in-One AI-Powered Toolkit for Academic Success.
+13062052269
info@desklib.com
Available 24*7 on WhatsApp / Email
![[object Object]](/_next/static/media/star-bottom.7253800d.svg)
Unlock your academic potential
Copyright © 2020–2026 A2Z Services. All Rights Reserved. Developed and managed by ZUCOL.