Financial Management Report: Valuation, Capital Budgeting Analysis
VerifiedAdded on 2023/01/10
|15
|3687
|92
Report
AI Summary
This report provides a comprehensive analysis of financial management concepts. It begins with an introduction to financial management, emphasizing its role in decision-making. The report then delves into valuation methods, including the price/earnings ratio, dividend valuation, and discounted cash flow, with detailed calculations and critical reviews of each method. The report further explores capital budgeting tools, calculating and evaluating the merits and demerits of various techniques such as Net Present Value (NPV), Internal Rate of Return (IRR), payback period, and accounting rate of return (ARR). The analysis includes detailed calculations, tables, and critical evaluations, providing a thorough understanding of financial management principles and their application in investment decisions. The report concludes with a critical review of each method and tool, highlighting their strengths and weaknesses.

Financial Management
Paraphrase This Document
Need a fresh take? Get an instant paraphrase of this document with our AI Paraphraser
Table of Contents
INTRODUCTION...........................................................................................................................3
Question 2 – Mergers and Takeovers..............................................................................................3
a) Price/earnings ratio.................................................................................................................3
b) Dividend valuation method.....................................................................................................4
c) Discounted cash flow method.................................................................................................5
d. Critical review.........................................................................................................................6
Question 3........................................................................................................................................7
a. Calculating capital budgeting tool ..........................................................................................7
b. Critically evaluating merits & demerits of different capital budgeting tools .........................9
CONCLUSION .............................................................................................................................13
REFERENCES..............................................................................................................................14
INTRODUCTION
FM refers to planning, directing, organizing & controlling financial activities like
acquisition and use of funds of an entity. It means as application of the general principles of
management to the financial resources of company. It acts as the most important part of an
organization as all the important decisions are based on FM such as investment, dividend and
financing decision. The present report is based on different aspects of FM which include
computation of P/E ratio and valuation of dividend and asset. Furthermore, the report highlights
different methods of capital budgeting which helps in analysing the suitability of project.
Moreover, benefits and limitation of investment appraisal tools is also been presented in the
study.
Question 2 – Mergers and Takeovers
a) Price/earnings ratio
The price earnings ratio is the most common and popular method for the purpose of
valuation of the business. Under this approach, the price is identified using PER of the other
similar quoted business in the industry. The PER is evaluated by dividing the present MP per
share of the entity with its earnings per share (EPS). It helps in determining how much money
the investor is willing to pay for the company’s earnings (Ivanovski, Narasanov and Ivanovska,
2018). The companies with the higher earnings growth prospects mainly carry higher price
earnings ratio, this is because of the reason that these business entities are in the position to offer
return to its investors very quickly and higher percentage return in respect to the investment
which will be through offering dividend, rise in the share price or both. For instance, a company
having the price earnings ratio of 15 means it is selling for 15 times of its income and in simple
and easy terms, the investors are in the position to pay £15 for every £1 of present or the coming
years income (JUŠKEVIČIŪTĖ, 2017). In case of mergers and acquisition, using the price
earnings ratio for valuation, it is considered to be very useful as it can be used in comparing the
ratio with the various different business entity in the same industry or even against the historical
values of the company. But this ratio can be easily manipulated by the company as per the
requirement suing the accounting practices.
⊘ This is a preview!⊘
Do you want full access?
Subscribe today to unlock all pages.
Trusted by 1+ million students worldwide
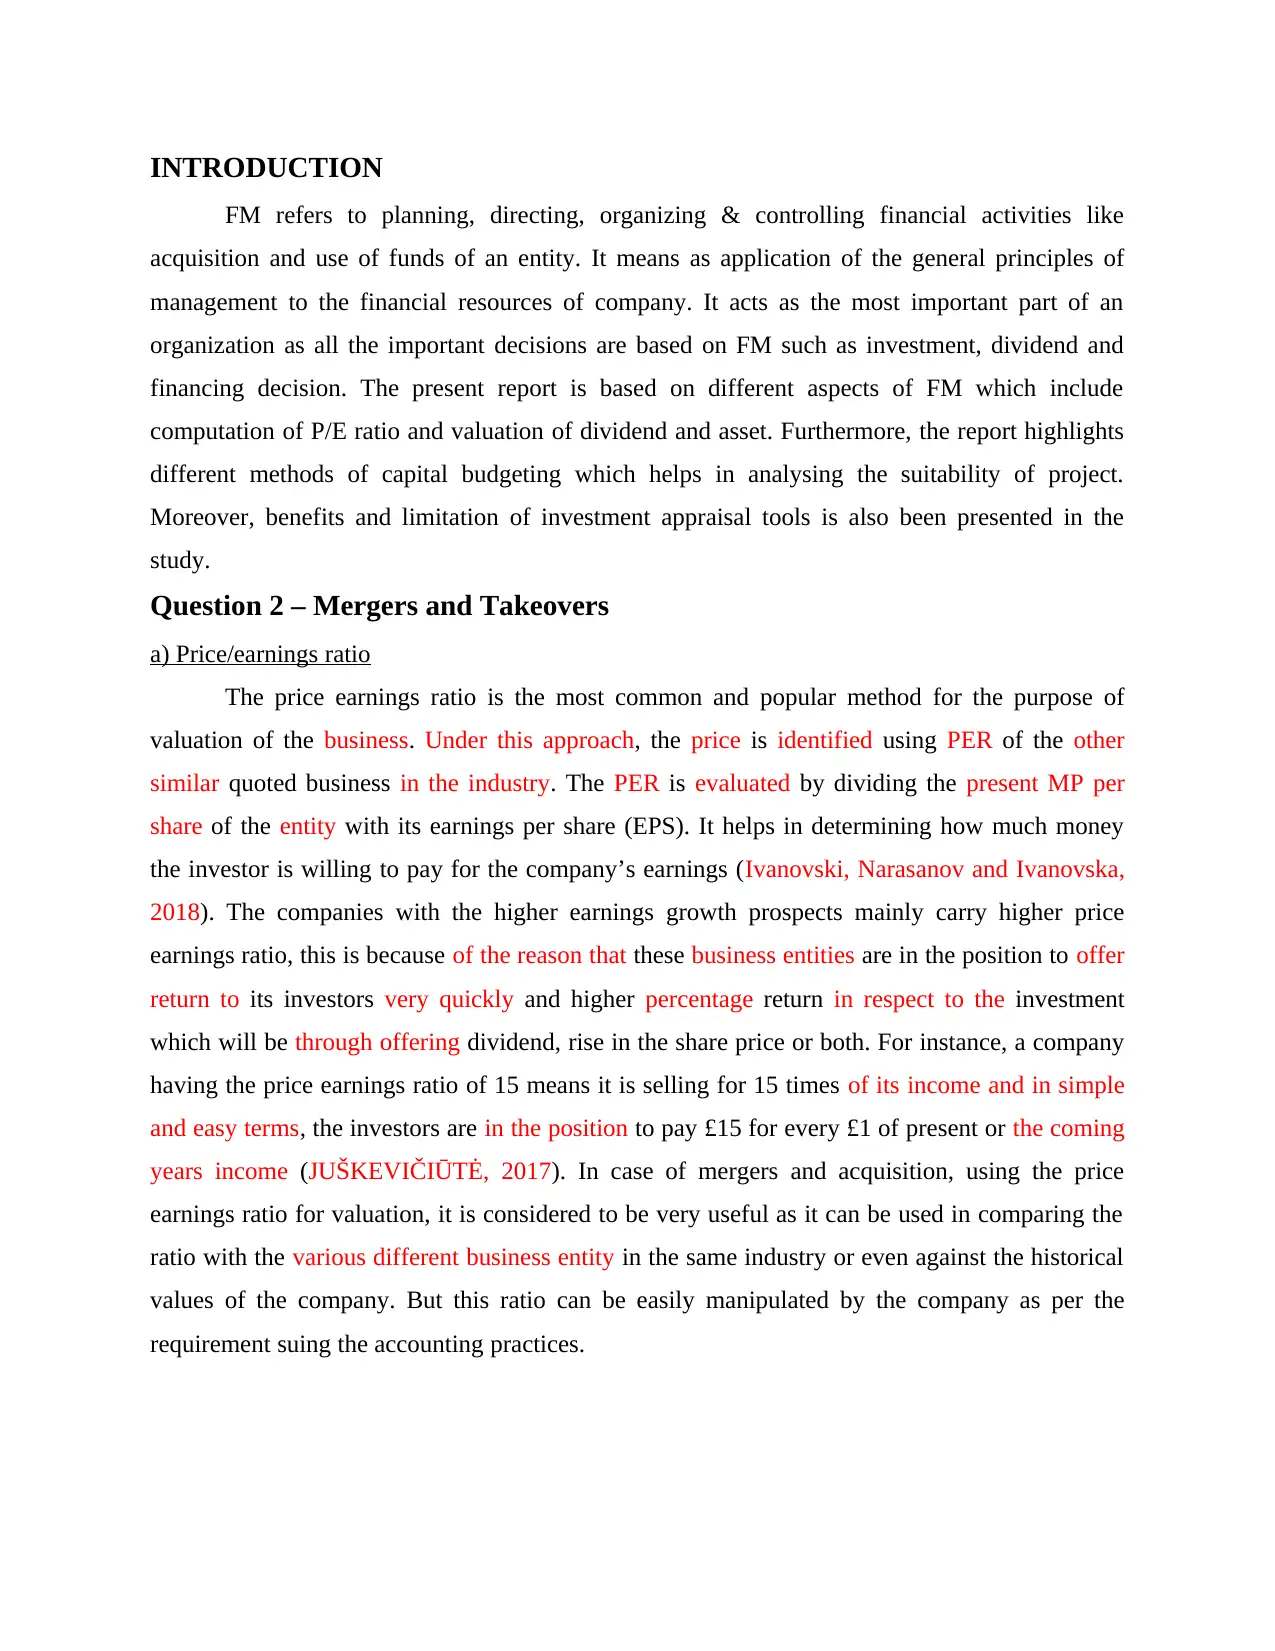
MPS £3.89
EPS £0.21
P/E ratio of Aztec (A) 18.52
Distributable earnings £40.4
number of shares 147
EPS of trojan (B) £0.27
Value per share of Trojan (A * B) £5.0004
Total market value £735.06
Statement showing valuation using price earnings ratio
As per the given case, the value of Trojan plc is £735.06 which is derived using the price
earning ratio. The market value is calculated by multiplying the number of shares with the per
share value of the Trojan plc.
b) Dividend valuation method
Under this valuation method, the dividend amount and the value of the stock is assumed
to be growing at the constant rate or in simple words, the dividend paid by the company will
grow at the constant percentage. This valuation method is mainly appropriate for the businesses
which increases their dividend by a fixed percentage every year. This method is very simple to
apply and is mainly suitable for the businesses with the stable growth along with the established
dividend pay-out ratios (Blanken, 2019). Investors can compare the businesses against the other
industries with the help of this model. Using this model, requires current dividend paid, the
expected rate of return and the growth rate. It actually establishes the relationship with these
three. Other than the above stated assumption, there are other assumptions as well, that is,
company’s growth is constant, financial leverage remains the same and the company’s free cash
flow is paid as the dividend.
Paraphrase This Document
Need a fresh take? Get an instant paraphrase of this document with our AI Paraphraser
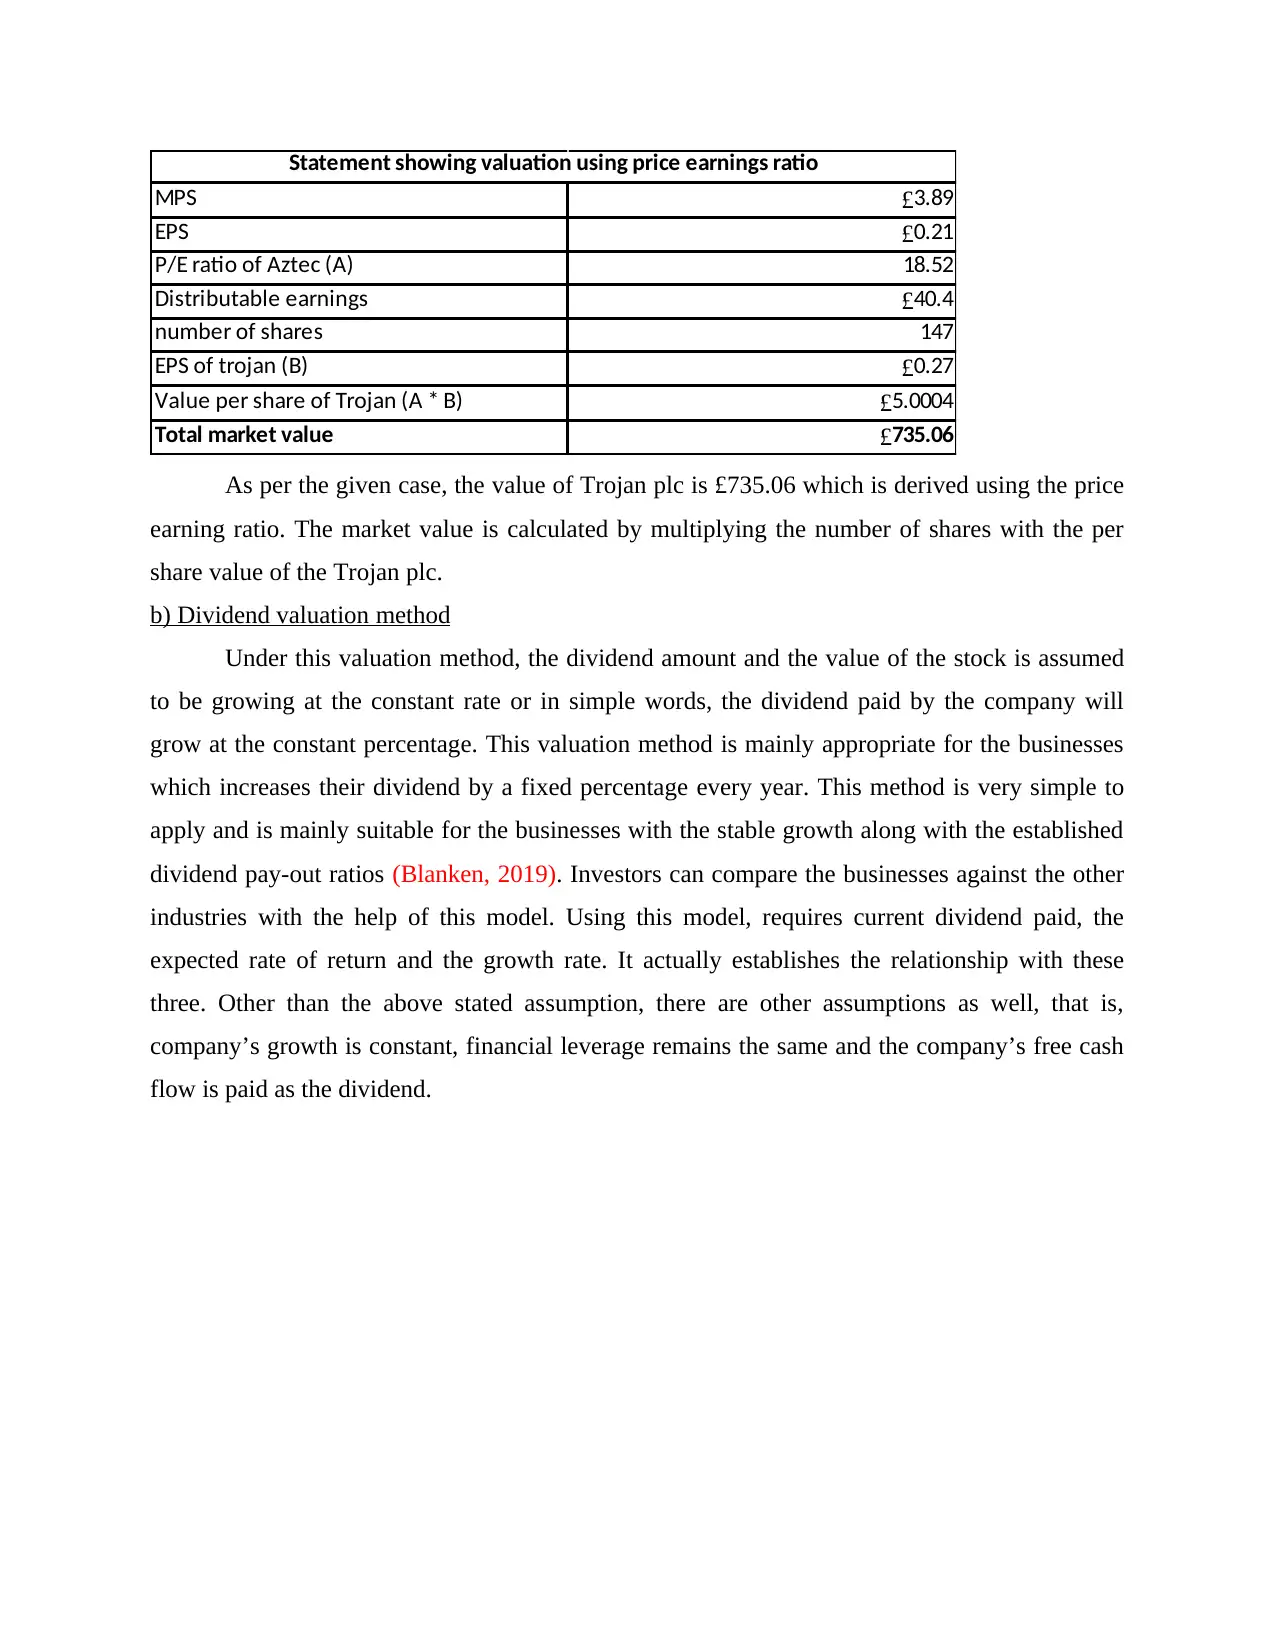
Current dividend (D) £0.13
Risk free rate of return (Rf) 5%
Return on the market (Rm) 11%
Beta (ß) 1.10%
As per CAPM, the required rate of return = Rf + (Rm-Rf) *ß
= 5% + (11% -5%) * 1.10%
Required rate of return (K) 5.07%
Growth rate 2%
Market price per share = D*(1+g) / (K-g)
= 0.13 * (1+2%) / (5.07% - 2%)
MPS £4.32
Total market value £635.04
Statement showing valuation using Dividend valuation method
The above statement depicts the valuation of the Trojan plc using dividend valuation
approach. Under this, the expected rate of return is determined using the CAPM formula and
then the dividend growth rate formula is implemented. The value of company under this is less
than the price earnings ratio valuation method.
c) Discounted cash flow method
This method is used for estimating the value of the company which is based in the cash
flows. This technique assists in evaluating the worth of the investment today and based on which
the projections are made in respect to the how much cash the company will generate in the
future. The companies mainly use WACC as the discounting rate. The DCF analysis is suitable
for any situation as the purpose remains the same that is the money invested today with the
expectation of receiving higher amount in the future (DRĂPGOI and et.al, 2016). The main
purpose of using this method is based on the ability of the business in generating and growing its
cash flow for its investors. Under mergers and acquisition, this approach is mainly useful for the
drive of determining the company’s worth by estimating the future cash flows over a certain
period of time. If it is carried out correctly, it is the most valuable method because it is forward
looking and depends less over the past data and is also less influenced by the external factors.
But it is very complex and requires deep understanding.
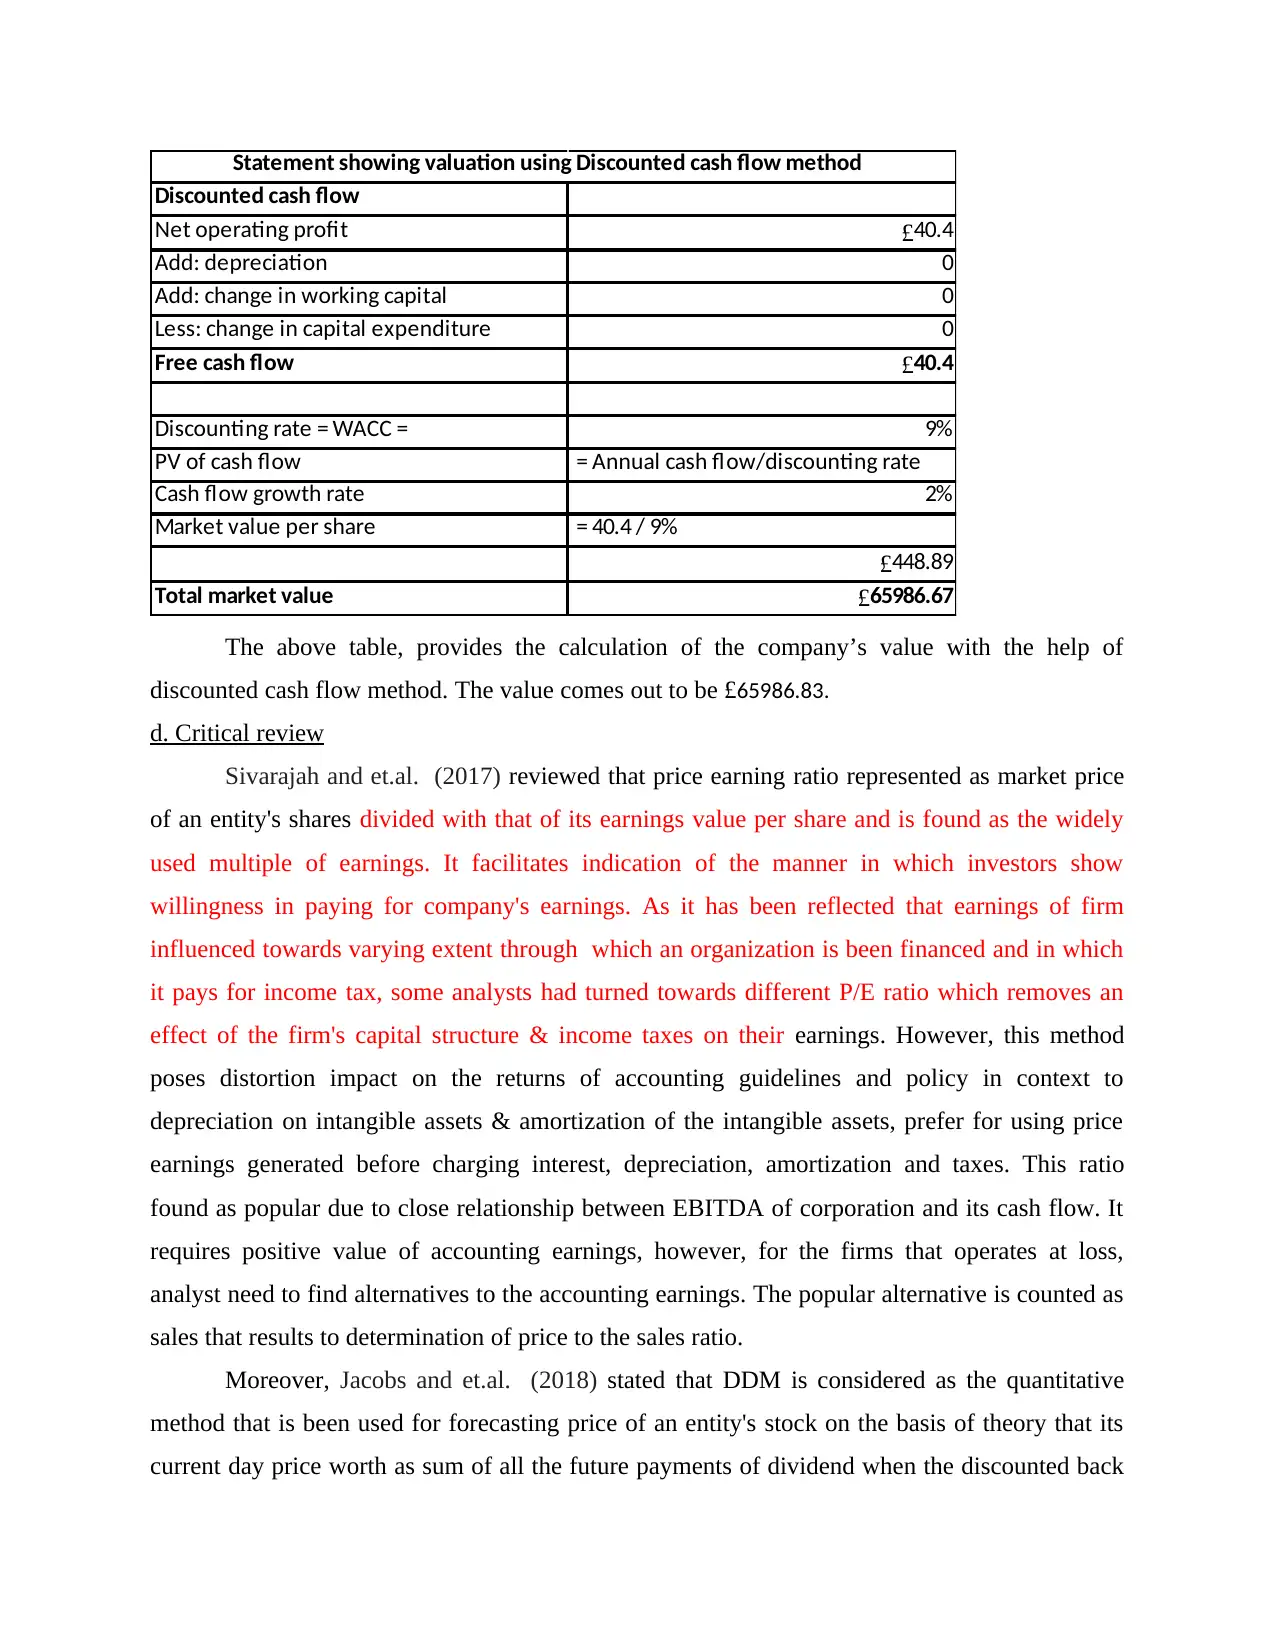
Discounted cash flow
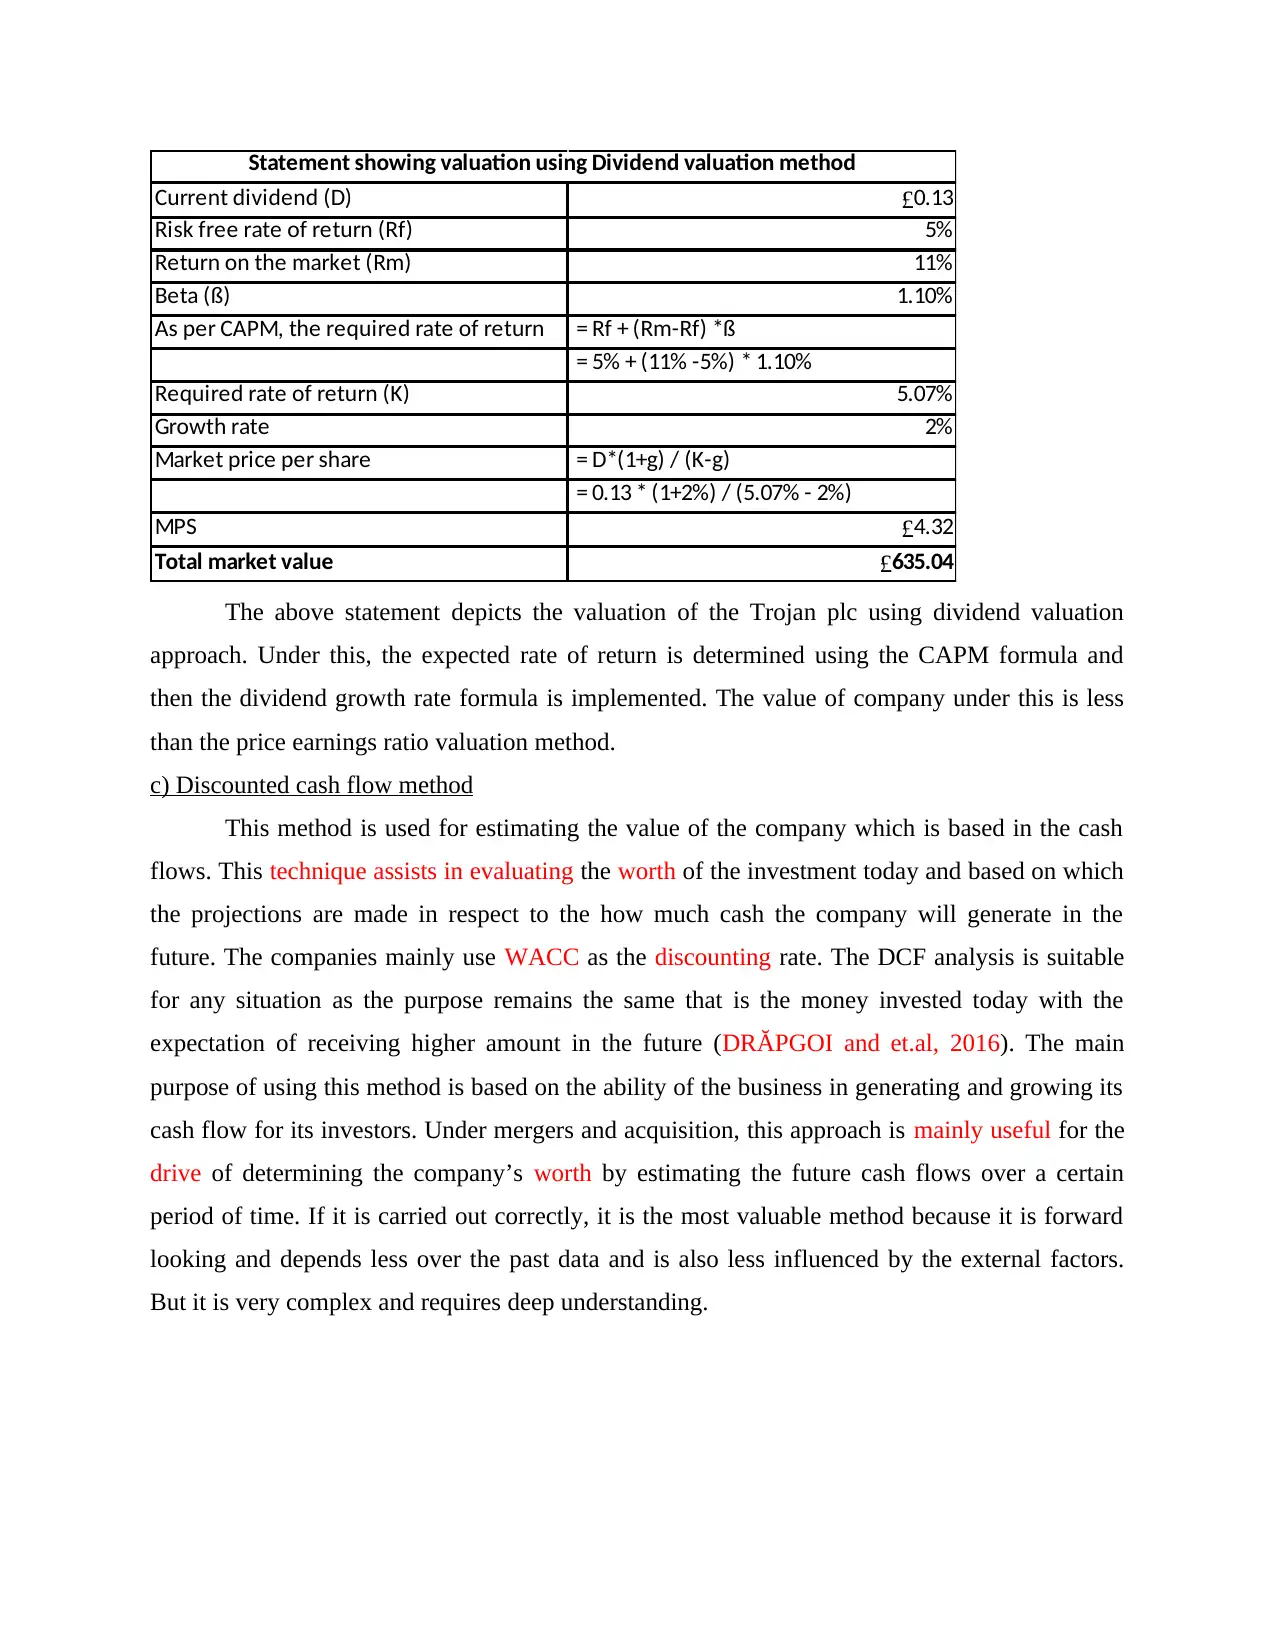
Net operating profit £40.4
Add: depreciation 0
Add: change in working capital 0
Less: change in capital expenditure 0
Free cash flow £40.4
Discounting rate = WACC = 9%
PV of cash flow = Annual cash flow/discounting rate
Cash flow growth rate 2%
Market value per share = 40.4 / 9%
£448.89
Total market value £65986.67
Statement showing valuation using Discounted cash flow method
The above table, provides the calculation of the company’s value with the help of
discounted cash flow method. The value comes out to be £65986.83.
d. Critical review
Sivarajah and et.al. (2017) reviewed that price earning ratio represented as market price
of an entity's shares divided with that of its earnings value per share and is found as the widely
used multiple of earnings. It facilitates indication of the manner in which investors show
willingness in paying for company's earnings. As it has been reflected that earnings of firm
influenced towards varying extent through which an organization is been financed and in which
it pays for income tax, some analysts had turned towards different P/E ratio which removes an
effect of the firm's capital structure & income taxes on their earnings. However, this method
poses distortion impact on the returns of accounting guidelines and policy in context to
depreciation on intangible assets & amortization of the intangible assets, prefer for using price
earnings generated before charging interest, depreciation, amortization and taxes. This ratio
found as popular due to close relationship between EBITDA of corporation and its cash flow. It
requires positive value of accounting earnings, however, for the firms that operates at loss,
analyst need to find alternatives to the accounting earnings. The popular alternative is counted as
sales that results to determination of price to the sales ratio.
Moreover, Jacobs and et.al. (2018) stated that DDM is considered as the quantitative
method that is been used for forecasting price of an entity's stock on the basis of theory that its
current day price worth as sum of all the future payments of dividend when the discounted back
⊘ This is a preview!⊘
Do you want full access?
Subscribe today to unlock all pages.
Trusted by 1+ million students worldwide
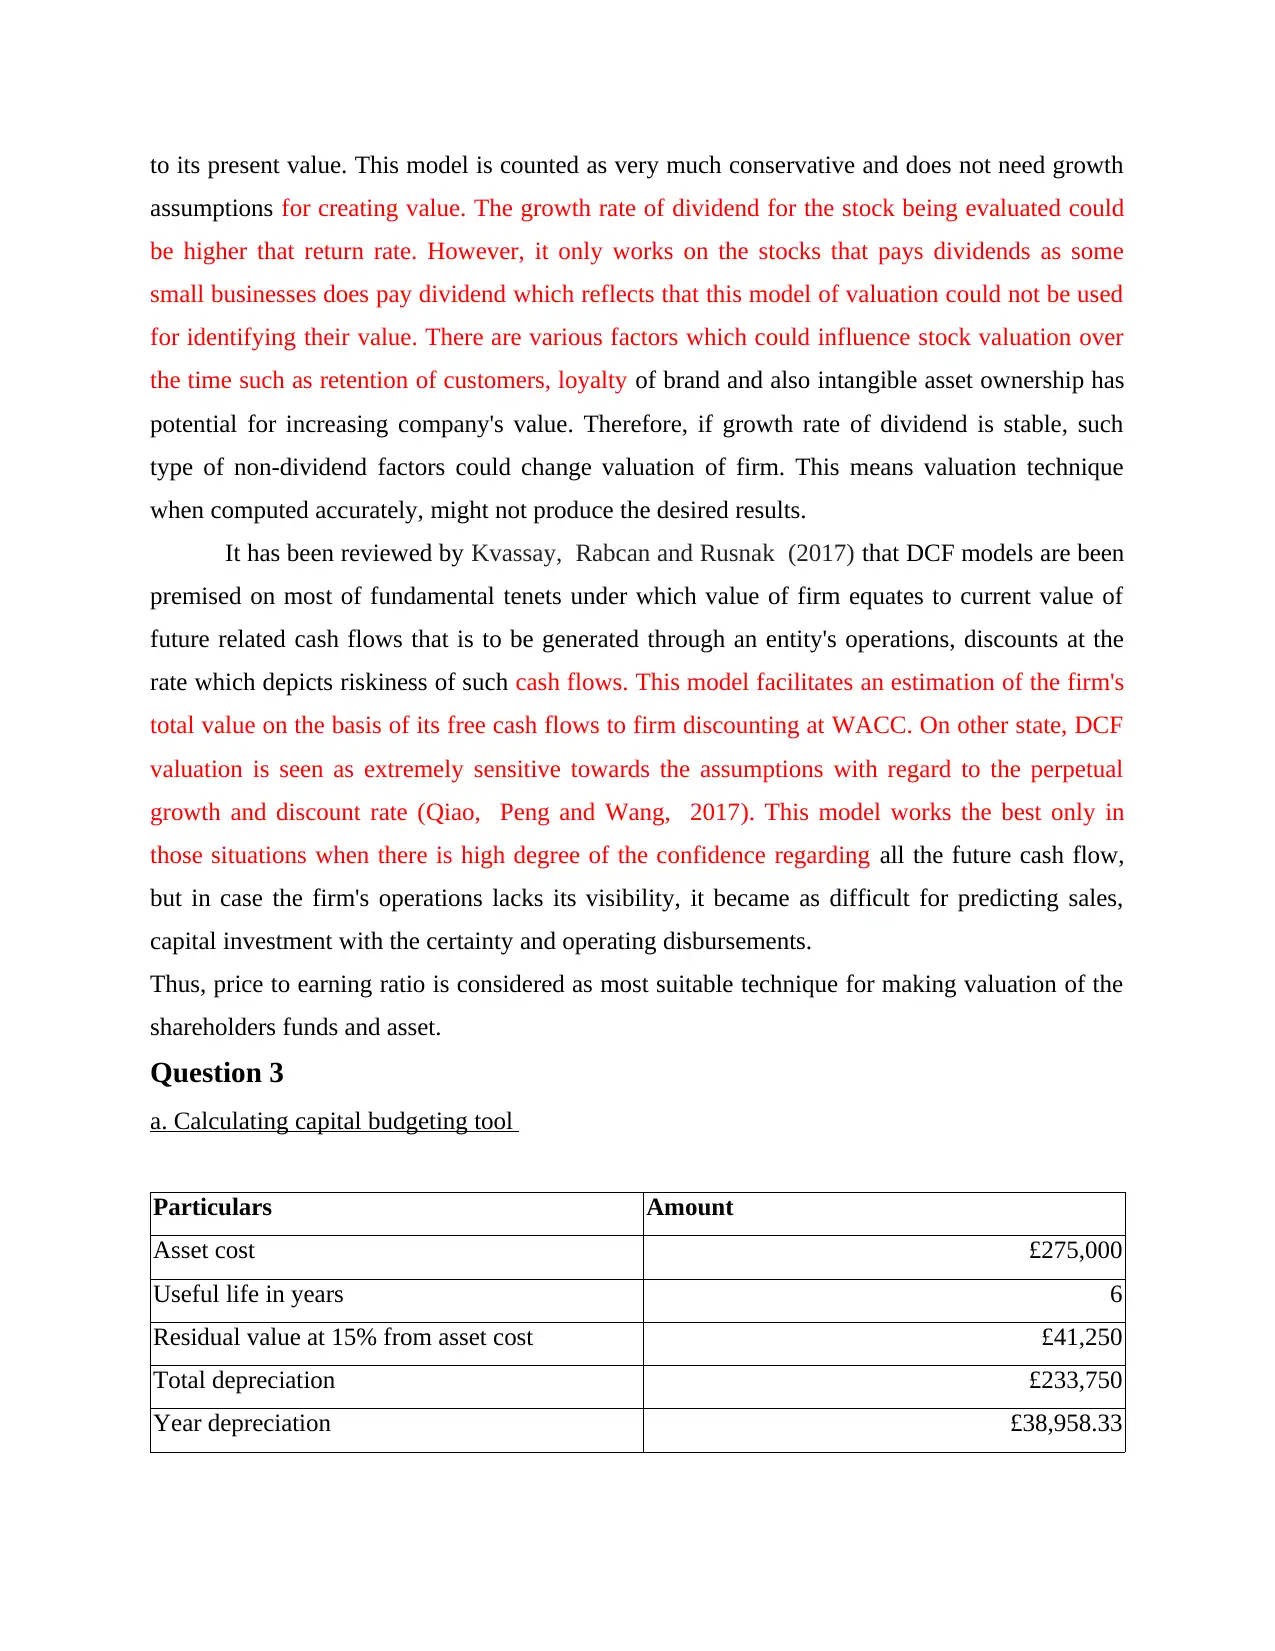
to its present value. This model is counted as very much conservative and does not need growth
assumptions for creating value. The growth rate of dividend for the stock being evaluated could
be higher that return rate. However, it only works on the stocks that pays dividends as some
small businesses does pay dividend which reflects that this model of valuation could not be used
for identifying their value. There are various factors which could influence stock valuation over
the time such as retention of customers, loyalty of brand and also intangible asset ownership has
potential for increasing company's value. Therefore, if growth rate of dividend is stable, such
type of non-dividend factors could change valuation of firm. This means valuation technique
when computed accurately, might not produce the desired results.
It has been reviewed by Kvassay, Rabcan and Rusnak (2017) that DCF models are been
premised on most of fundamental tenets under which value of firm equates to current value of
future related cash flows that is to be generated through an entity's operations, discounts at the
rate which depicts riskiness of such cash flows. This model facilitates an estimation of the firm's
total value on the basis of its free cash flows to firm discounting at WACC. On other state, DCF
valuation is seen as extremely sensitive towards the assumptions with regard to the perpetual
growth and discount rate (Qiao, Peng and Wang, 2017). This model works the best only in
those situations when there is high degree of the confidence regarding all the future cash flow,
but in case the firm's operations lacks its visibility, it became as difficult for predicting sales,
capital investment with the certainty and operating disbursements.
Thus, price to earning ratio is considered as most suitable technique for making valuation of the
shareholders funds and asset.
Question 3
a. Calculating capital budgeting tool
Particulars Amount
Asset cost £275,000
Useful life in years 6
Residual value at 15% from asset cost £41,250
Total depreciation £233,750
Year depreciation £38,958.33
Paraphrase This Document
Need a fresh take? Get an instant paraphrase of this document with our AI Paraphraser
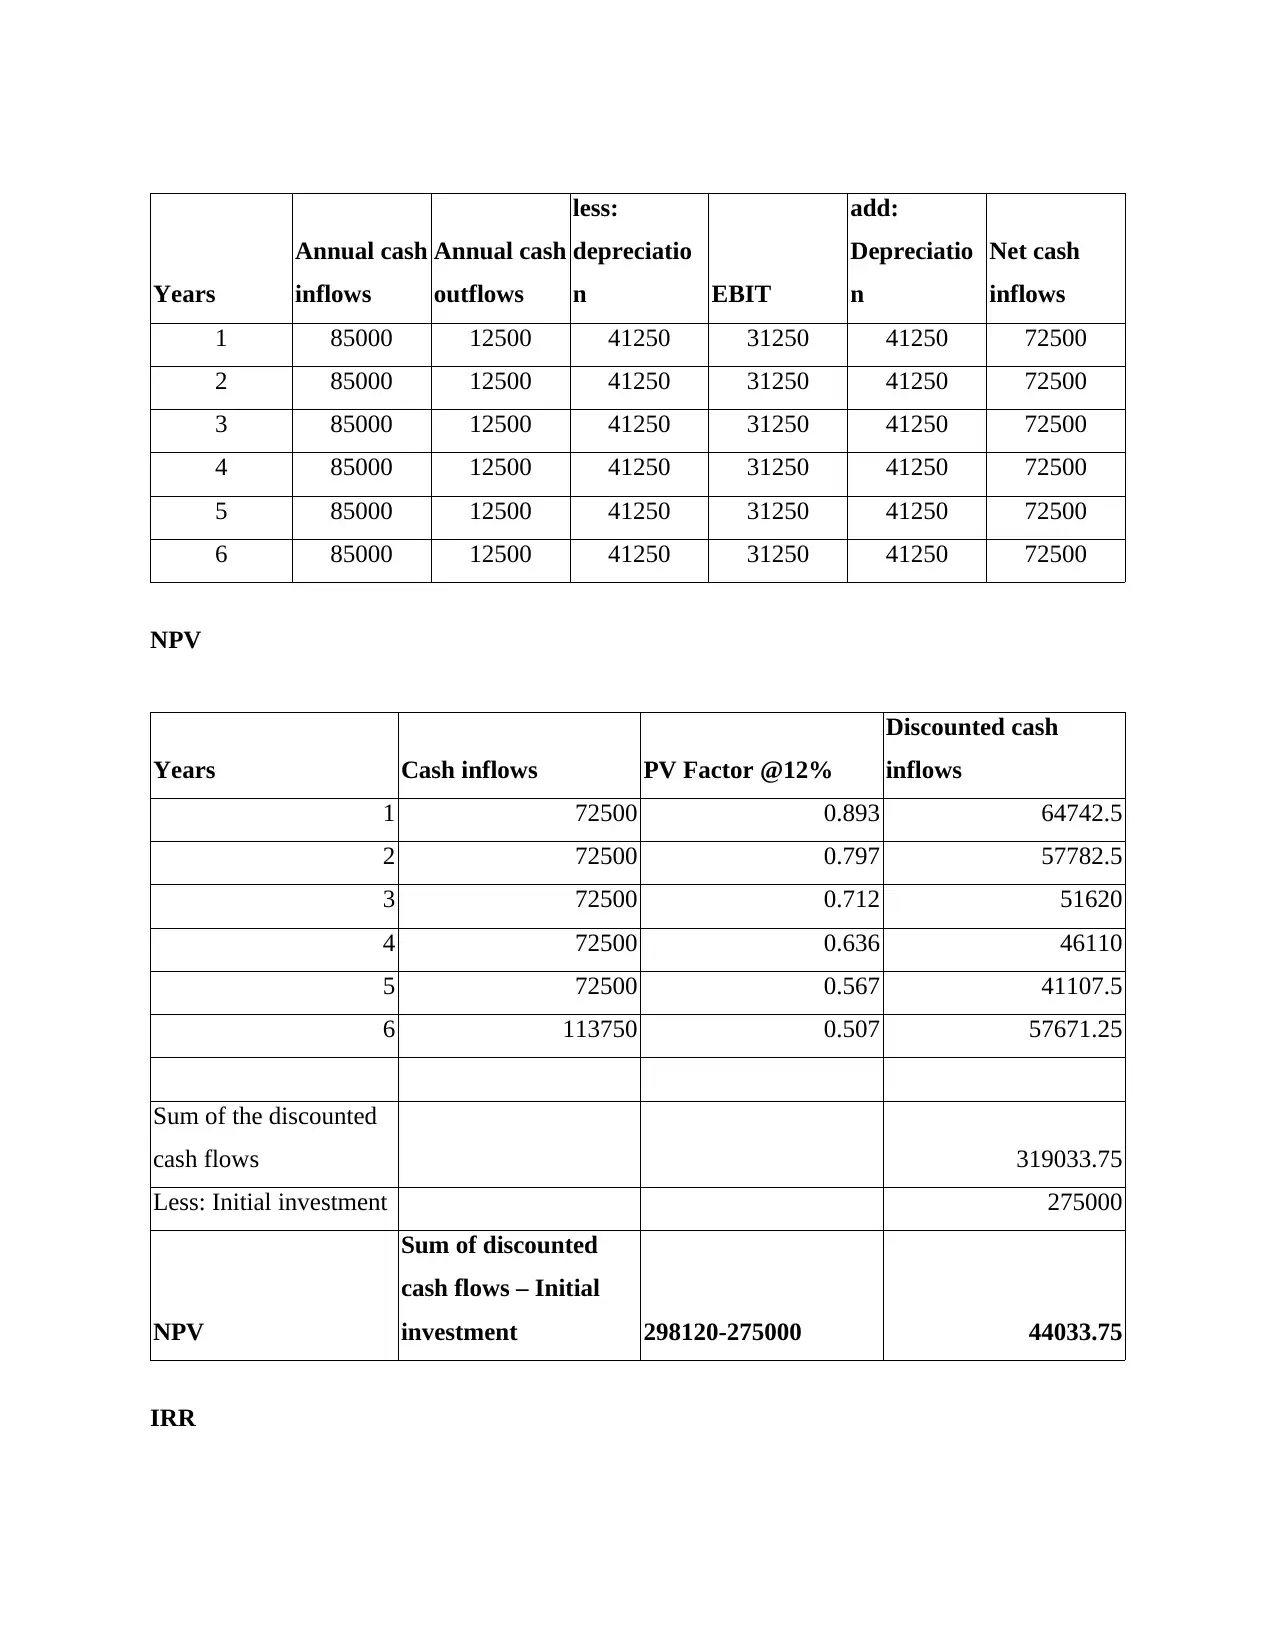
Years
Annual cash
inflows
Annual cash
outflows
less:
depreciatio
n EBIT
add:
Depreciatio
n
Net cash
inflows
1 85000 12500 41250 31250 41250 72500
2 85000 12500 41250 31250 41250 72500
3 85000 12500 41250 31250 41250 72500
4 85000 12500 41250 31250 41250 72500
5 85000 12500 41250 31250 41250 72500
6 85000 12500 41250 31250 41250 72500
NPV
Years Cash inflows PV Factor @12%
Discounted cash
inflows
1 72500 0.893 64742.5
2 72500 0.797 57782.5
3 72500 0.712 51620
4 72500 0.636 46110
5 72500 0.567 41107.5
6 113750 0.507 57671.25
Sum of the discounted
cash flows 319033.75
Less: Initial investment 275000
NPV
Sum of discounted
cash flows – Initial
investment 298120-275000 44033.75
IRR
Annual cash
inflows
Annual cash
outflows
less:
depreciatio
n EBIT
add:
Depreciatio
n
Net cash
inflows
1 85000 12500 41250 31250 41250 72500
2 85000 12500 41250 31250 41250 72500
3 85000 12500 41250 31250 41250 72500
4 85000 12500 41250 31250 41250 72500
5 85000 12500 41250 31250 41250 72500
6 85000 12500 41250 31250 41250 72500
NPV
Years Cash inflows PV Factor @12%
Discounted cash
inflows
1 72500 0.893 64742.5
2 72500 0.797 57782.5
3 72500 0.712 51620
4 72500 0.636 46110
5 72500 0.567 41107.5
6 113750 0.507 57671.25
Sum of the discounted
cash flows 319033.75
Less: Initial investment 275000
NPV
Sum of discounted
cash flows – Initial
investment 298120-275000 44033.75
IRR
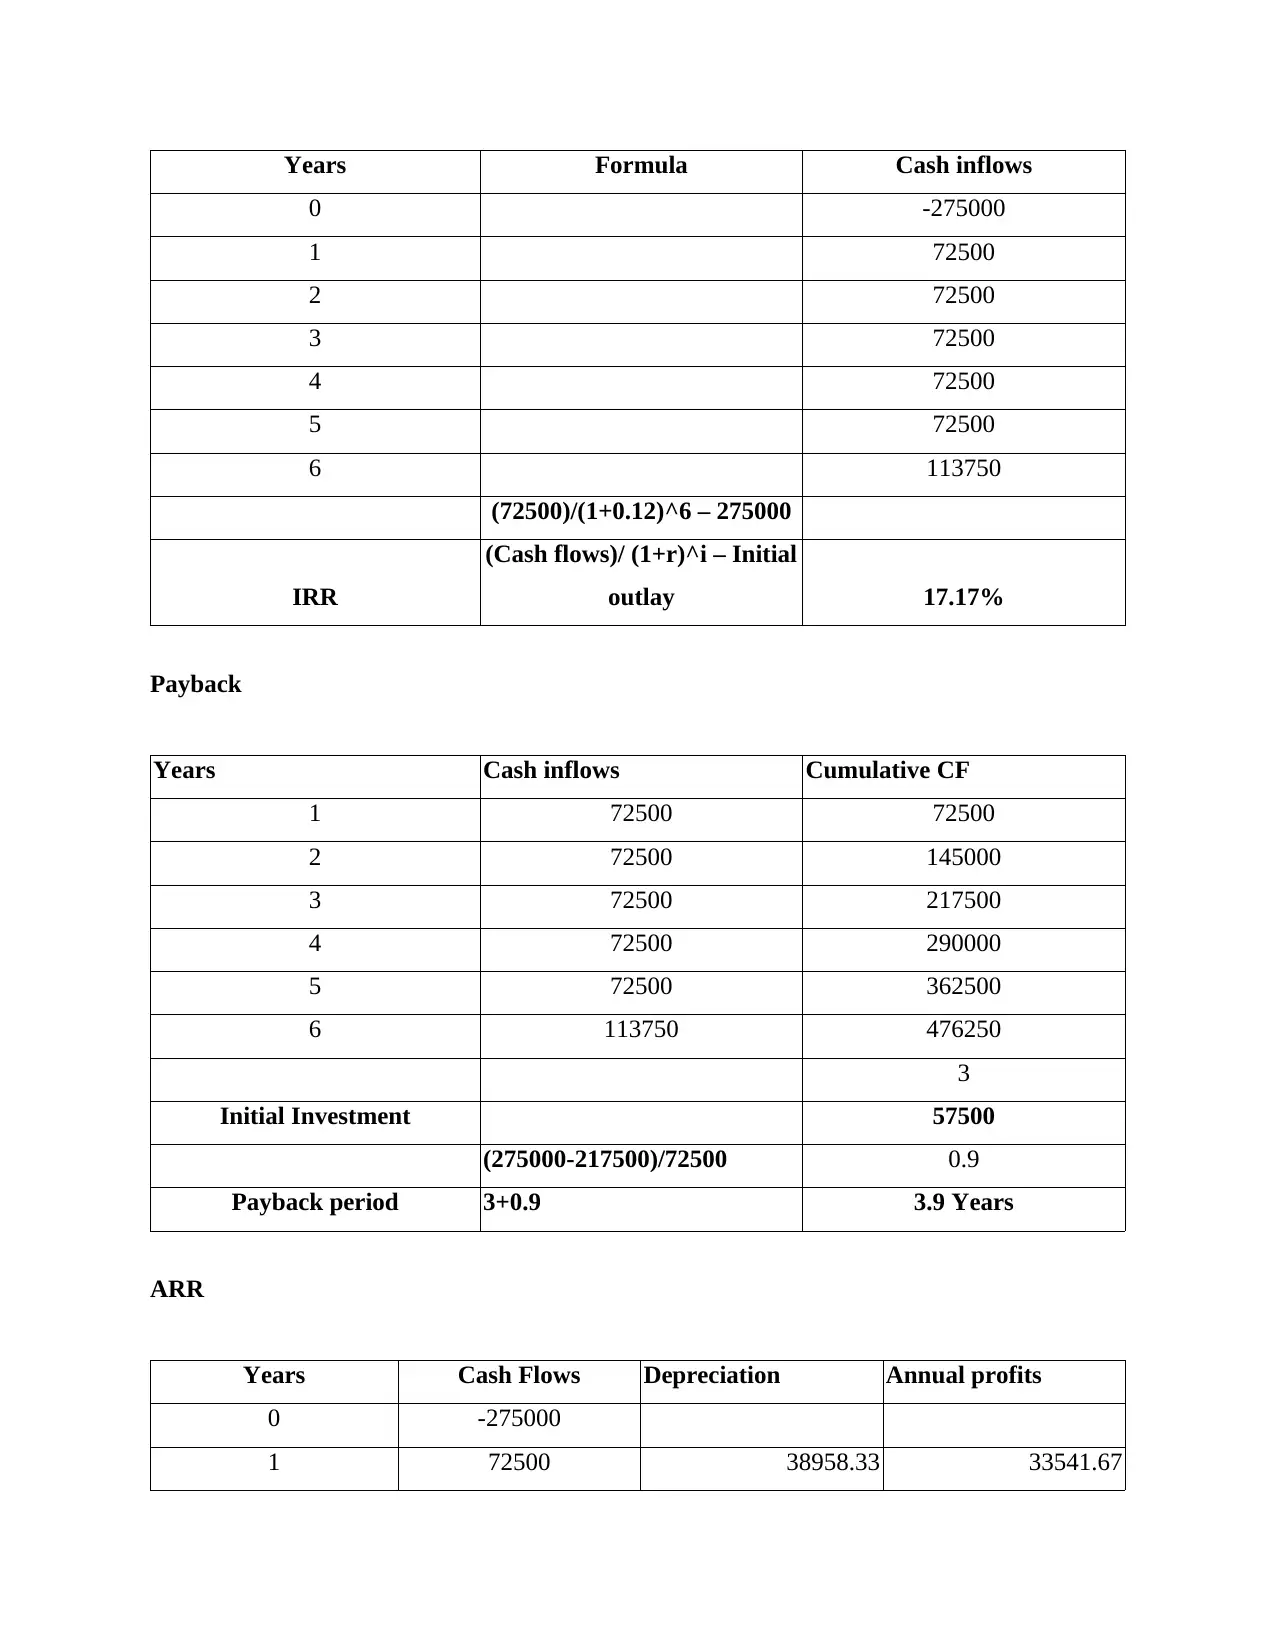
Years Formula Cash inflows
0 -275000
1 72500
2 72500
3 72500
4 72500
5 72500
6 113750
(72500)/(1+0.12)^6 – 275000
IRR
(Cash flows)/ (1+r)^i – Initial
outlay 17.17%
Payback
Years Cash inflows Cumulative CF
1 72500 72500
2 72500 145000
3 72500 217500
4 72500 290000
5 72500 362500
6 113750 476250
3
Initial Investment 57500
(275000-217500)/72500 0.9
Payback period 3+0.9 3.9 Years
ARR
Years Cash Flows Depreciation Annual profits
0 -275000
1 72500 38958.33 33541.67
0 -275000
1 72500
2 72500
3 72500
4 72500
5 72500
6 113750
(72500)/(1+0.12)^6 – 275000
IRR
(Cash flows)/ (1+r)^i – Initial
outlay 17.17%
Payback
Years Cash inflows Cumulative CF
1 72500 72500
2 72500 145000
3 72500 217500
4 72500 290000
5 72500 362500
6 113750 476250
3
Initial Investment 57500
(275000-217500)/72500 0.9
Payback period 3+0.9 3.9 Years
ARR
Years Cash Flows Depreciation Annual profits
0 -275000
1 72500 38958.33 33541.67
⊘ This is a preview!⊘
Do you want full access?
Subscribe today to unlock all pages.
Trusted by 1+ million students worldwide
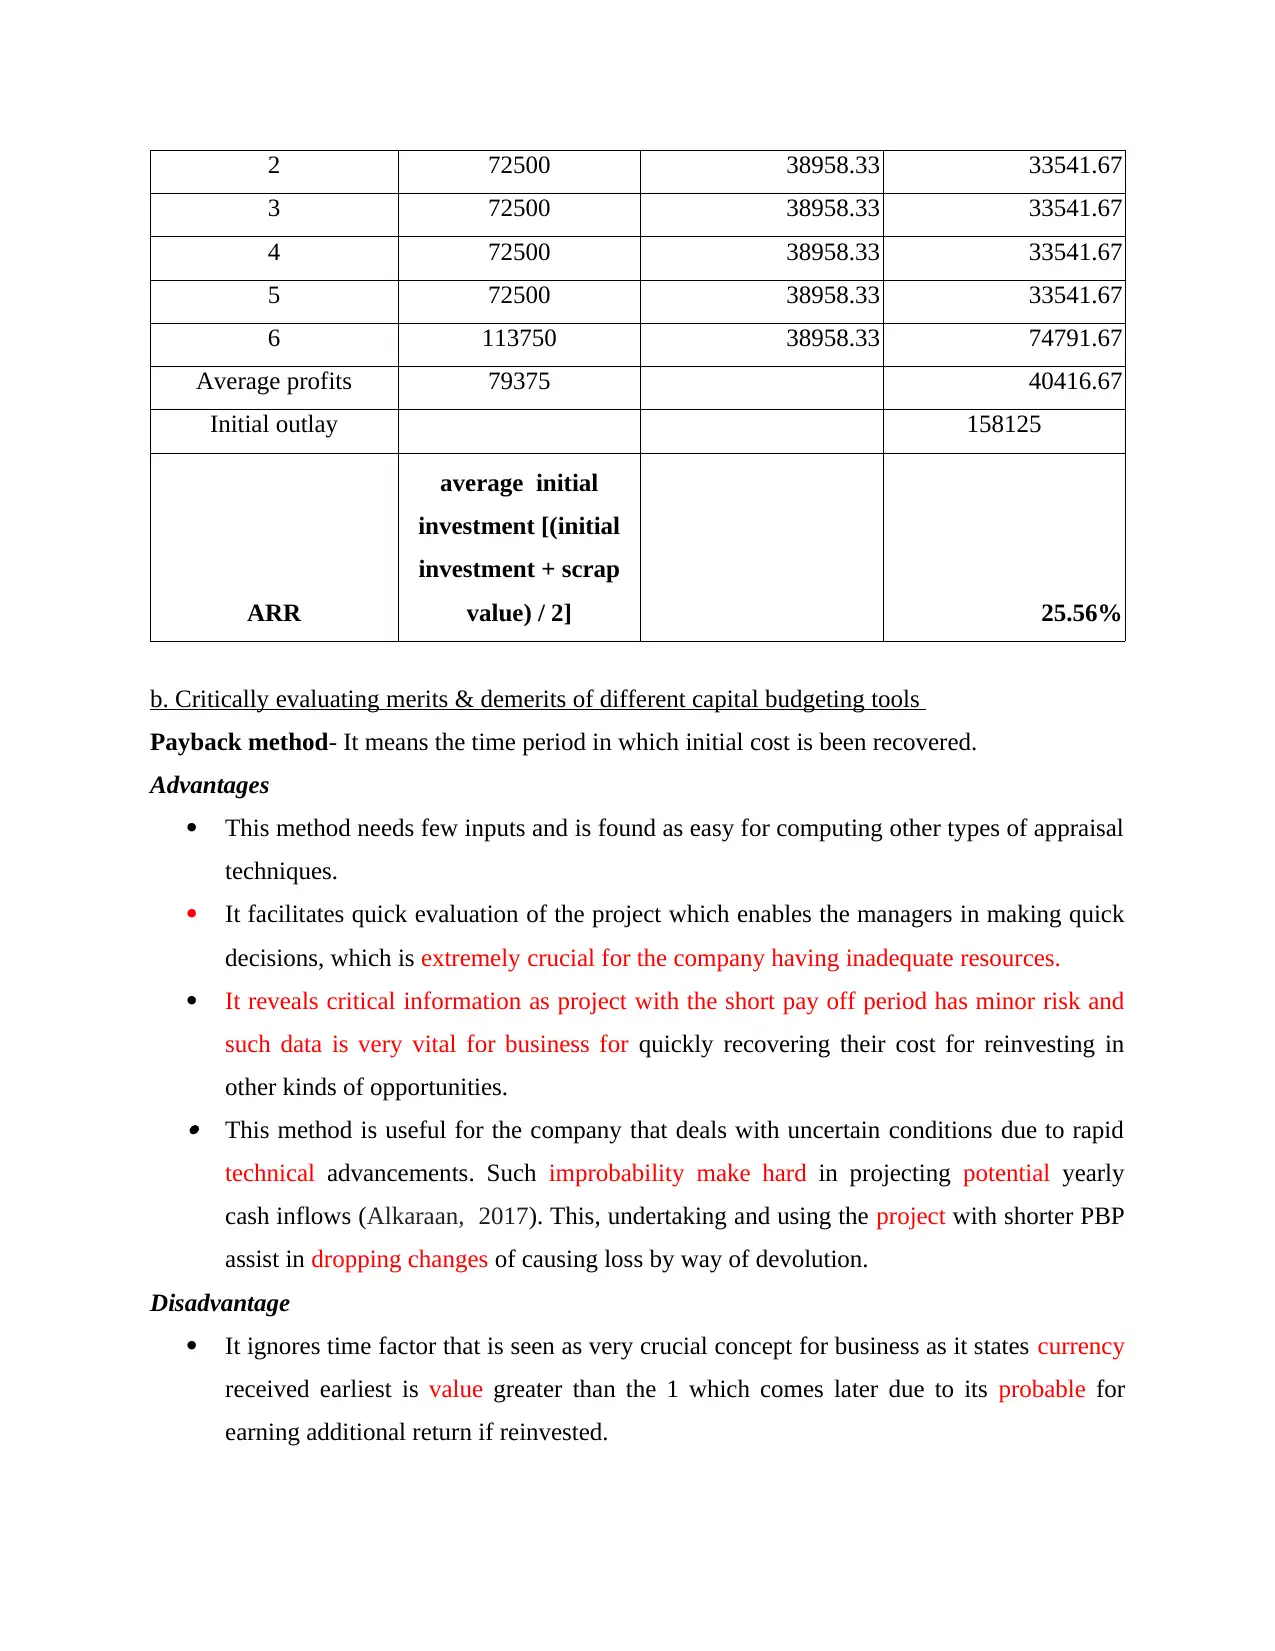
2 72500 38958.33 33541.67
3 72500 38958.33 33541.67
4 72500 38958.33 33541.67
5 72500 38958.33 33541.67
6 113750 38958.33 74791.67
Average profits 79375 40416.67
Initial outlay 158125
ARR
average initial
investment [(initial
investment + scrap
value) / 2] 25.56%
b. Critically evaluating merits & demerits of different capital budgeting tools
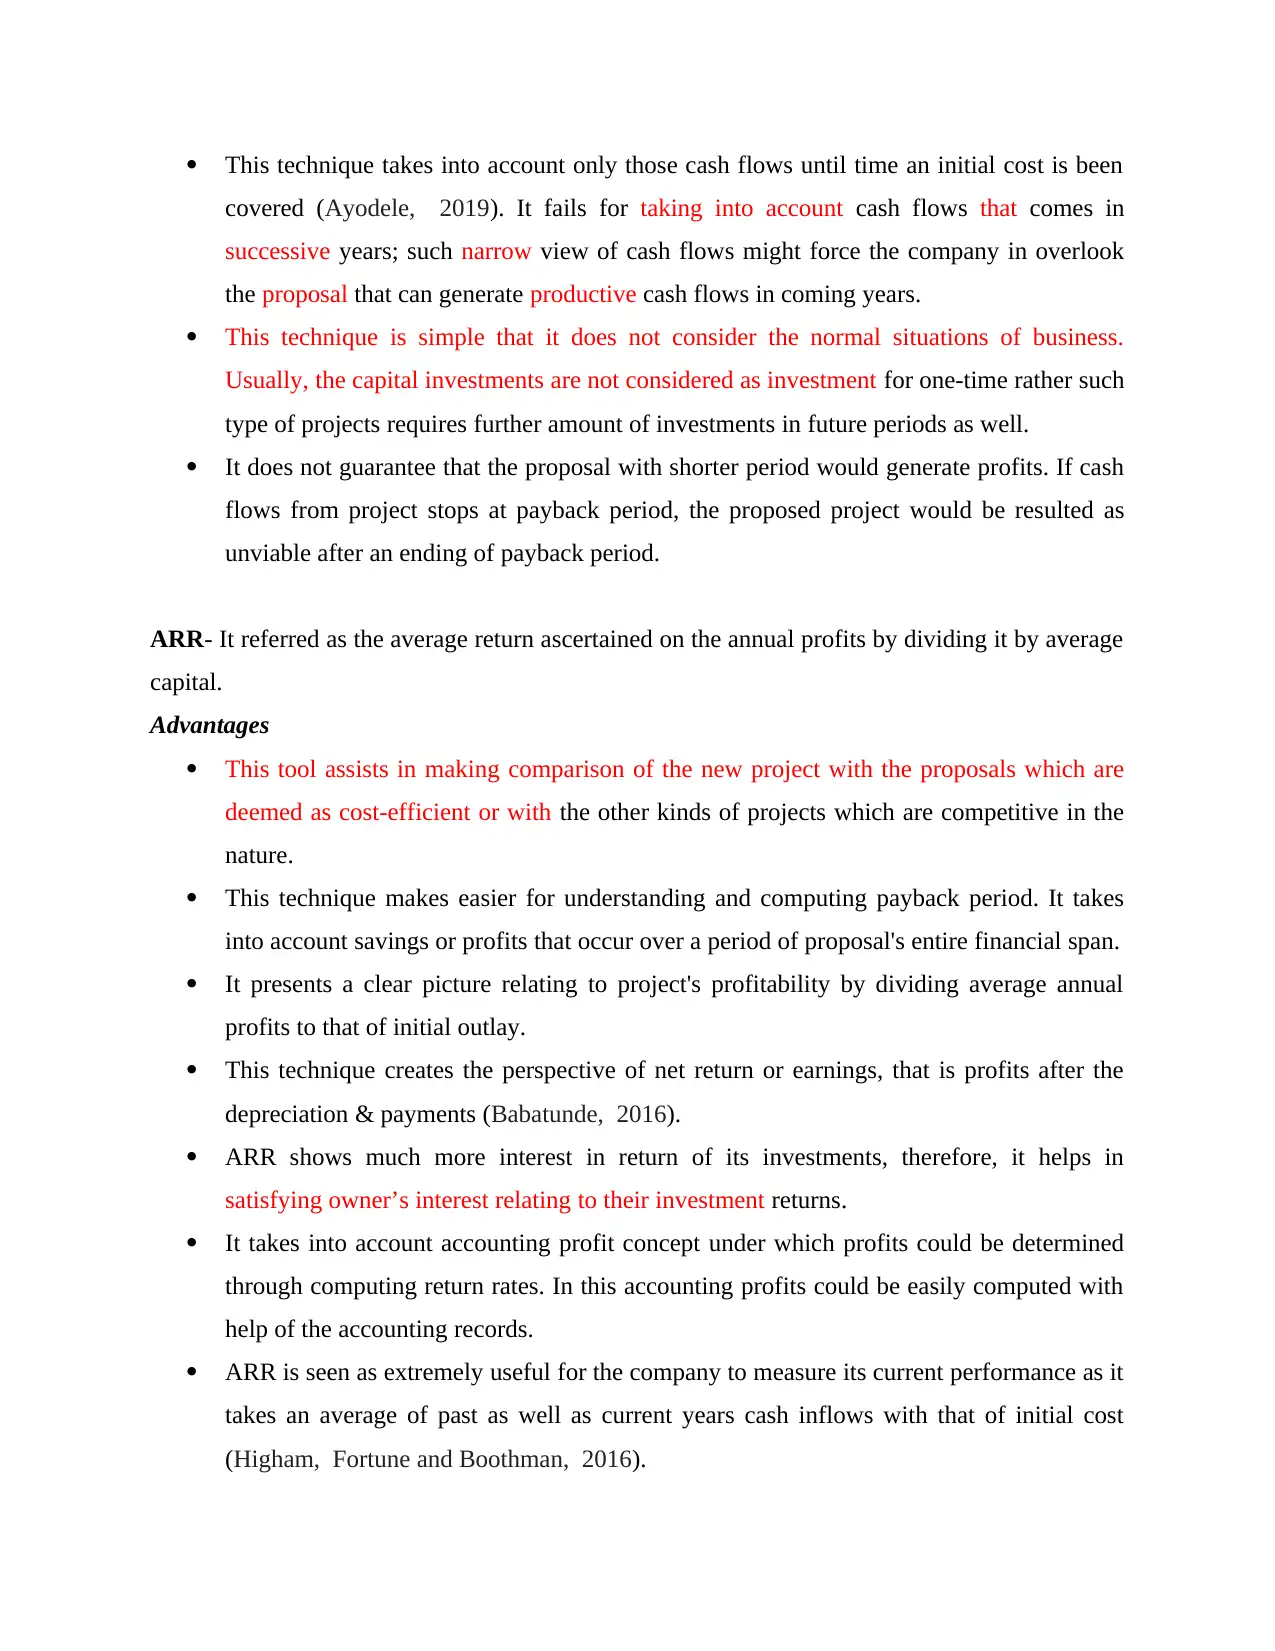
Payback method- It means the time period in which initial cost is been recovered.
Advantages
This method needs few inputs and is found as easy for computing other types of appraisal
techniques.
It facilitates quick evaluation of the project which enables the managers in making quick
decisions, which is extremely crucial for the company having inadequate resources.
It reveals critical information as project with the short pay off period has minor risk and
such data is very vital for business for quickly recovering their cost for reinvesting in
other kinds of opportunities. This method is useful for the company that deals with uncertain conditions due to rapid
technical advancements. Such improbability make hard in projecting potential yearly
cash inflows (Alkaraan, 2017). This, undertaking and using the project with shorter PBP
assist in dropping changes of causing loss by way of devolution.
Disadvantage
It ignores time factor that is seen as very crucial concept for business as it states currency
received earliest is value greater than the 1 which comes later due to its probable for
earning additional return if reinvested.
3 72500 38958.33 33541.67
4 72500 38958.33 33541.67
5 72500 38958.33 33541.67
6 113750 38958.33 74791.67
Average profits 79375 40416.67
Initial outlay 158125
ARR
average initial
investment [(initial
investment + scrap
value) / 2] 25.56%
b. Critically evaluating merits & demerits of different capital budgeting tools
Payback method- It means the time period in which initial cost is been recovered.
Advantages
This method needs few inputs and is found as easy for computing other types of appraisal
techniques.
It facilitates quick evaluation of the project which enables the managers in making quick
decisions, which is extremely crucial for the company having inadequate resources.
It reveals critical information as project with the short pay off period has minor risk and
such data is very vital for business for quickly recovering their cost for reinvesting in
other kinds of opportunities. This method is useful for the company that deals with uncertain conditions due to rapid
technical advancements. Such improbability make hard in projecting potential yearly
cash inflows (Alkaraan, 2017). This, undertaking and using the project with shorter PBP
assist in dropping changes of causing loss by way of devolution.
Disadvantage
It ignores time factor that is seen as very crucial concept for business as it states currency
received earliest is value greater than the 1 which comes later due to its probable for
earning additional return if reinvested.
Paraphrase This Document
Need a fresh take? Get an instant paraphrase of this document with our AI Paraphraser
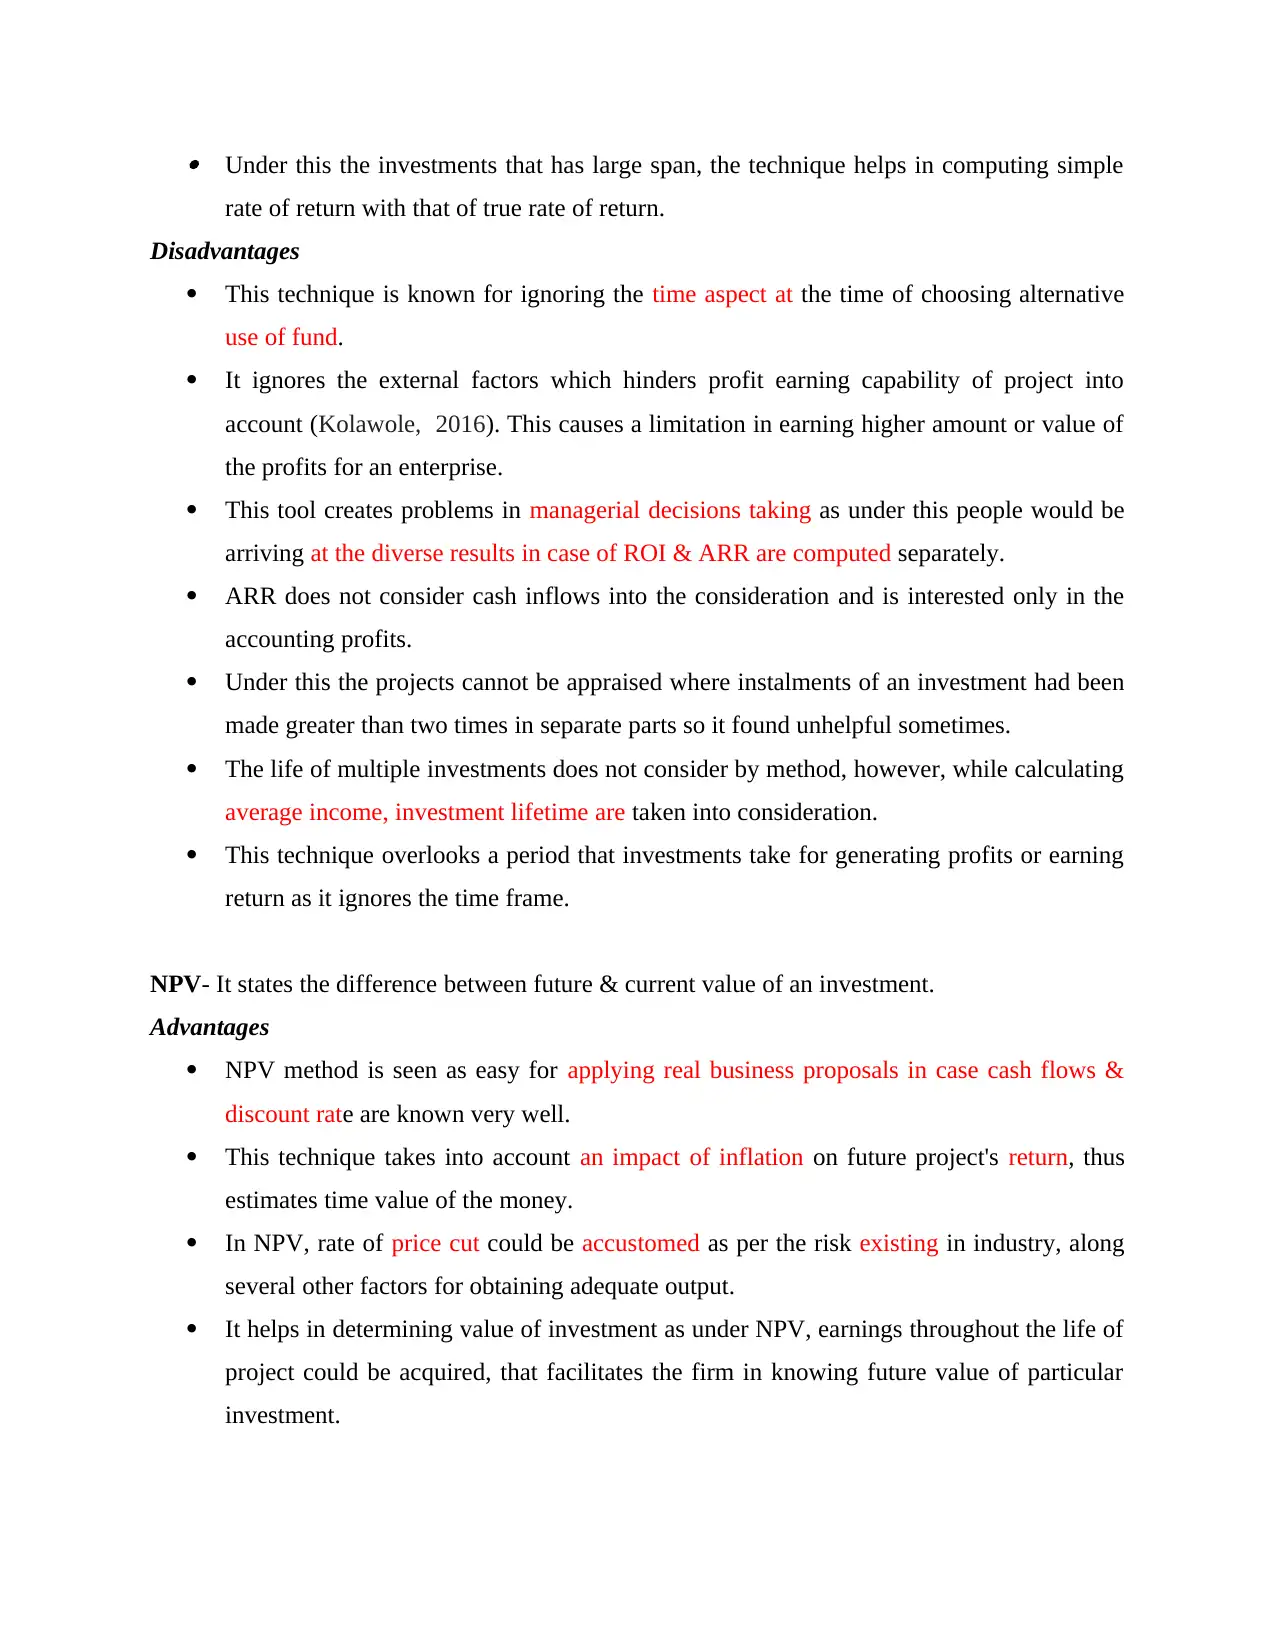
This technique takes into account only those cash flows until time an initial cost is been
covered (Ayodele, 2019). It fails for taking into account cash flows that comes in
successive years; such narrow view of cash flows might force the company in overlook
the proposal that can generate productive cash flows in coming years.
This technique is simple that it does not consider the normal situations of business.
Usually, the capital investments are not considered as investment for one-time rather such
type of projects requires further amount of investments in future periods as well.
It does not guarantee that the proposal with shorter period would generate profits. If cash
flows from project stops at payback period, the proposed project would be resulted as
unviable after an ending of payback period.
ARR- It referred as the average return ascertained on the annual profits by dividing it by average
capital.
Advantages
This tool assists in making comparison of the new project with the proposals which are
deemed as cost-efficient or with the other kinds of projects which are competitive in the
nature.
This technique makes easier for understanding and computing payback period. It takes
into account savings or profits that occur over a period of proposal's entire financial span.
It presents a clear picture relating to project's profitability by dividing average annual
profits to that of initial outlay.
This technique creates the perspective of net return or earnings, that is profits after the
depreciation & payments (Babatunde, 2016).
ARR shows much more interest in return of its investments, therefore, it helps in
satisfying owner’s interest relating to their investment returns.
It takes into account accounting profit concept under which profits could be determined
through computing return rates. In this accounting profits could be easily computed with
help of the accounting records.
ARR is seen as extremely useful for the company to measure its current performance as it
takes an average of past as well as current years cash inflows with that of initial cost
(Higham, Fortune and Boothman, 2016).
Under this the investments that has large span, the technique helps in computing simple
rate of return with that of true rate of return.
Disadvantages
This technique is known for ignoring the time aspect at the time of choosing alternative
use of fund.
It ignores the external factors which hinders profit earning capability of project into
account (Kolawole, 2016). This causes a limitation in earning higher amount or value of
the profits for an enterprise.
This tool creates problems in managerial decisions taking as under this people would be
arriving at the diverse results in case of ROI & ARR are computed separately.
ARR does not consider cash inflows into the consideration and is interested only in the
accounting profits.
Under this the projects cannot be appraised where instalments of an investment had been
made greater than two times in separate parts so it found unhelpful sometimes.
The life of multiple investments does not consider by method, however, while calculating
average income, investment lifetime are taken into consideration.
This technique overlooks a period that investments take for generating profits or earning
return as it ignores the time frame.
NPV- It states the difference between future & current value of an investment.
Advantages
NPV method is seen as easy for applying real business proposals in case cash flows &
discount rate are known very well.
This technique takes into account an impact of inflation on future project's return, thus
estimates time value of the money.
In NPV, rate of price cut could be accustomed as per the risk existing in industry, along
several other factors for obtaining adequate output.
It helps in determining value of investment as under NPV, earnings throughout the life of
project could be acquired, that facilitates the firm in knowing future value of particular
investment.
⊘ This is a preview!⊘
Do you want full access?
Subscribe today to unlock all pages.
Trusted by 1+ million students worldwide
1 out of 15
Related Documents


Your All-in-One AI-Powered Toolkit for Academic Success.
+13062052269
info@desklib.com
Available 24*7 on WhatsApp / Email
![[object Object]](/_next/static/media/star-bottom.7253800d.svg)
Unlock your academic potential
Copyright © 2020–2026 A2Z Services. All Rights Reserved. Developed and managed by ZUCOL.