Financial Performance Analysis: Alam PLC and Chiller Ltd
VerifiedAdded on 2021/02/20
|20
|6630
|64
Report
AI Summary
This financial management report provides a detailed analysis of various aspects of financial performance and decision-making. The report is divided into three parts, each focusing on a different company: Alam PLC, Chiller Ltd, and Crosswell. Part A focuses on Alam PLC, calculating and interpreting various financial ratios for 2018 and 2017, including profitability, liquidity, and gearing ratios. Part B examines Chiller Ltd, calculating break-even points and margins of safety, and critically analyzing the assumptions of the break-even model. Part C explores Crosswell, evaluating the benefits and limitations of different investment appraisal techniques and recommending the best techniques, along with an evaluation of main sources of finance for a capital investment project. The report provides a comprehensive overview of financial analysis and management practices, offering valuable insights into company performance and strategic financial decisions.

Financial Management
Paraphrase This Document
Need a fresh take? Get an instant paraphrase of this document with our AI Paraphraser

Table of Contents
INTRODUCTION...........................................................................................................................1
PART A - ALAM PLC...................................................................................................................1
Ratios calculations related to Alam Plc for year 2018 and 2017:...............................................1
PART B – CHILLER LTD..............................................................................................................9
Break even point and margin of safety calculations for year 2018 and 2017 related to Chiller
Ltd ..............................................................................................................................................9
Critical Analysis of the key assumptions of Break-even Model in present business scenario. 10
PART C: CROSSWELL................................................................................................................10
Benefits and limitations of various investment appraisal techniques and recommendation of
best techniques:.........................................................................................................................10
Evaluation of main sources of finance for utilisation by a company to finance its capital
investment project:....................................................................................................................14
CONCLUSION..............................................................................................................................15
REFERENCES .............................................................................................................................17

⊘ This is a preview!⊘
Do you want full access?
Subscribe today to unlock all pages.
Trusted by 1+ million students worldwide
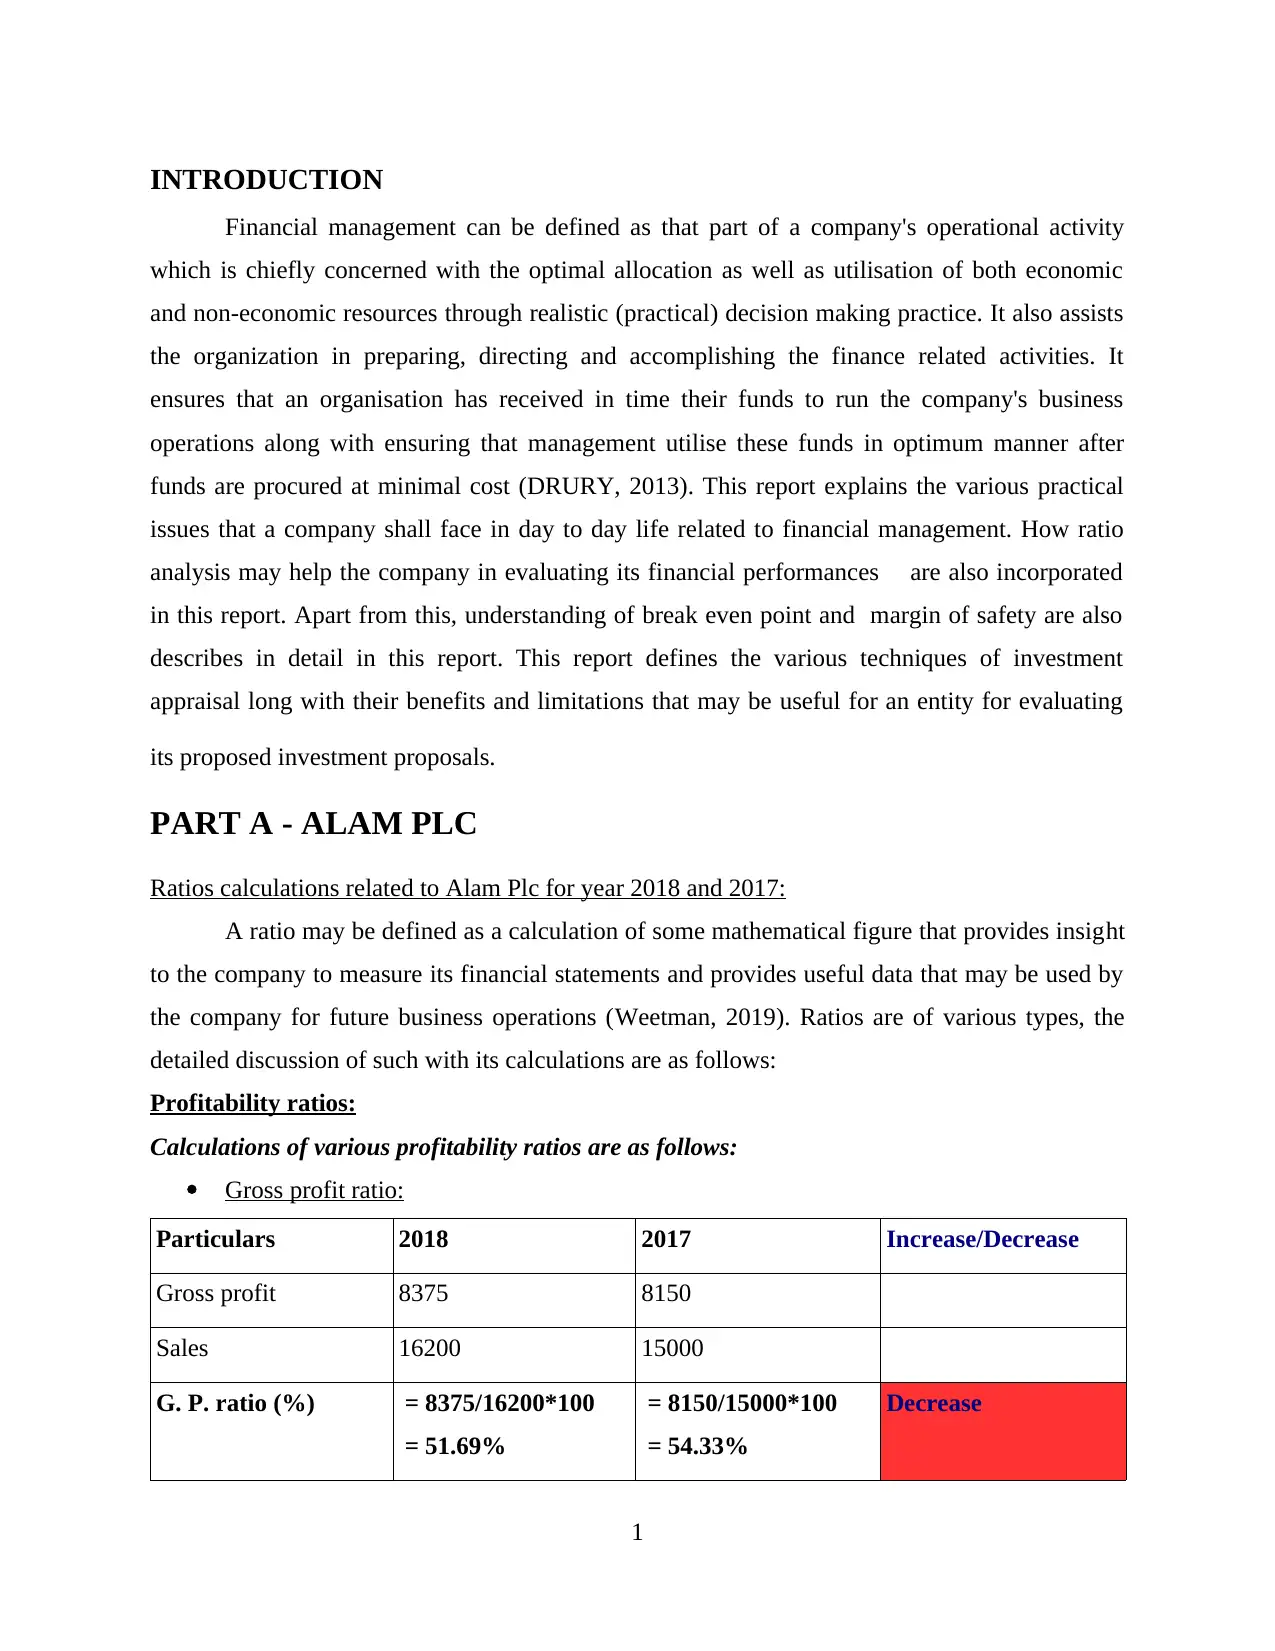
INTRODUCTION
Financial management can be defined as that part of a company's operational activity
which is chiefly concerned with the optimal allocation as well as utilisation of both economic
and non-economic resources through realistic (practical) decision making practice. It also assists
the organization in preparing, directing and accomplishing the finance related activities. It
ensures that an organisation has received in time their funds to run the company's business
operations along with ensuring that management utilise these funds in optimum manner after
funds are procured at minimal cost (DRURY, 2013). This report explains the various practical
issues that a company shall face in day to day life related to financial management. How ratio
analysis may help the company in evaluating its financial performances are also incorporated
in this report. Apart from this, understanding of break even point and margin of safety are also
describes in detail in this report. This report defines the various techniques of investment
appraisal long with their benefits and limitations that may be useful for an entity for evaluating
its proposed investment proposals.
PART A - ALAM PLC
Ratios calculations related to Alam Plc for year 2018 and 2017:
A ratio may be defined as a calculation of some mathematical figure that provides insight
to the company to measure its financial statements and provides useful data that may be used by
the company for future business operations (Weetman, 2019). Ratios are of various types, the
detailed discussion of such with its calculations are as follows:
Profitability ratios:
Calculations of various profitability ratios are as follows:
Gross profit ratio:
Particulars 2018 2017 Increase/Decrease
Gross profit 8375 8150
Sales 16200 15000
G. P. ratio (%) = 8375/16200*100
= 51.69%
= 8150/15000*100
= 54.33%
Decrease
1
Paraphrase This Document
Need a fresh take? Get an instant paraphrase of this document with our AI Paraphraser

Formula: G.P. Ratio = G.P. / Sales*100
Interpretation:
From the above calculations it may be observed that gross profit ratio of Alam Plc has
decreased in current year (51.7 %) as compared to last year which is 54.33 %. Although, there is
not much difference but company shall look into this matter to find the actual reason ( Taylor,
2013). Some of the reasons of such reduced ratio is that profit is not increased as per sales
proportion from last year. So it can be interpreted to board of Alam plc that their gross profit is
not increasing as they should focus on increasing it.
Net profit ratio:
Particulars 2018 2017 Increase/Decrease
Net profit before tax
and interest
1510 2865
Sales 16200 15000
N. P. ratio (%) = 1510/16200*100
= 9.32%
= 2865/15000*100
= 19.10%
Decrease
Formula: N.P. Ratio = N.P. Before tax and interest / Sales*100
Interpretation: From the above calculations related to net profit, it may be evident that such
company has not performing well and not able to control its operating cost. Due to this, its
current year net profit ratio is 4.04% as compared to its last year N.P. Ratio which is 15.5%. The
reason of this is that its net profit decreases as compared to last year. Same as the above gross
profit ratio, the net profit ratio is also decreasing so it be stated to the board of Alam plc that their
net profits are not in ideal condition.
Return on capital employed ratio: Net profit before tax and interest / share capital+ long
term loan x 100
Particulars 2018 2017 Increase/Decrease
Net profit before tax
and interest
1510 2865
share capital+ long 7215+4450 = 11665 5030+4075 = 9105
2
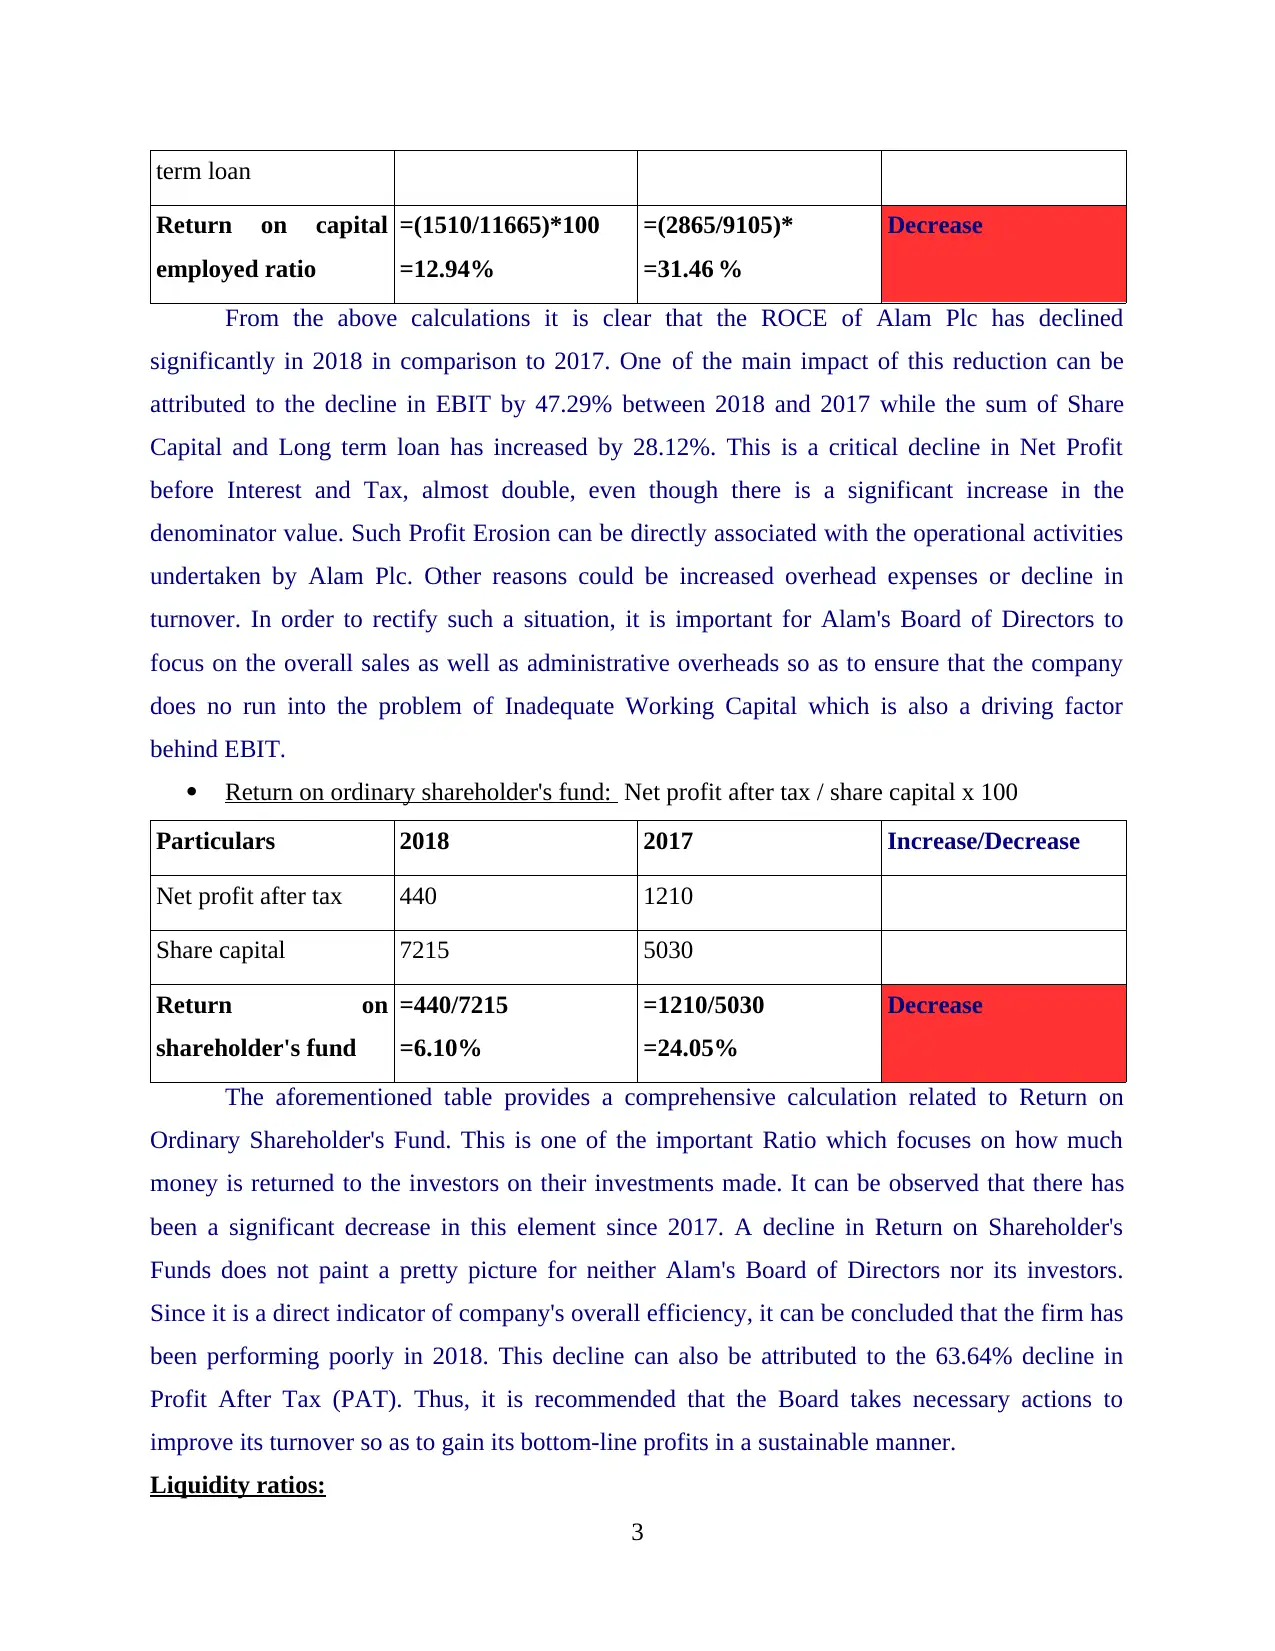
term loan
Return on capital
employed ratio
=(1510/11665)*100
=12.94%
=(2865/9105)*
=31.46 %
Decrease
From the above calculations it is clear that the ROCE of Alam Plc has declined
significantly in 2018 in comparison to 2017. One of the main impact of this reduction can be
attributed to the decline in EBIT by 47.29% between 2018 and 2017 while the sum of Share
Capital and Long term loan has increased by 28.12%. This is a critical decline in Net Profit
before Interest and Tax, almost double, even though there is a significant increase in the
denominator value. Such Profit Erosion can be directly associated with the operational activities
undertaken by Alam Plc. Other reasons could be increased overhead expenses or decline in
turnover. In order to rectify such a situation, it is important for Alam's Board of Directors to
focus on the overall sales as well as administrative overheads so as to ensure that the company
does no run into the problem of Inadequate Working Capital which is also a driving factor
behind EBIT.
Return on ordinary shareholder's fund: Net profit after tax / share capital x 100
Particulars 2018 2017 Increase/Decrease
Net profit after tax 440 1210
Share capital 7215 5030
Return on
shareholder's fund
=440/7215
=6.10%
=1210/5030
=24.05%
Decrease
The aforementioned table provides a comprehensive calculation related to Return on
Ordinary Shareholder's Fund. This is one of the important Ratio which focuses on how much
money is returned to the investors on their investments made. It can be observed that there has
been a significant decrease in this element since 2017. A decline in Return on Shareholder's
Funds does not paint a pretty picture for neither Alam's Board of Directors nor its investors.
Since it is a direct indicator of company's overall efficiency, it can be concluded that the firm has
been performing poorly in 2018. This decline can also be attributed to the 63.64% decline in
Profit After Tax (PAT). Thus, it is recommended that the Board takes necessary actions to
improve its turnover so as to gain its bottom-line profits in a sustainable manner.
Liquidity ratios:
3
⊘ This is a preview!⊘
Do you want full access?
Subscribe today to unlock all pages.
Trusted by 1+ million students worldwide

Current ratio:
Particulars 2018 2017 Increase/Decrease
Current assets 4675 3755
Current liabilities 2425 2255
Current ratio = 4675/2425
= 1.92 times
= 3755/2255
= 1.66 times
Increase
Formula: Current ratio = Current assets / Current liabilities
Interpretation:
Current ratio of year 2018 is 1.93 whereas such ratio in year 2017 is 1.67, this shows that
Alam Plc has taken positive steps in increasing its current ratio, this has happened because the
company has utilises its current assets in efficient manner to pay off its current liabilities.
Reasons for such increased ratio is that current assets increases as compared to last year and its
current year liabilities is not increased in that proportion. This can be informed to the board of
Alam plc is that their current ratio is increasing as compared to previous year though it is not in
an ideal condition that is of 2:1.
Quick ratio:
Particulars 2018 2017 Increase/Decrease
Quick assets 3750 2955
Current liabilities 2425 2255
Quick ratio = 4675-925/ 2425
=1.54 times
= 3755 – 800/2255
= 1.31 times
Increase
Formula: Quick Ratio = Quick assets / Current liabilities
Interpretation:
In year 2018 quick ratio is 1.55 and in year 2017 it is 1.31, this means that company has
performing well in utilising its quick assets to pay its short term liabilities and such company has
in good condition. But Alam Plc is required to work effectively and efficiently in order to
enhance the company's quick assets more as compared to its current liabilities, so that,
company's liquidity position may be enhanced. The standard quick ratio is equal to 1.5: 1, this
means that company has to performed well in current year, due to this, it quick ratio enhanced
4
Particulars 2018 2017 Increase/Decrease
Current assets 4675 3755
Current liabilities 2425 2255
Current ratio = 4675/2425
= 1.92 times
= 3755/2255
= 1.66 times
Increase
Formula: Current ratio = Current assets / Current liabilities
Interpretation:
Current ratio of year 2018 is 1.93 whereas such ratio in year 2017 is 1.67, this shows that
Alam Plc has taken positive steps in increasing its current ratio, this has happened because the
company has utilises its current assets in efficient manner to pay off its current liabilities.
Reasons for such increased ratio is that current assets increases as compared to last year and its
current year liabilities is not increased in that proportion. This can be informed to the board of
Alam plc is that their current ratio is increasing as compared to previous year though it is not in
an ideal condition that is of 2:1.
Quick ratio:
Particulars 2018 2017 Increase/Decrease
Quick assets 3750 2955
Current liabilities 2425 2255
Quick ratio = 4675-925/ 2425
=1.54 times
= 3755 – 800/2255
= 1.31 times
Increase
Formula: Quick Ratio = Quick assets / Current liabilities
Interpretation:
In year 2018 quick ratio is 1.55 and in year 2017 it is 1.31, this means that company has
performing well in utilising its quick assets to pay its short term liabilities and such company has
in good condition. But Alam Plc is required to work effectively and efficiently in order to
enhance the company's quick assets more as compared to its current liabilities, so that,
company's liquidity position may be enhanced. The standard quick ratio is equal to 1.5: 1, this
means that company has to performed well in current year, due to this, it quick ratio enhanced
4
Paraphrase This Document
Need a fresh take? Get an instant paraphrase of this document with our AI Paraphraser
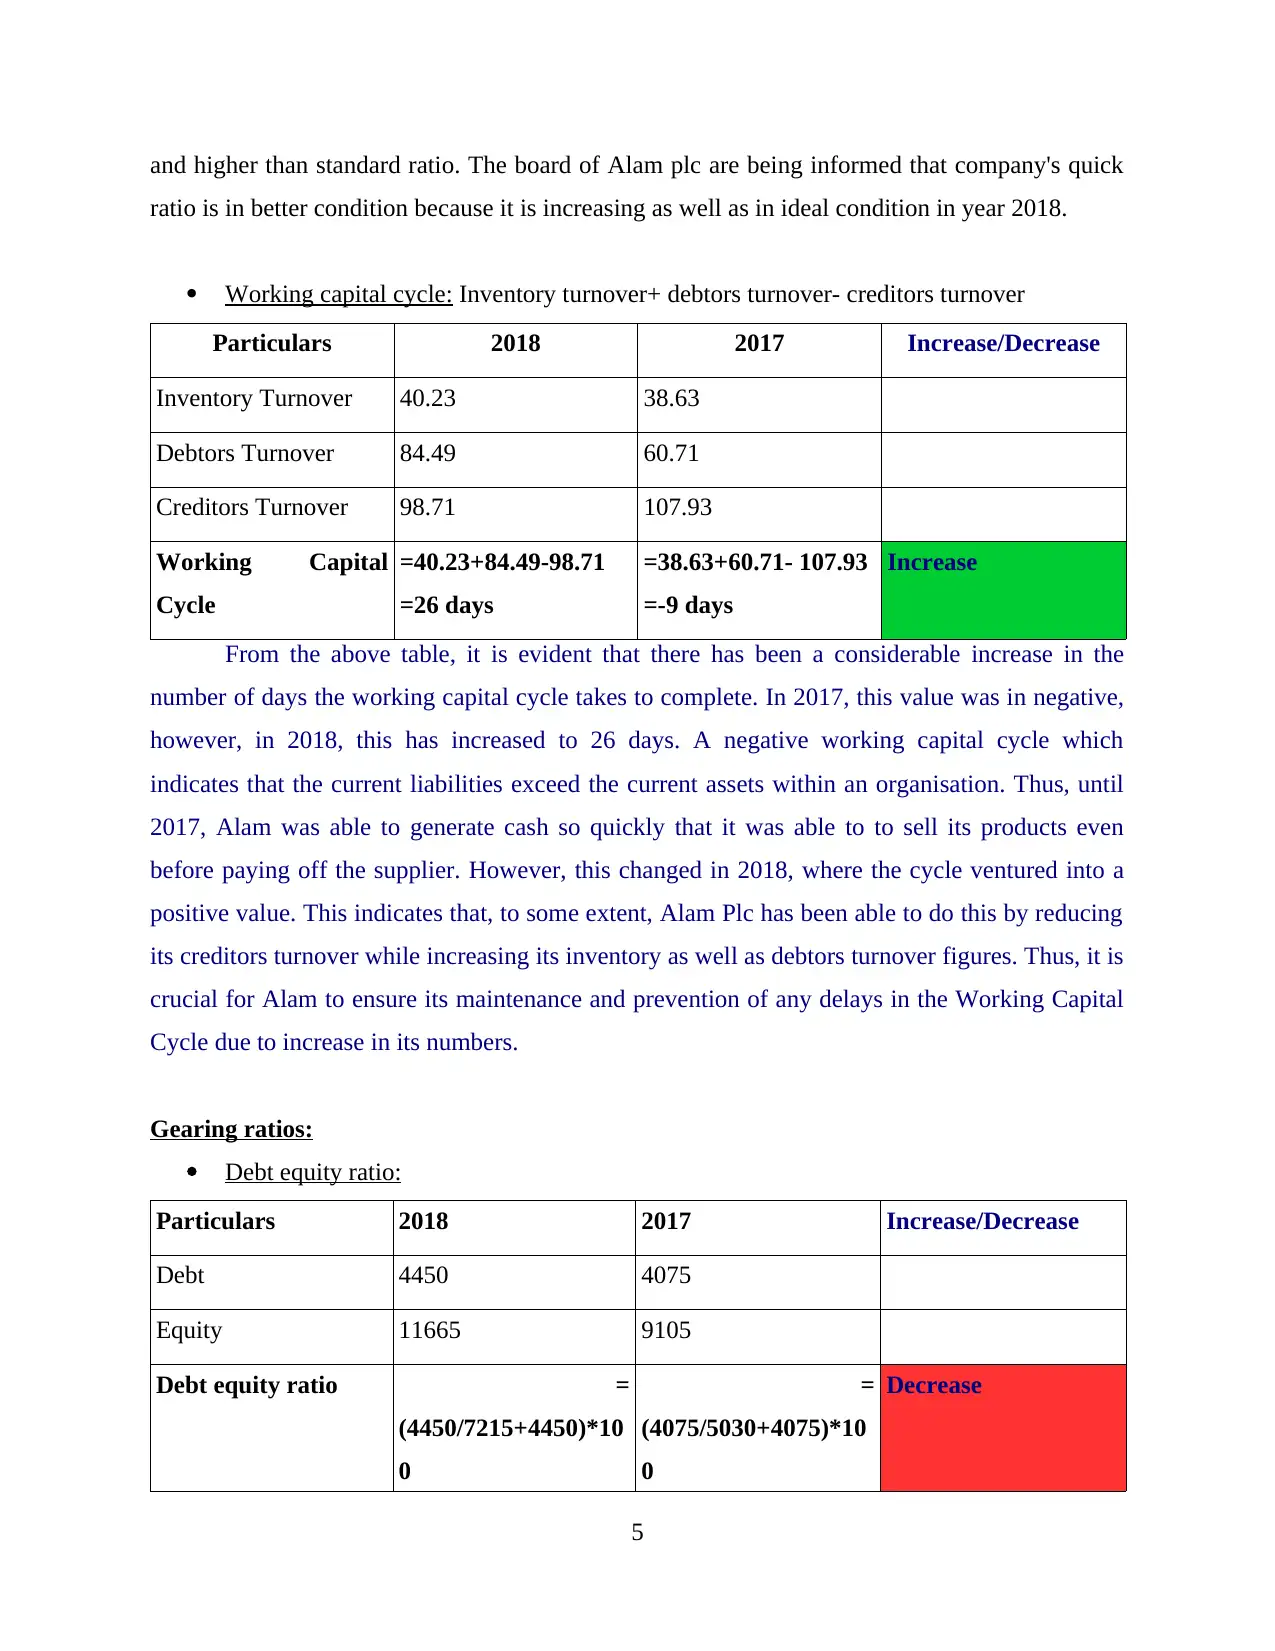
and higher than standard ratio. The board of Alam plc are being informed that company's quick
ratio is in better condition because it is increasing as well as in ideal condition in year 2018.
Working capital cycle: Inventory turnover+ debtors turnover- creditors turnover
Particulars 2018 2017 Increase/Decrease
Inventory Turnover 40.23 38.63
Debtors Turnover 84.49 60.71
Creditors Turnover 98.71 107.93
Working Capital
Cycle
=40.23+84.49-98.71
=26 days
=38.63+60.71- 107.93
=-9 days
Increase
From the above table, it is evident that there has been a considerable increase in the
number of days the working capital cycle takes to complete. In 2017, this value was in negative,
however, in 2018, this has increased to 26 days. A negative working capital cycle which
indicates that the current liabilities exceed the current assets within an organisation. Thus, until
2017, Alam was able to generate cash so quickly that it was able to to sell its products even
before paying off the supplier. However, this changed in 2018, where the cycle ventured into a
positive value. This indicates that, to some extent, Alam Plc has been able to do this by reducing
its creditors turnover while increasing its inventory as well as debtors turnover figures. Thus, it is
crucial for Alam to ensure its maintenance and prevention of any delays in the Working Capital
Cycle due to increase in its numbers.
Gearing ratios:
Debt equity ratio:
Particulars 2018 2017 Increase/Decrease
Debt 4450 4075
Equity 11665 9105
Debt equity ratio =
(4450/7215+4450)*10
0
=
(4075/5030+4075)*10
0
Decrease
5

=38.14% = 44.75%
Formula: Debt equity ratio = Debt / share capital long term loan
Interpretation:
From the above calculations, it is clearly evident that debt portion of Alam as compared
to its equity portion are less in year 2018 (0.62) as compared to year 2017 (0.81). This shows that
company has less finance risk in current year as compared to year 2017. As a result, the decline
in debt-equity ratio indicates that the company has resorted to equity financing in 2018 which is
quite expensive in comparison to raising funds through debt. It has happened due to issue of
additional share capital in 2018 as compared to 2017. Although, there is an increase in its debt in
2018, such increase is not enough to cover the amount of additional share capital along with its
retained earning earnings.
Interest coverage ratio:
Particulars 2018 2017 Increase/Decrease
EBIT 1510 2865
Interest 850 540
Interest coverage
ratio
= 1510/850
= 1.77 times
= 2865/540
= 5.30 times
Decrease
Formula: Interest coverage ratio = EBIT / Interest
Interpretation:
After seen the above calculation, it may be said that company's interest coverage ratio in
year 2018 is 1.78 and in year 2017 it is 4.75. This clearly shows that Alam Plc has not
performing well as it earnings before interest and tax are less in current year as compared to its
last year and also its finance cost in year 2018 is more as compared to last year. Due to which, its
Interest coverage ratio is less. Hence, this can be interpreted to company's board that they have
sufficient fund to pay its interest cost but if in case of any negative circumstances, such company
may not be able to pay its finance cost.
Efficiency / Assets utilisation ratios:
Stock turnover days: Average inventories / cost of sales x 365 days
Particulars 2018 2017 Increase/Decrease
6
⊘ This is a preview!⊘
Do you want full access?
Subscribe today to unlock all pages.
Trusted by 1+ million students worldwide

Average inventory (800+925) / 2 = 862.5 (650+800) / 2 = 725
Cost of sales 7825 6850
Stock turn over days =(862.5/7825)*365
=41 days
=(725/6850)*365
=39 days
Increase
Interpretation:
From the above calculations, it may be concluded that Alam Plc has been performing
well as far as its business operations are concerned. This is indicated through its stock turnover
ratio which is 39 days in year 2017 and 41 days in 2018. Thus, it can be interpreted that above
company should focus on decreasing their turn over days in year 2018. Thus, with the rise in this
ratio it can be concluded that the Alam has been having a good amount of sales in 2018 in
comparison to 2017. Thus, indicating that the efficiency of the overall activities of Alam has
improved considerably. This can be improved more by ensuring that the per dollar increase in the
bottom-line profits for each sale made by Alam.
Account receivable collection period: Trade receivables / credit sales revenue x 365 days
Particulars 2018 2017 Increase/Decrease
Trade receivables 3750 2495
Credit sales revenue 16200 15000
Account receivables
collection period
=(3750/16200)*365
=85 days
=(2495/15000)*365
=61 days
Increase
Interpretation: On the basis of above calculations this can be interpreted that Alam Plc is taking
61 days in making collection in year 2017 that increased in year 2018 and became of 85 days.
Through this increment, it can be said that Alam's customers have been taking delayed payments
in to pay back their dues to the company. This is not a good sign for Alam as it results in a longer
lock-up period of cash flows for the business. Thus, it is recommended that Alam must utilise the
benefits of a Age Receivable Schedule which will enable to determine who its unpaid customers
effectively.
7
Paraphrase This Document
Need a fresh take? Get an instant paraphrase of this document with our AI Paraphraser

Account payable payment period: Account payable / credit purchase x 365 days
Particulars 2018 2017 Increase/Decrease
Account payable 2150 2070
Credit purchase 7950 7000
Account payable
payment period
=(2150/7950)*365
=99 days
=(2070/7000)*365
=108 days
Decrease
Interpretation:
On the basis of above project report this can be analysed that Alam Plc's efficiency
towards making payment has increased in year 2018. This is due to the fact that the overall
Account Payable Payment Period has decreased by 8.33% in 2018 as compared to 2017. Thus,
they are able to effectively pay off their creditors which is crucial for the business and helps it to
enhance its overall credibility as well as strengthen relationship with its creditors in a critical
manner.
Investors:
Dividend payout ratio: Dividend amount for year / earning of the year available for
dividend x 100
Particulars 2018 2017 Increase/Decrease
Dividend amount 190 170
Earning of year for
dividend
440 1210
Dividend payout
ratio
=(190/440)*100
=43.18 %
=(170/1210)*100
=14.04%
Increase
Interpretation: As per above table of dividend payout ratio, this can be analysed that Dividend
Payout ratio for Alam Plc is 14.04% in year 2017 which increased in 2018 and became 43.18%.
Hence, this can be interpreted that their ability for making payment to investors has been
increased significantly in year 2018. Thus, indicating that Alam has been providing cash benefits
to its owners. However, it is recommended to keep such payments in check as excessive
8
Particulars 2018 2017 Increase/Decrease
Account payable 2150 2070
Credit purchase 7950 7000
Account payable
payment period
=(2150/7950)*365
=99 days
=(2070/7000)*365
=108 days
Decrease
Interpretation:
On the basis of above project report this can be analysed that Alam Plc's efficiency
towards making payment has increased in year 2018. This is due to the fact that the overall
Account Payable Payment Period has decreased by 8.33% in 2018 as compared to 2017. Thus,
they are able to effectively pay off their creditors which is crucial for the business and helps it to
enhance its overall credibility as well as strengthen relationship with its creditors in a critical
manner.
Investors:
Dividend payout ratio: Dividend amount for year / earning of the year available for
dividend x 100
Particulars 2018 2017 Increase/Decrease
Dividend amount 190 170
Earning of year for
dividend
440 1210
Dividend payout
ratio
=(190/440)*100
=43.18 %
=(170/1210)*100
=14.04%
Increase
Interpretation: As per above table of dividend payout ratio, this can be analysed that Dividend
Payout ratio for Alam Plc is 14.04% in year 2017 which increased in 2018 and became 43.18%.
Hence, this can be interpreted that their ability for making payment to investors has been
increased significantly in year 2018. Thus, indicating that Alam has been providing cash benefits
to its owners. However, it is recommended to keep such payments in check as excessive
8

Dividend Payouts may result in deficiency of profits to plough back in the business which is
crucial for undertaking future opportunities and projects.
Earnings per share: Earnings available to shareholders / number of share to issue x 100
Particulars 2018 2017 Increase/Decrease
Earnings available to
shareholders
440 1210
Number of share to
issue
6165 4230
Earning per share =(440/6165)*100
=7.13 p
=(1210/4230)*100
=28.60 p
Decrease
Interpretation: On the basis of above table this can be analysed that Alam Plc's EPS is of 28.60p
in 2017 which has decreased in 2018 to 7.13p. Thus, indicating that company's profitability has
decreased significantly. This would result in decline in investor confidence within the company.
Therefore, it is important for Alam's management to ensure that the company is cost-effective
and is able to pursue a higher revenue growth in the foreseeable future.
PART B – CHILLER LTD
Break even point and margin of safety calculations for year 2018 and 2017 related to Chiller Ltd
BEP calculations:
Particulars 2018 2019
Variable cost per unit:
Direct material 200 200
Direct labour cost 30 30
Variable manufacturing cost 30 30
9
⊘ This is a preview!⊘
Do you want full access?
Subscribe today to unlock all pages.
Trusted by 1+ million students worldwide
1 out of 20
Related Documents


Your All-in-One AI-Powered Toolkit for Academic Success.
+13062052269
info@desklib.com
Available 24*7 on WhatsApp / Email
![[object Object]](/_next/static/media/star-bottom.7253800d.svg)
Unlock your academic potential
Copyright © 2020–2026 A2Z Services. All Rights Reserved. Developed and managed by ZUCOL.