Financial Management Project Report, Analysis, and Valuation
VerifiedAdded on 2021/09/10
|13
|3807
|38
Project
AI Summary
This project report delves into critical aspects of financial management, encompassing a comprehensive analysis of capital budgeting techniques, valuation models, and market efficiency. The report begins by evaluating investment proposals using payback period and net present value (NPV) calculations for two machinery options, comparing their profitability and payback timelines. It then explores the implications of financial leasing versus purchasing, recalculating NPV and payback periods to determine the optimal financial strategy. The report further examines operating and financial leases, differentiating between their characteristics and applications. A comparative analysis of P/E ratios and dividend yields for two companies is conducted, considering the impact of financial gearing and shareholder considerations. Task B involves valuation analysis, applying dividend discount, P/E, and net asset valuation models to estimate a company's stock price, followed by a discussion of the strengths, weaknesses, and suitability of each model. Finally, the report addresses the efficient market hypothesis (EMH), outlining its weak, semi-strong, and strong forms and their implications for investment decisions.
Running Head: Financial Management
1
Project Report: Financial Management
1
Project Report: Financial Management
Paraphrase This Document
Need a fresh take? Get an instant paraphrase of this document with our AI Paraphraser
Financial Management
2
Contents
Task A...............................................................................................................................3
Question 1.....................................................................................................................3
Question 2.....................................................................................................................3
Question 3.....................................................................................................................4
Question 4.....................................................................................................................4
Task B...............................................................................................................................6
Question 1.....................................................................................................................6
Question 2.....................................................................................................................6
Question 3.....................................................................................................................7
Question 4.....................................................................................................................8
References.........................................................................................................................9
Appendix.........................................................................................................................10
Financial Management
3
Task A:
Question 1:
Calculation of payback period and net present values:
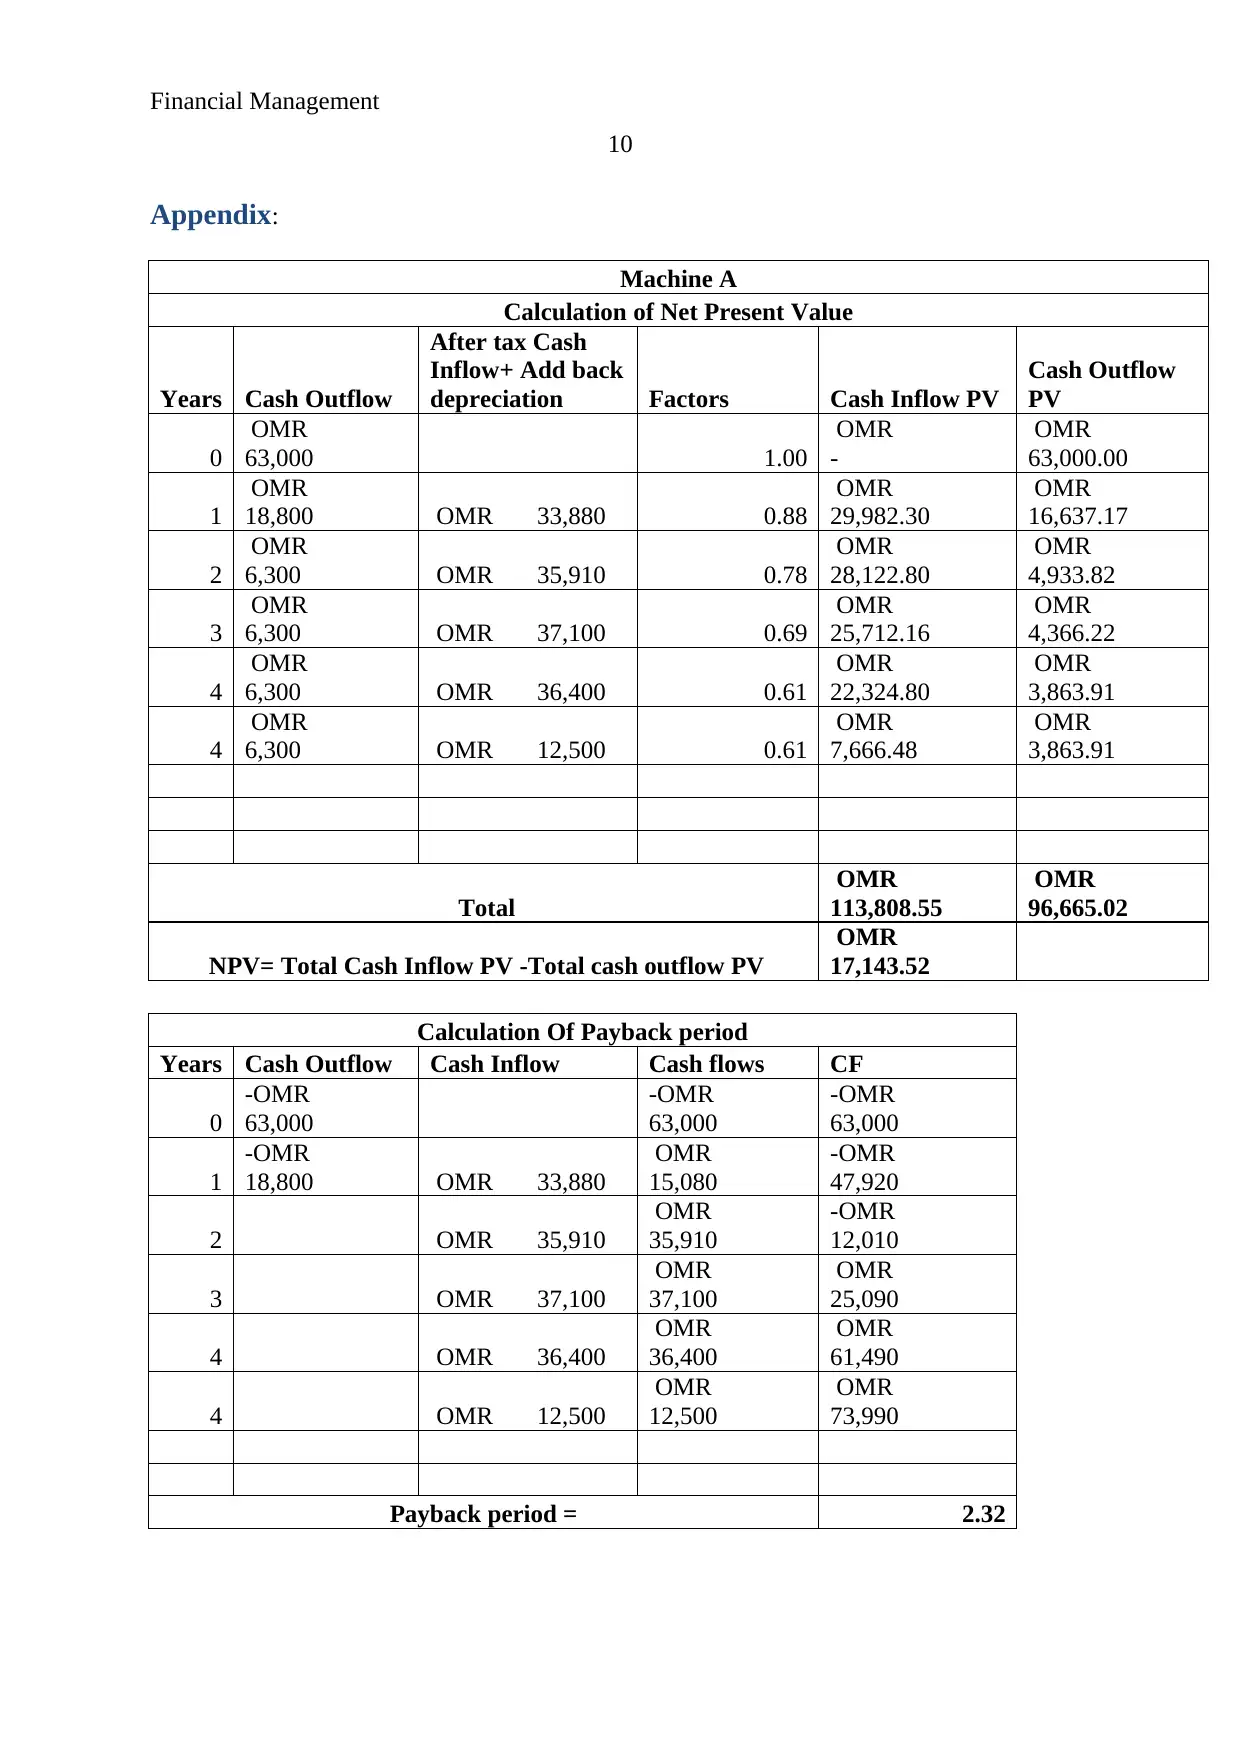
On the basis of the given case, the capital budgeting techniques have been applied on
both the companies in order to evaluate the best option for company’s growth and
profitability position. Payback period and net present value of the company has been
calculated to measure the best investment proposal for the company. On the basis of
calculation on machine A, it has been found that the NPV of machine A is OMR 17,143.52. It
depicts that the net present value of machinery is positive and explains that it would offer
better return to the company. As well as, the payback period of machinery A is 2.32 years
which depicts that the invested amount would be got back by the company in 2.23 years. Rest
the period, company would be able to make new profits (Higgins, 2012).
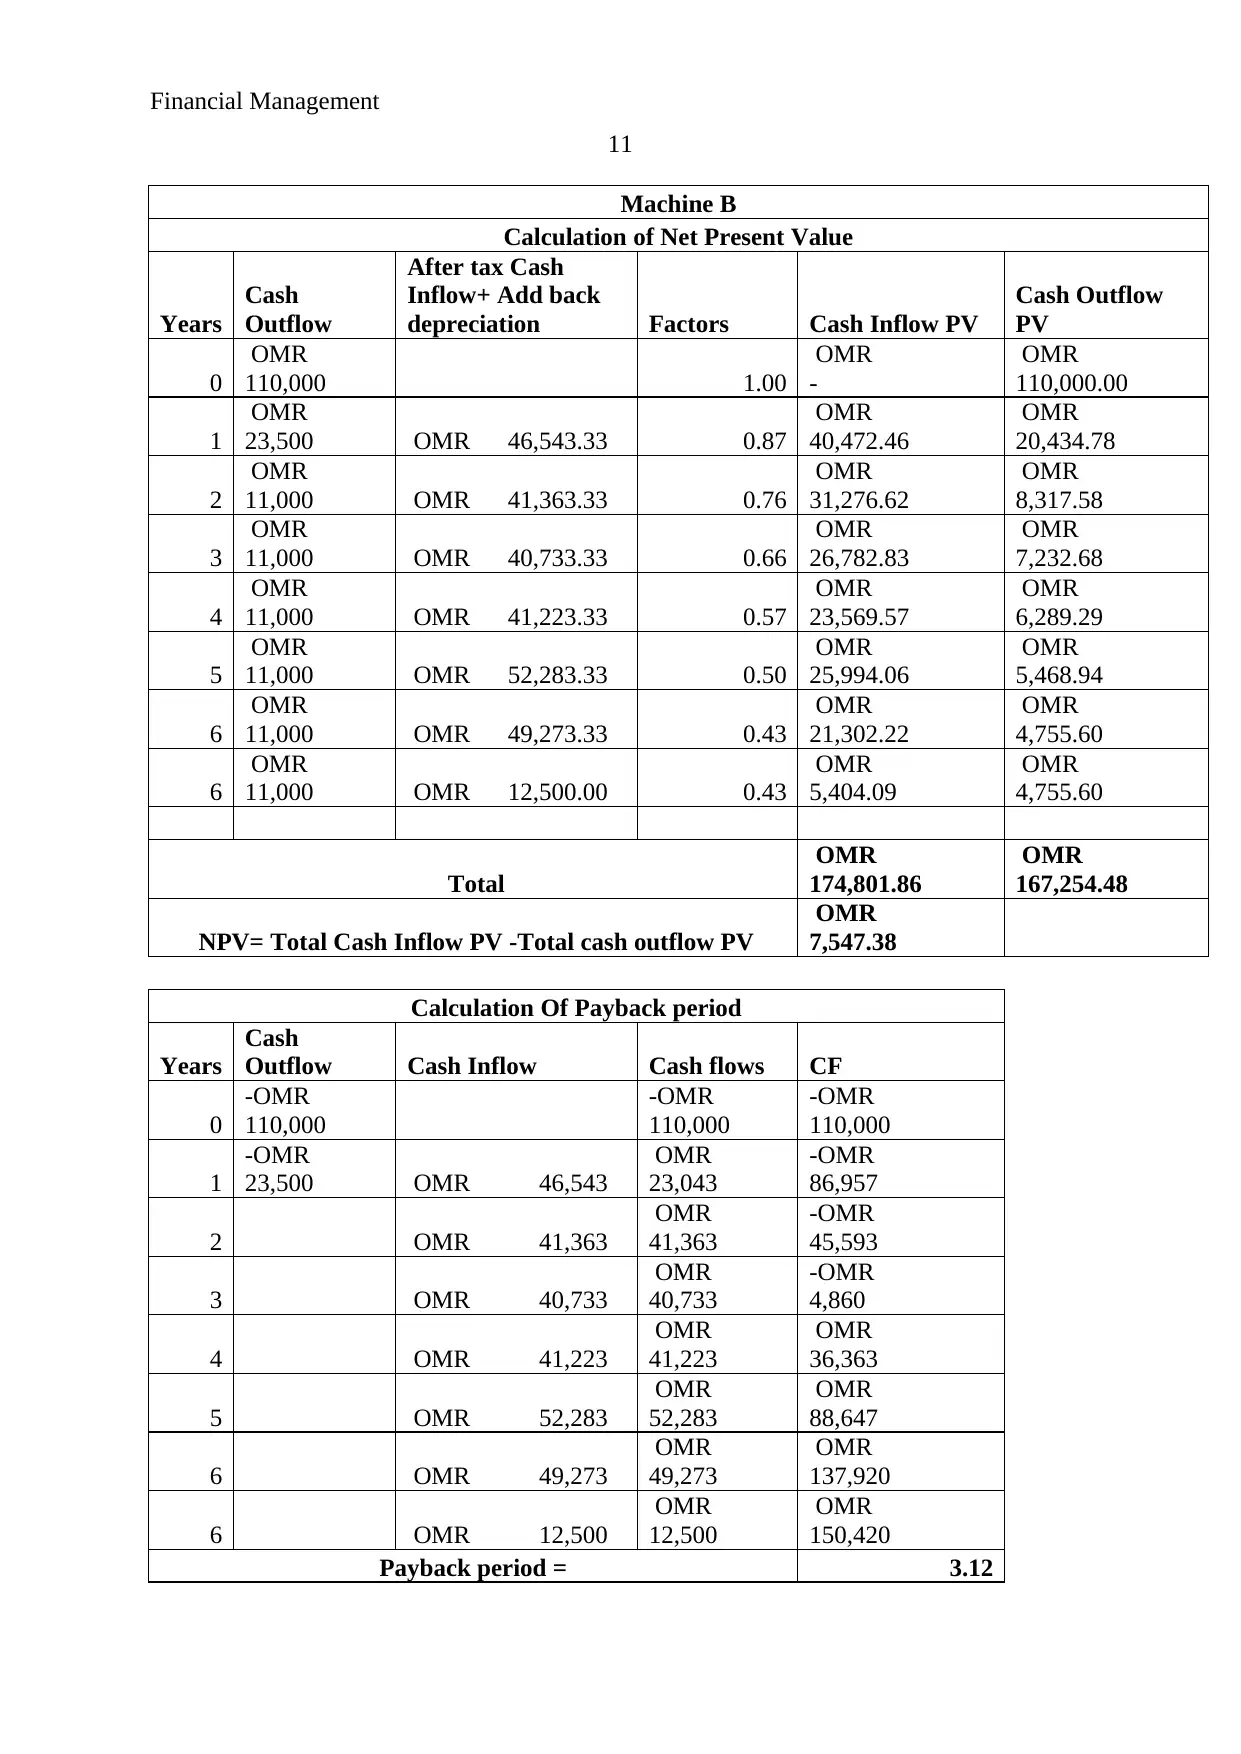
Further, the same calculations have been done on Machinery B in order to identify the
performance of Machinery B and compare it with Machinery A. On the basis of calculation
on machine B, it has been found that the NPV of machine B is OMR 7,547.38. It depicts that
the net present value of machinery is positive and explains that it would offer better return to
the company. As well as, the payback period of machinery B is 3.12 years which depicts that
the invested amount would be got back by the company in 3.12 years. Rest the period,
company would be able to make new profits (Kelly, 2012).
On the basis of the comparison study, it has been recognized that the machinery A is
better than Machinery B in terms of the net profit as well as the total time period in which, it
would be easier for the management of the company to get back the total invested amount
through the cash inflows. The calculations of both the machineries have been given in the
appendix.
Question 2:
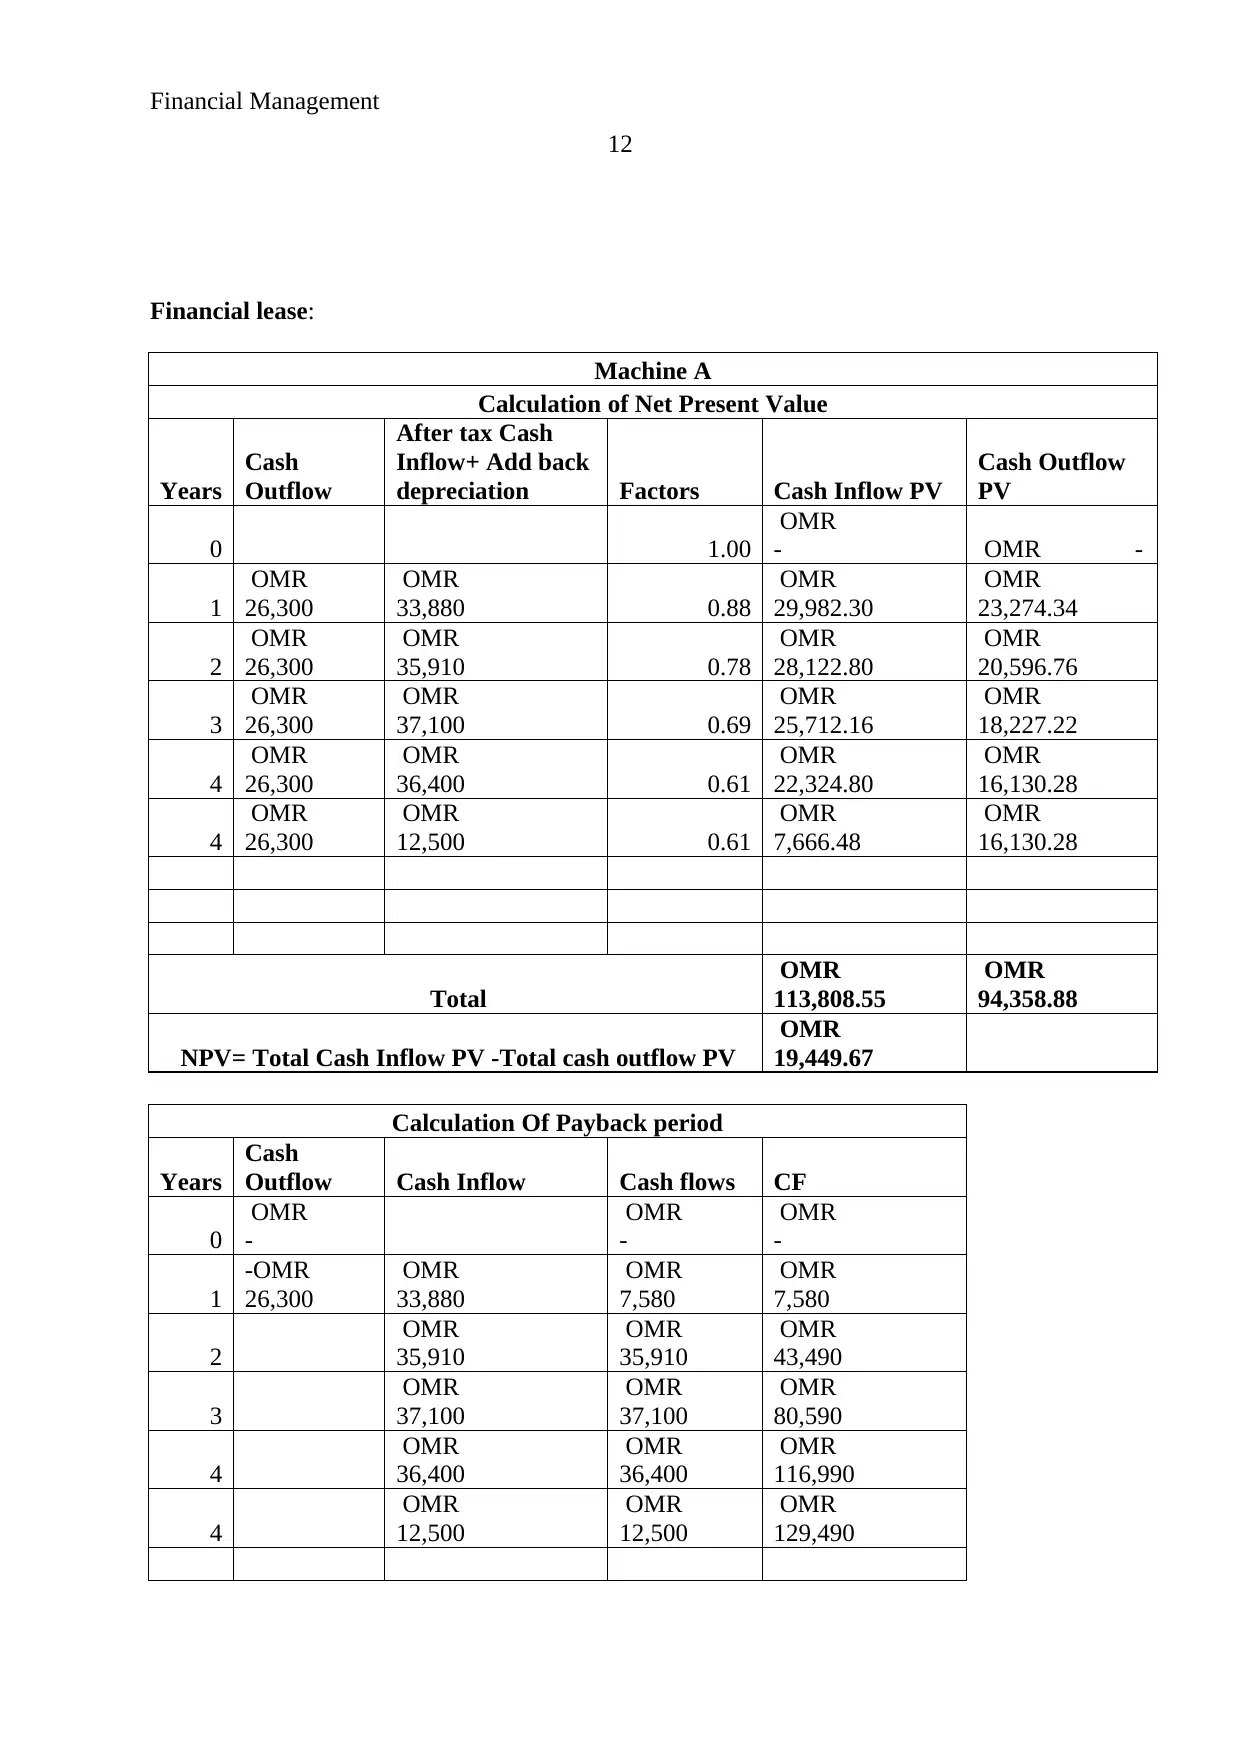
If according to the case, the machinery A is taken on finance lease than the outflow of
the company will be changed and it would affect on the capital budgeting decisions of the
company. On the basis of the calculations, it has been measured that whether the business
should take the machinery on lease or should but it. The capital budgeting techniques have
3
Task A:
Question 1:
Calculation of payback period and net present values:
On the basis of the given case, the capital budgeting techniques have been applied on
both the companies in order to evaluate the best option for company’s growth and
profitability position. Payback period and net present value of the company has been
calculated to measure the best investment proposal for the company. On the basis of
calculation on machine A, it has been found that the NPV of machine A is OMR 17,143.52. It
depicts that the net present value of machinery is positive and explains that it would offer
better return to the company. As well as, the payback period of machinery A is 2.32 years
which depicts that the invested amount would be got back by the company in 2.23 years. Rest
the period, company would be able to make new profits (Higgins, 2012).
Further, the same calculations have been done on Machinery B in order to identify the
performance of Machinery B and compare it with Machinery A. On the basis of calculation
on machine B, it has been found that the NPV of machine B is OMR 7,547.38. It depicts that
the net present value of machinery is positive and explains that it would offer better return to
the company. As well as, the payback period of machinery B is 3.12 years which depicts that
the invested amount would be got back by the company in 3.12 years. Rest the period,
company would be able to make new profits (Kelly, 2012).
On the basis of the comparison study, it has been recognized that the machinery A is
better than Machinery B in terms of the net profit as well as the total time period in which, it
would be easier for the management of the company to get back the total invested amount
through the cash inflows. The calculations of both the machineries have been given in the
appendix.
Question 2:
If according to the case, the machinery A is taken on finance lease than the outflow of
the company will be changed and it would affect on the capital budgeting decisions of the
company. On the basis of the calculations, it has been measured that whether the business
should take the machinery on lease or should but it. The capital budgeting techniques have
⊘ This is a preview!⊘
Do you want full access?
Subscribe today to unlock all pages.
Trusted by 1+ million students worldwide
Financial Management
4
been applied again on both the choices and it has been recognized that the overall outcome of
the machinery would be changed.
On the basis of calculation on machine a (financial lease), it has been found that the
NPV of machine A would be OMR 19,449.67. It depicts that the net present value of
machinery is positive and explains that it would offer better return to the company. As well
as, the payback period of machinery A is 0.83 years which depicts that the invested amount
would be got back by the company in 0.83 years. Rest the period, company would be able to
make new profits.
On the basis of the comparison study, it has been recognized that the machinery A on
lease is better option than buy of machinery A in terms of the net profit as well as the total
time period in which, it would be easier for the management of the company to get back the
total invested amount through the cash inflows (Krantz, 2016). The calculations of both the
machineries have been given in the appendix.
Question 3:
Operating and financial lease as a source of finance:
Operating lease and financial lease are the part of lease which is chosen by the
company on the basis of their requirement. In case of operating lease, when a company needs
any equipment for short time period than it is a better option. The leasing company give the
equipment for short term period in consideration with lease rent and then they wish to sell it
out as second hand after leasing period to other party. On operating lease, equipment is leased
by the company for 2-3 periods which is lesser than the actual time period of the machinery.
This kind of assets are not shown in the balance sheet of the company instead of it, the entire
lease cost of the machineries is shown in the income statement of the company on
expenditure side (Kinsky, 2011).
Whereas, in case of financial lease, it has been found that this lease is the alternative
of hire purchase in which the leasing company recovers the total cost of the machinery from
the company who has taken the equipment on lease. In this case, the company does not own
the machinery but most of the risk and rewards are hold by the leased company. The
company is holding responsible for insuring the assets, maintaining the assets etc. After the
end of the lease time period, business can sold it as second hand property (Madura, 2014).
Paraphrase This Document
Need a fresh take? Get an instant paraphrase of this document with our AI Paraphraser
Financial Management
5
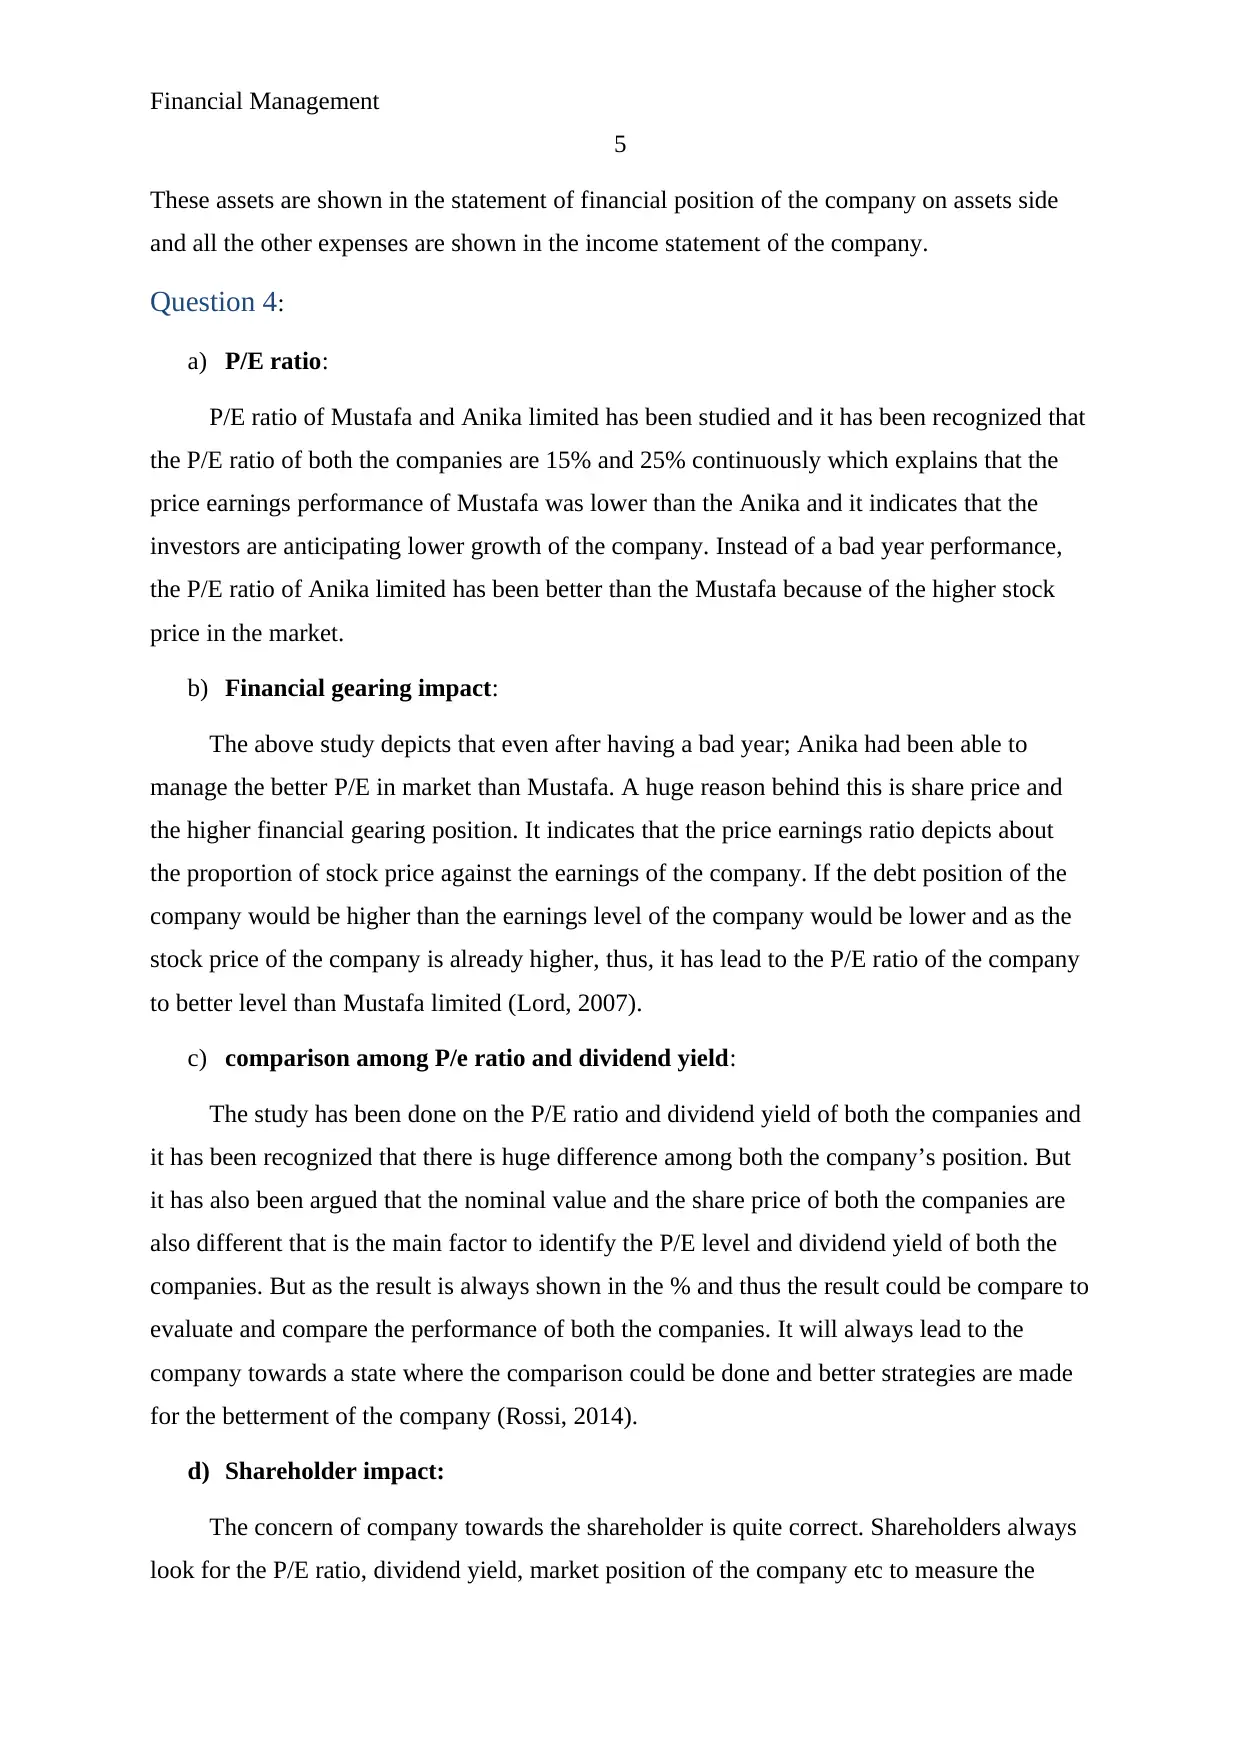
These assets are shown in the statement of financial position of the company on assets side
and all the other expenses are shown in the income statement of the company.
Question 4:
a) P/E ratio:
P/E ratio of Mustafa and Anika limited has been studied and it has been recognized that
the P/E ratio of both the companies are 15% and 25% continuously which explains that the
price earnings performance of Mustafa was lower than the Anika and it indicates that the
investors are anticipating lower growth of the company. Instead of a bad year performance,
the P/E ratio of Anika limited has been better than the Mustafa because of the higher stock
price in the market.
b) Financial gearing impact:
The above study depicts that even after having a bad year; Anika had been able to
manage the better P/E in market than Mustafa. A huge reason behind this is share price and
the higher financial gearing position. It indicates that the price earnings ratio depicts about
the proportion of stock price against the earnings of the company. If the debt position of the
company would be higher than the earnings level of the company would be lower and as the
stock price of the company is already higher, thus, it has lead to the P/E ratio of the company
to better level than Mustafa limited (Lord, 2007).
c) comparison among P/e ratio and dividend yield:
The study has been done on the P/E ratio and dividend yield of both the companies and
it has been recognized that there is huge difference among both the company’s position. But
it has also been argued that the nominal value and the share price of both the companies are
also different that is the main factor to identify the P/E level and dividend yield of both the
companies. But as the result is always shown in the % and thus the result could be compare to
evaluate and compare the performance of both the companies. It will always lead to the
company towards a state where the comparison could be done and better strategies are made
for the betterment of the company (Rossi, 2014).
d) Shareholder impact:
The concern of company towards the shareholder is quite correct. Shareholders always
look for the P/E ratio, dividend yield, market position of the company etc to measure the
5
These assets are shown in the statement of financial position of the company on assets side
and all the other expenses are shown in the income statement of the company.
Question 4:
a) P/E ratio:
P/E ratio of Mustafa and Anika limited has been studied and it has been recognized that
the P/E ratio of both the companies are 15% and 25% continuously which explains that the
price earnings performance of Mustafa was lower than the Anika and it indicates that the
investors are anticipating lower growth of the company. Instead of a bad year performance,
the P/E ratio of Anika limited has been better than the Mustafa because of the higher stock
price in the market.
b) Financial gearing impact:
The above study depicts that even after having a bad year; Anika had been able to
manage the better P/E in market than Mustafa. A huge reason behind this is share price and
the higher financial gearing position. It indicates that the price earnings ratio depicts about
the proportion of stock price against the earnings of the company. If the debt position of the
company would be higher than the earnings level of the company would be lower and as the
stock price of the company is already higher, thus, it has lead to the P/E ratio of the company
to better level than Mustafa limited (Lord, 2007).
c) comparison among P/e ratio and dividend yield:
The study has been done on the P/E ratio and dividend yield of both the companies and
it has been recognized that there is huge difference among both the company’s position. But
it has also been argued that the nominal value and the share price of both the companies are
also different that is the main factor to identify the P/E level and dividend yield of both the
companies. But as the result is always shown in the % and thus the result could be compare to
evaluate and compare the performance of both the companies. It will always lead to the
company towards a state where the comparison could be done and better strategies are made
for the betterment of the company (Rossi, 2014).
d) Shareholder impact:
The concern of company towards the shareholder is quite correct. Shareholders always
look for the P/E ratio, dividend yield, market position of the company etc to measure the
Financial Management
6
performance of the company and make decision that whether the investment must be done in
the company or not (Gapenski, 2008). If the return from the company is even lower than the
risk free government bonds than it is quite big issue for the company and company should
focus on these points to improve the overall performance of the company.
Task B:
Question 1:
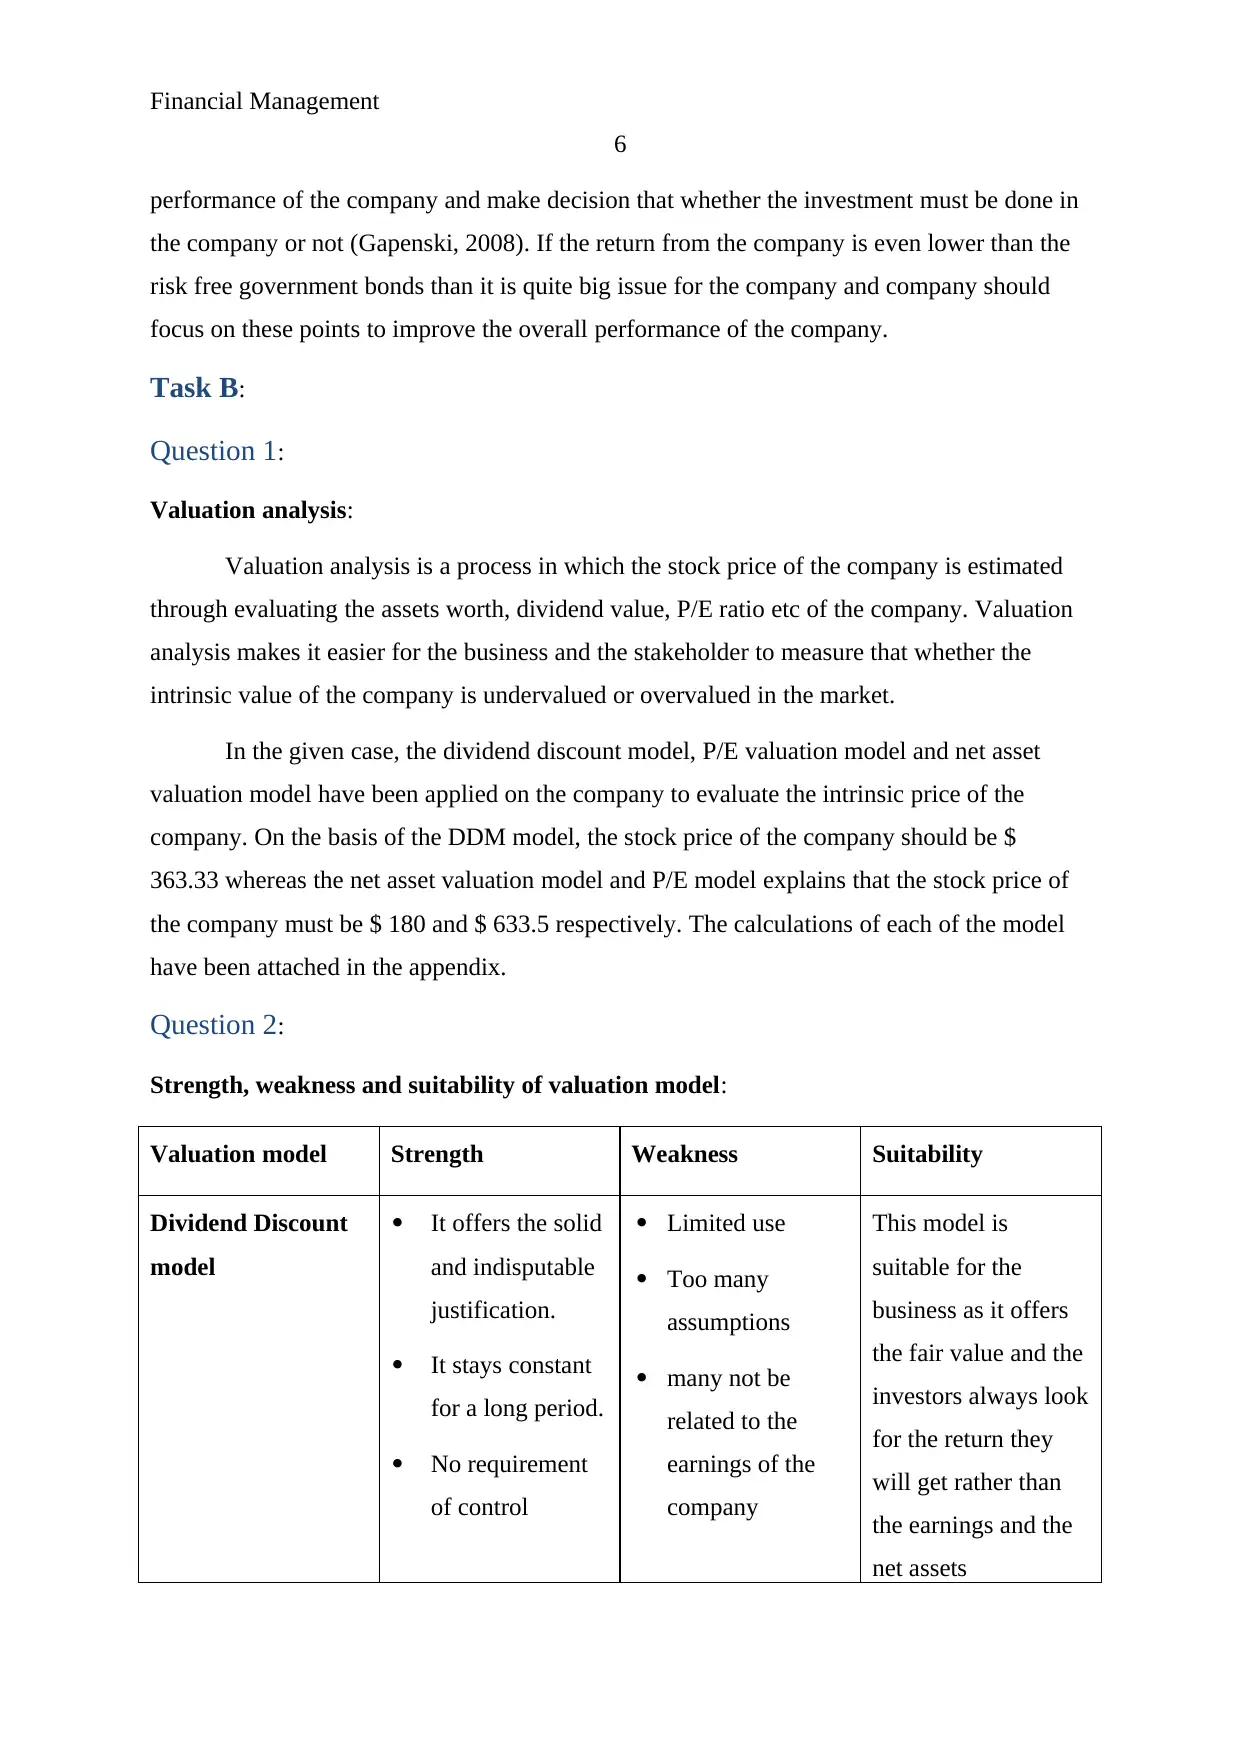
Valuation analysis:
Valuation analysis is a process in which the stock price of the company is estimated
through evaluating the assets worth, dividend value, P/E ratio etc of the company. Valuation
analysis makes it easier for the business and the stakeholder to measure that whether the
intrinsic value of the company is undervalued or overvalued in the market.
In the given case, the dividend discount model, P/E valuation model and net asset
valuation model have been applied on the company to evaluate the intrinsic price of the
company. On the basis of the DDM model, the stock price of the company should be $
363.33 whereas the net asset valuation model and P/E model explains that the stock price of
the company must be $ 180 and $ 633.5 respectively. The calculations of each of the model
have been attached in the appendix.
Question 2:
Strength, weakness and suitability of valuation model:
Valuation model Strength Weakness Suitability
Dividend Discount
model
It offers the solid
and indisputable
justification.
It stays constant
for a long period.
No requirement
of control
Limited use
Too many
assumptions
many not be
related to the
earnings of the
company
This model is
suitable for the
business as it offers
the fair value and the
investors always look
for the return they
will get rather than
the earnings and the
net assets
6
performance of the company and make decision that whether the investment must be done in
the company or not (Gapenski, 2008). If the return from the company is even lower than the
risk free government bonds than it is quite big issue for the company and company should
focus on these points to improve the overall performance of the company.
Task B:
Question 1:
Valuation analysis:
Valuation analysis is a process in which the stock price of the company is estimated
through evaluating the assets worth, dividend value, P/E ratio etc of the company. Valuation
analysis makes it easier for the business and the stakeholder to measure that whether the
intrinsic value of the company is undervalued or overvalued in the market.
In the given case, the dividend discount model, P/E valuation model and net asset
valuation model have been applied on the company to evaluate the intrinsic price of the
company. On the basis of the DDM model, the stock price of the company should be $
363.33 whereas the net asset valuation model and P/E model explains that the stock price of
the company must be $ 180 and $ 633.5 respectively. The calculations of each of the model
have been attached in the appendix.
Question 2:
Strength, weakness and suitability of valuation model:
Valuation model Strength Weakness Suitability
Dividend Discount
model
It offers the solid
and indisputable
justification.
It stays constant
for a long period.
No requirement
of control
Limited use
Too many
assumptions
many not be
related to the
earnings of the
company
This model is
suitable for the
business as it offers
the fair value and the
investors always look
for the return they
will get rather than
the earnings and the
net assets
⊘ This is a preview!⊘
Do you want full access?
Subscribe today to unlock all pages.
Trusted by 1+ million students worldwide
Financial Management
7
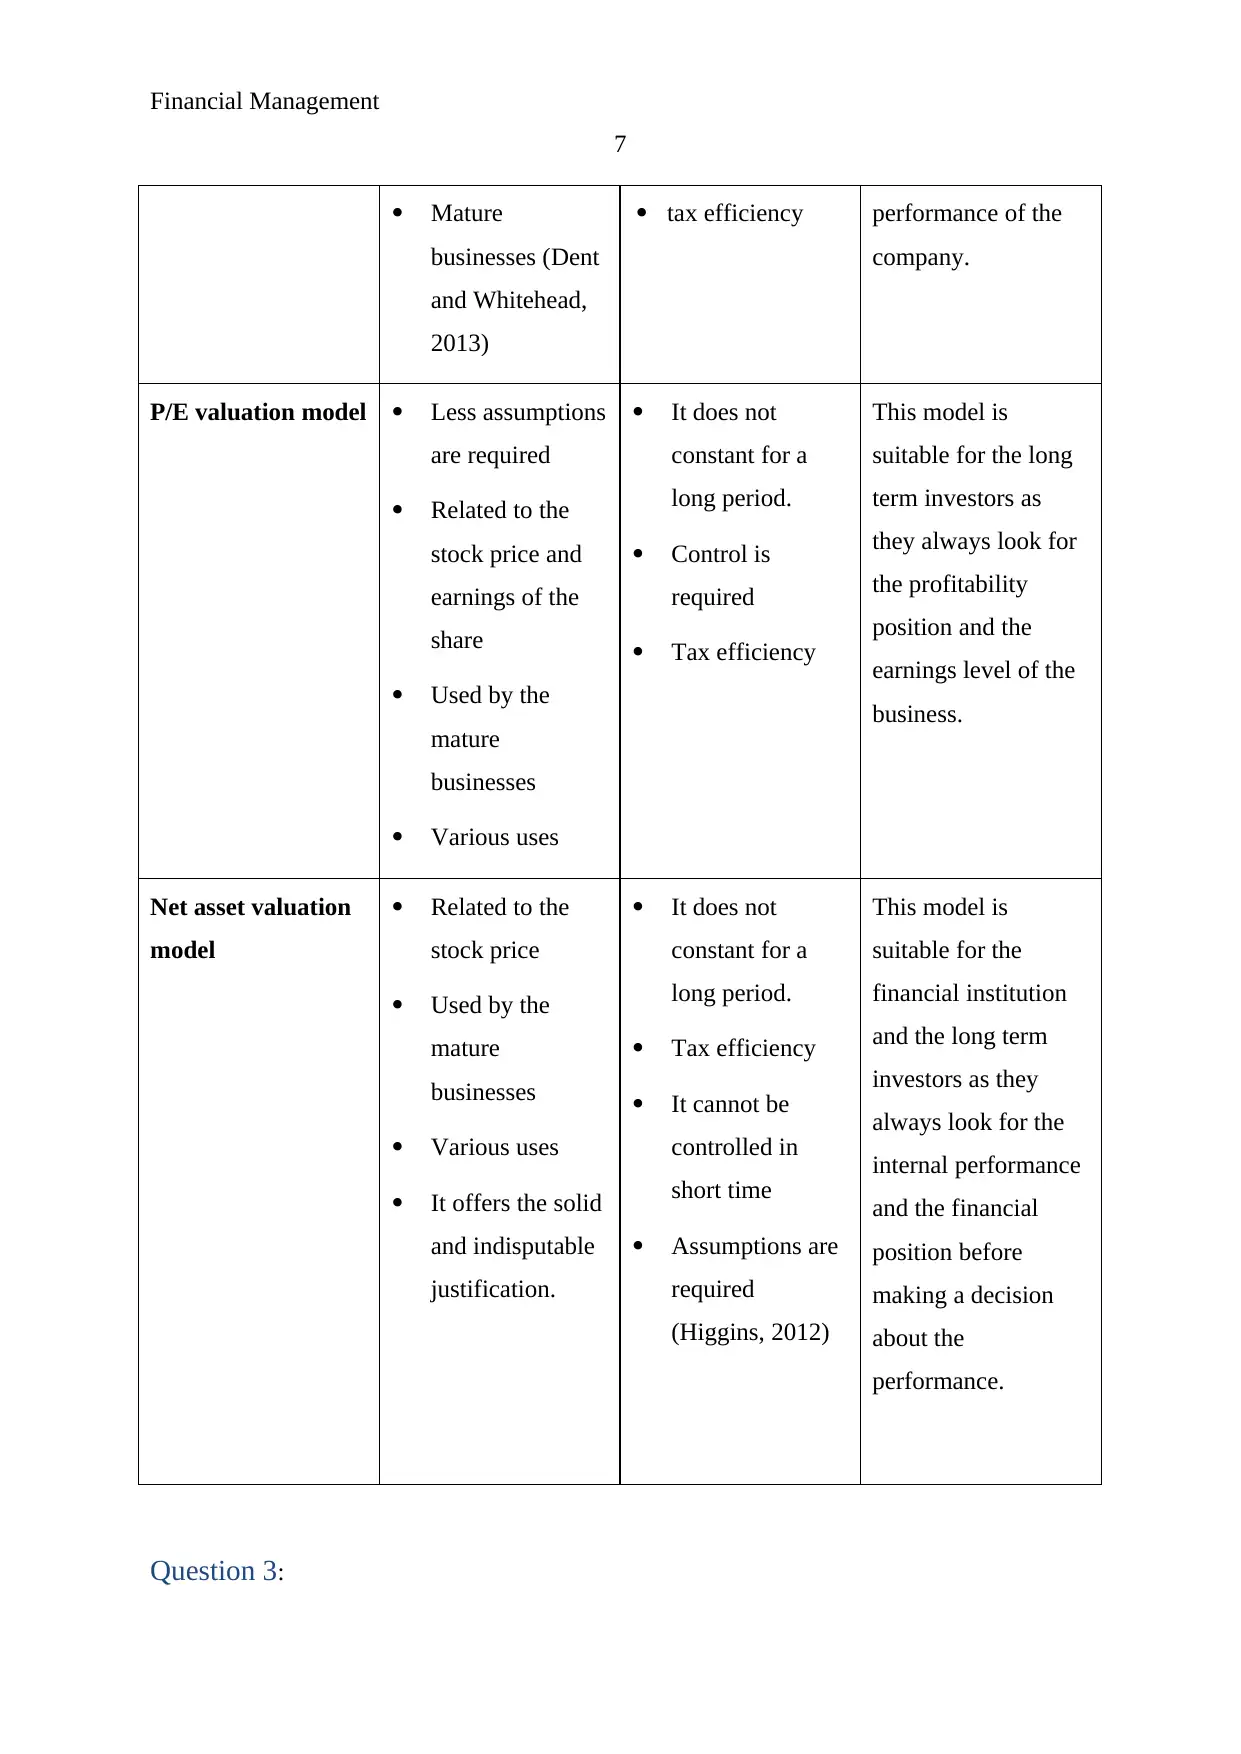
Mature
businesses (Dent
and Whitehead,
2013)
tax efficiency performance of the
company.
P/E valuation model Less assumptions
are required
Related to the
stock price and
earnings of the
share
Used by the
mature
businesses
Various uses
It does not
constant for a
long period.
Control is
required
Tax efficiency
This model is
suitable for the long
term investors as
they always look for
the profitability
position and the
earnings level of the
business.
Net asset valuation
model
Related to the
stock price
Used by the
mature
businesses
Various uses
It offers the solid
and indisputable
justification.
It does not
constant for a
long period.
Tax efficiency
It cannot be
controlled in
short time
Assumptions are
required
(Higgins, 2012)
This model is
suitable for the
financial institution
and the long term
investors as they
always look for the
internal performance
and the financial
position before
making a decision
about the
performance.
Question 3:
7
Mature
businesses (Dent
and Whitehead,
2013)
tax efficiency performance of the
company.
P/E valuation model Less assumptions
are required
Related to the
stock price and
earnings of the
share
Used by the
mature
businesses
Various uses
It does not
constant for a
long period.
Control is
required
Tax efficiency
This model is
suitable for the long
term investors as
they always look for
the profitability
position and the
earnings level of the
business.
Net asset valuation
model
Related to the
stock price
Used by the
mature
businesses
Various uses
It offers the solid
and indisputable
justification.
It does not
constant for a
long period.
Tax efficiency
It cannot be
controlled in
short time
Assumptions are
required
(Higgins, 2012)
This model is
suitable for the
financial institution
and the long term
investors as they
always look for the
internal performance
and the financial
position before
making a decision
about the
performance.
Question 3:
Paraphrase This Document
Need a fresh take? Get an instant paraphrase of this document with our AI Paraphraser
Financial Management
8
Efficient market hypothesis is an investment theory where the stock price of an
organization reflects about the information of the business and explains that the consistent
alpha generation is not possible in the business. Mainly, there are three forms of efficient
market hypothesis which are weak form, semi strong and strong form of EMH.
Weak from of EMH explains that the market is efficient and it reflects about entire
market information. It is assumed in this form that the rate of return is an independent factor
in the market which must not be affected from the past rate of return of the company
(Narayan, Narayan, Popp and Ali Ahmed, 2015). Whereas, the semi strong EMH defines that
the market is efficient and only reflect about the publicly available information of the
company. It incorporates the EMH’s weak form as well. It indicates that the investors always
make decision about the investment through the available information in the market
(Marwala and Hurwitz, 2017).
Lastly, the strong form of EMH has been studied. The strong form implies that market
is efficient and depicts about all the public and private information about an organization. It
builds up and incorporates the semi strong and weak form of EMH (Khan and Khan, 2016). It
defines that the decision is made by the investors on the basis of the available public and
private information.
Question 4:
On the basis of the valuation techniques, strength, weakness and suitability of various
valuation models and the efficient market hypothesis, it has been recognized that the stock
market is quite variable in nature. With the changes of each of the information and factor, the
stock performance of the company get change and along with that, the decisions of the
investors about the company get also change. If the strong form of EMH is taken into the
concern than it depicts that the changes into the public and private information affect the
investment decision of the stockholder (Komariah, Mahbub and Sin, 2015). However, it has
also been mentioned that they do not take the concern on the previous data which is not true.
In order to invest for a long period, in a security, investors focuses on the previous data and
future forecasted performance of the company.
Financial Management
9
References:
Dent, M. and Whitehead, S. 2013. Managing professional identities: Knowledge,
performativities and the'new'professional (Vol. 19). Routledge.
Gapenski, L.C., 2008. Healthcare finance: an introduction to accounting and financial
management. Health Administration Press.
Higgins, R. C., 2012. Analysis for financial management. McGraw-Hill/Irwin.
Kelly, K.S., 2012. Effective fund-raising management. Routledge.
Khan, N.U. and Khan, S., 2016. Weak Form of Efficient Market Hypothesis: Evidence from
Pakistan. Business & Economic Review, 8(SE), pp.1-18.
Kinsky, R. 2011. Charting Made Simple: A Beginner's Guide to Technical Analysis. John
Wiley & Sons.
Komariah, K.S., Mahbub, C. and Sin, B.K., 2015. Efficient Market Hypothesis Approach to
Predict USD/IDR Trends using Twitter Sentiment Analysis. Database, 6, p.12th.
Krantz, M. 2016. Fundamental Analysis for Dummies. London: John Wiley & Sons.
Lord, B.R., 2007. Strategic management accounting. Issues in Management Accounting, 3.
Madura, J. 2014. Financial Markets and Institutions. Cengage Learning.
Marwala, T. and Hurwitz, E., 2017. Efficient Market Hypothesis. In Artificial Intelligence
and Economic Theory: Skynet in the Market (pp. 101-110). Springer, Cham.
Narayan, P.K., Narayan, S., Popp, S. and Ali Ahmed, H., 2015. Is the efficient market
hypothesis day-of-the-week dependent? Evidence from the banking sector. Applied
Economics, 47(23), pp.2359-2378.
Rossi, M., 2014. Capital budgeting in Europe: confronting theory with practice. International
Journal of Managerial and Financial Accounting, 6(4), pp.341-356.
⊘ This is a preview!⊘
Do you want full access?
Subscribe today to unlock all pages.
Trusted by 1+ million students worldwide
Financial Management
10
Appendix:
Machine A
Calculation of Net Present Value
Years Cash Outflow
After tax Cash
Inflow+ Add back
depreciation Factors Cash Inflow PV
Cash Outflow
PV
0
OMR
63,000 1.00
OMR
-
OMR
63,000.00
1
OMR
18,800 OMR 33,880 0.88
OMR
29,982.30
OMR
16,637.17
2
OMR
6,300 OMR 35,910 0.78
OMR
28,122.80
OMR
4,933.82
3
OMR
6,300 OMR 37,100 0.69
OMR
25,712.16
OMR
4,366.22
4
OMR
6,300 OMR 36,400 0.61
OMR
22,324.80
OMR
3,863.91
4
OMR
6,300 OMR 12,500 0.61
OMR
7,666.48
OMR
3,863.91
Total
OMR
113,808.55
OMR
96,665.02
NPV= Total Cash Inflow PV -Total cash outflow PV
OMR
17,143.52
Calculation Of Payback period
Years Cash Outflow Cash Inflow Cash flows CF
0
-OMR
63,000
-OMR
63,000
-OMR
63,000
1
-OMR
18,800 OMR 33,880
OMR
15,080
-OMR
47,920
2 OMR 35,910
OMR
35,910
-OMR
12,010
3 OMR 37,100
OMR
37,100
OMR
25,090
4 OMR 36,400
OMR
36,400
OMR
61,490
4 OMR 12,500
OMR
12,500
OMR
73,990
Payback period = 2.32
Paraphrase This Document
Need a fresh take? Get an instant paraphrase of this document with our AI Paraphraser
Financial Management
11
Machine B
Calculation of Net Present Value
Years
Cash
Outflow
After tax Cash
Inflow+ Add back
depreciation Factors Cash Inflow PV
Cash Outflow
PV
0
OMR
110,000 1.00
OMR
-
OMR
110,000.00
1
OMR
23,500 OMR 46,543.33 0.87
OMR
40,472.46
OMR
20,434.78
2
OMR
11,000 OMR 41,363.33 0.76
OMR
31,276.62
OMR
8,317.58
3
OMR
11,000 OMR 40,733.33 0.66
OMR
26,782.83
OMR
7,232.68
4
OMR
11,000 OMR 41,223.33 0.57
OMR
23,569.57
OMR
6,289.29
5
OMR
11,000 OMR 52,283.33 0.50
OMR
25,994.06
OMR
5,468.94
6
OMR
11,000 OMR 49,273.33 0.43
OMR
21,302.22
OMR
4,755.60
6
OMR
11,000 OMR 12,500.00 0.43
OMR
5,404.09
OMR
4,755.60
Total
OMR
174,801.86
OMR
167,254.48
NPV= Total Cash Inflow PV -Total cash outflow PV
OMR
7,547.38
Calculation Of Payback period
Years
Cash
Outflow Cash Inflow Cash flows CF
0
-OMR
110,000
-OMR
110,000
-OMR
110,000
1
-OMR
23,500 OMR 46,543
OMR
23,043
-OMR
86,957
2 OMR 41,363
OMR
41,363
-OMR
45,593
3 OMR 40,733
OMR
40,733
-OMR
4,860
4 OMR 41,223
OMR
41,223
OMR
36,363
5 OMR 52,283
OMR
52,283
OMR
88,647
6 OMR 49,273
OMR
49,273
OMR
137,920
6 OMR 12,500
OMR
12,500
OMR
150,420
Payback period = 3.12
Financial Management
12
Financial lease:
Machine A
Calculation of Net Present Value
Years
Cash
Outflow
After tax Cash
Inflow+ Add back
depreciation Factors Cash Inflow PV
Cash Outflow
PV
0 1.00
OMR
- OMR -
1
OMR
26,300
OMR
33,880 0.88
OMR
29,982.30
OMR
23,274.34
2
OMR
26,300
OMR
35,910 0.78
OMR
28,122.80
OMR
20,596.76
3
OMR
26,300
OMR
37,100 0.69
OMR
25,712.16
OMR
18,227.22
4
OMR
26,300
OMR
36,400 0.61
OMR
22,324.80
OMR
16,130.28
4
OMR
26,300
OMR
12,500 0.61
OMR
7,666.48
OMR
16,130.28
Total
OMR
113,808.55
OMR
94,358.88
NPV= Total Cash Inflow PV -Total cash outflow PV
OMR
19,449.67
Calculation Of Payback period
Years
Cash
Outflow Cash Inflow Cash flows CF
0
OMR
-
OMR
-
OMR
-
1
-OMR
26,300
OMR
33,880
OMR
7,580
OMR
7,580
2
OMR
35,910
OMR
35,910
OMR
43,490
3
OMR
37,100
OMR
37,100
OMR
80,590
4
OMR
36,400
OMR
36,400
OMR
116,990
4
OMR
12,500
OMR
12,500
OMR
129,490
⊘ This is a preview!⊘
Do you want full access?
Subscribe today to unlock all pages.
Trusted by 1+ million students worldwide
1 out of 13
Related Documents


Your All-in-One AI-Powered Toolkit for Academic Success.
+13062052269
info@desklib.com
Available 24*7 on WhatsApp / Email
![[object Object]](/_next/static/media/star-bottom.7253800d.svg)
Unlock your academic potential
Copyright © 2020–2026 A2Z Services. All Rights Reserved. Developed and managed by ZUCOL.