Financial Management Report: CHI SWOT, Ratio Analysis, and CCA
VerifiedAdded on 2023/01/10
|15
|2037
|26
Report
AI Summary
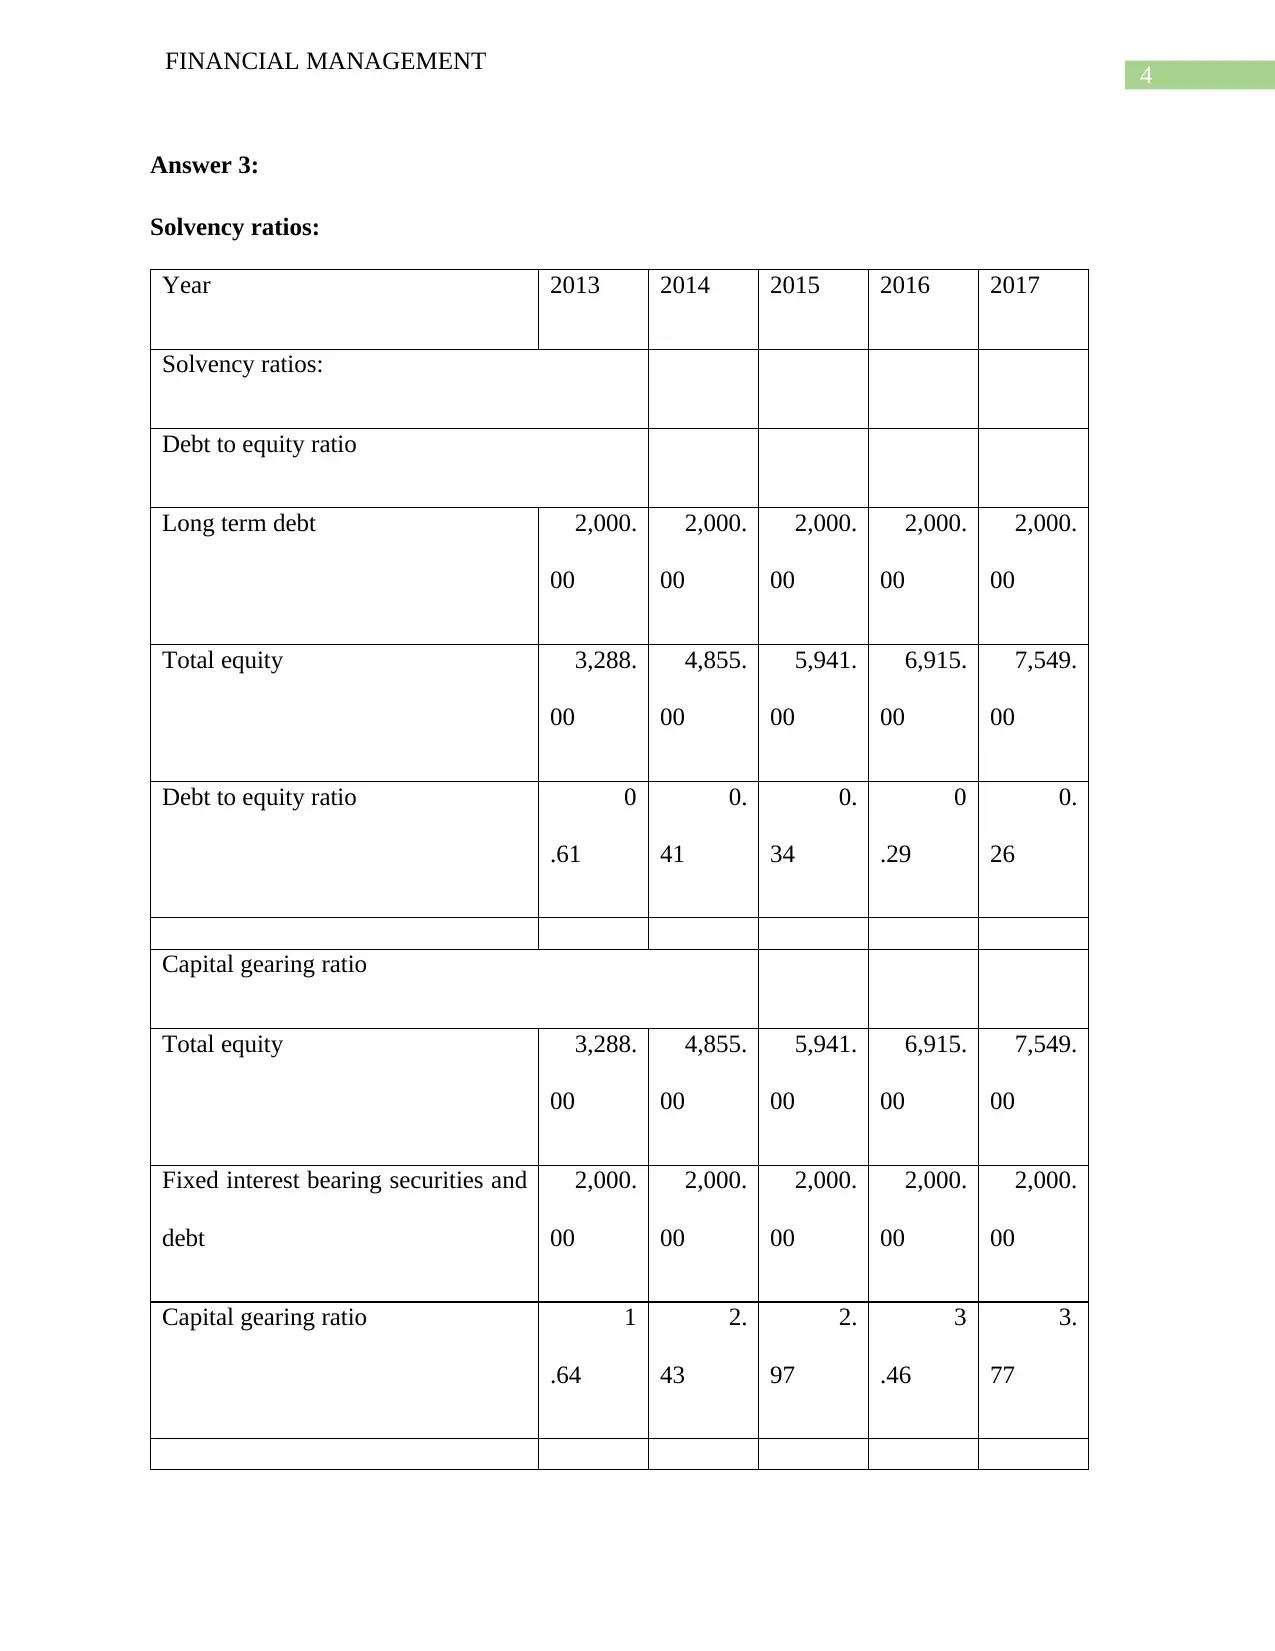
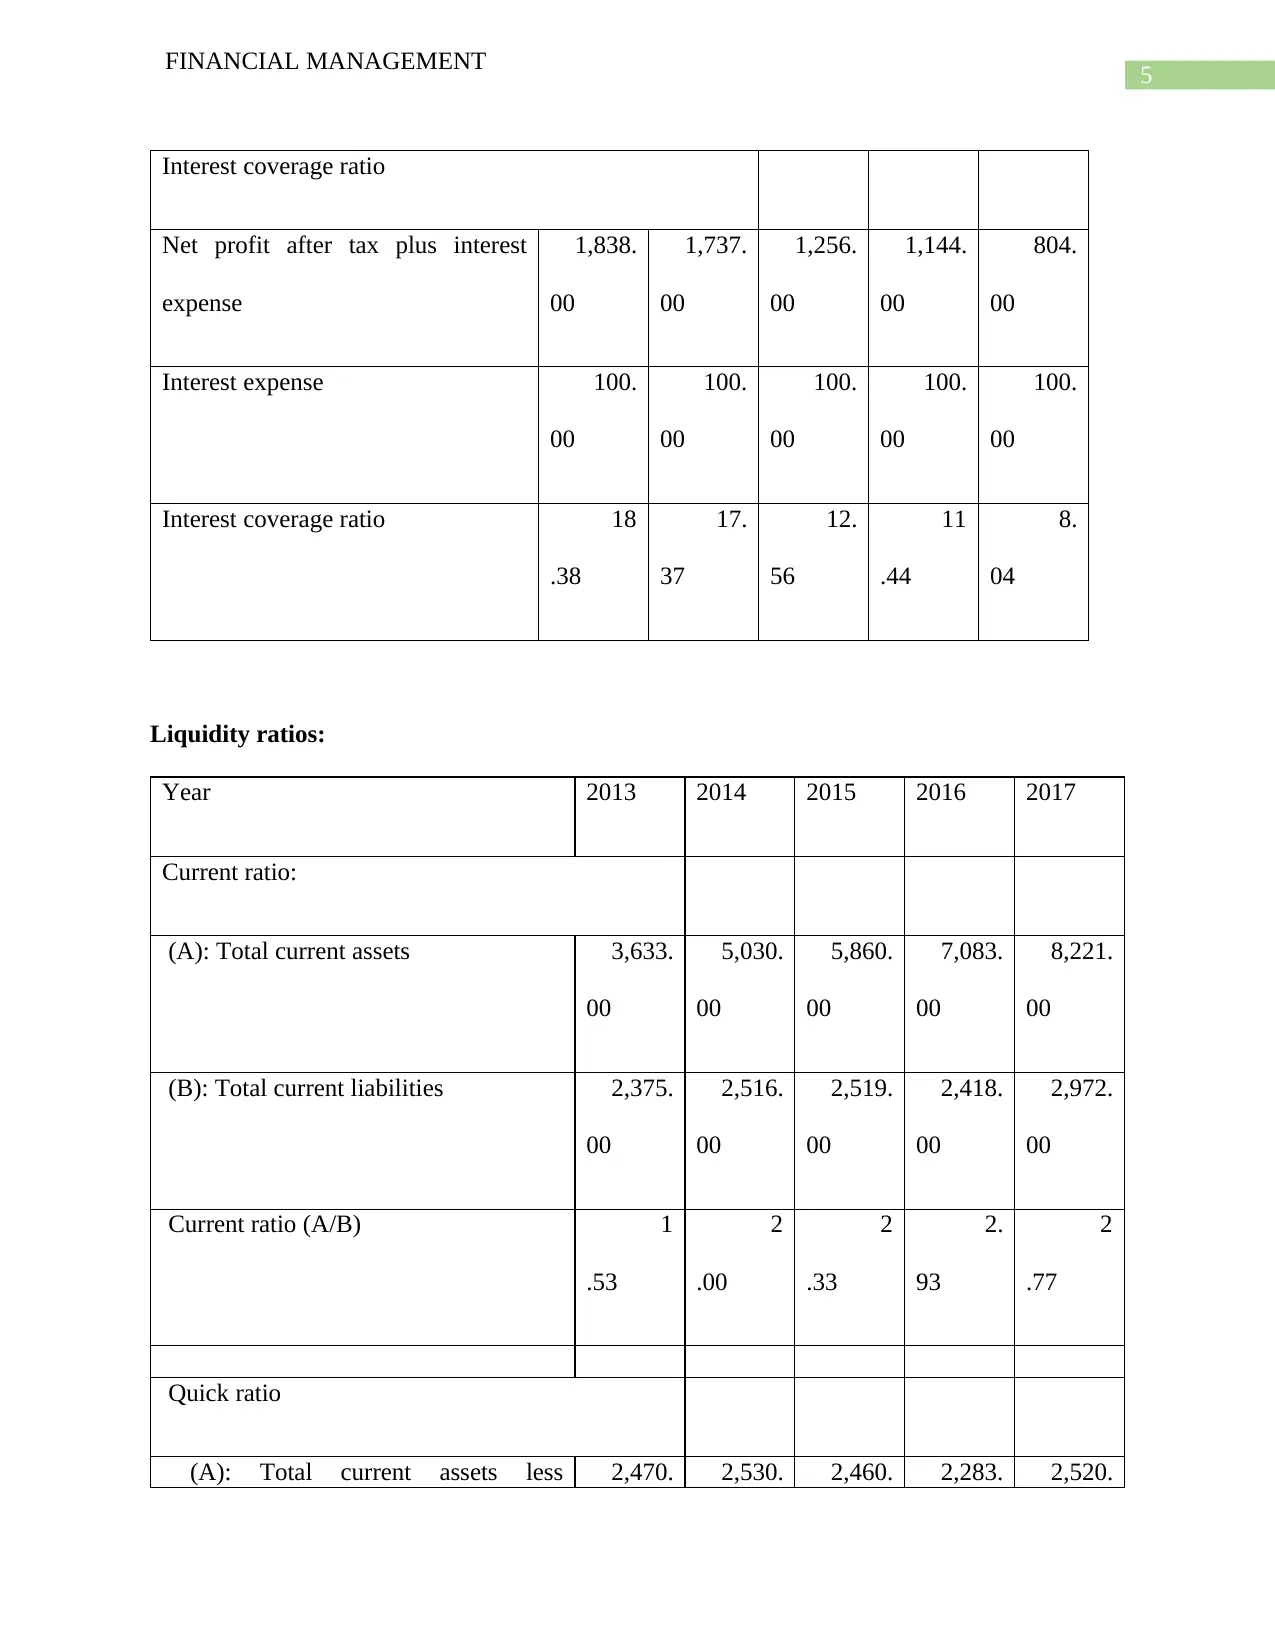
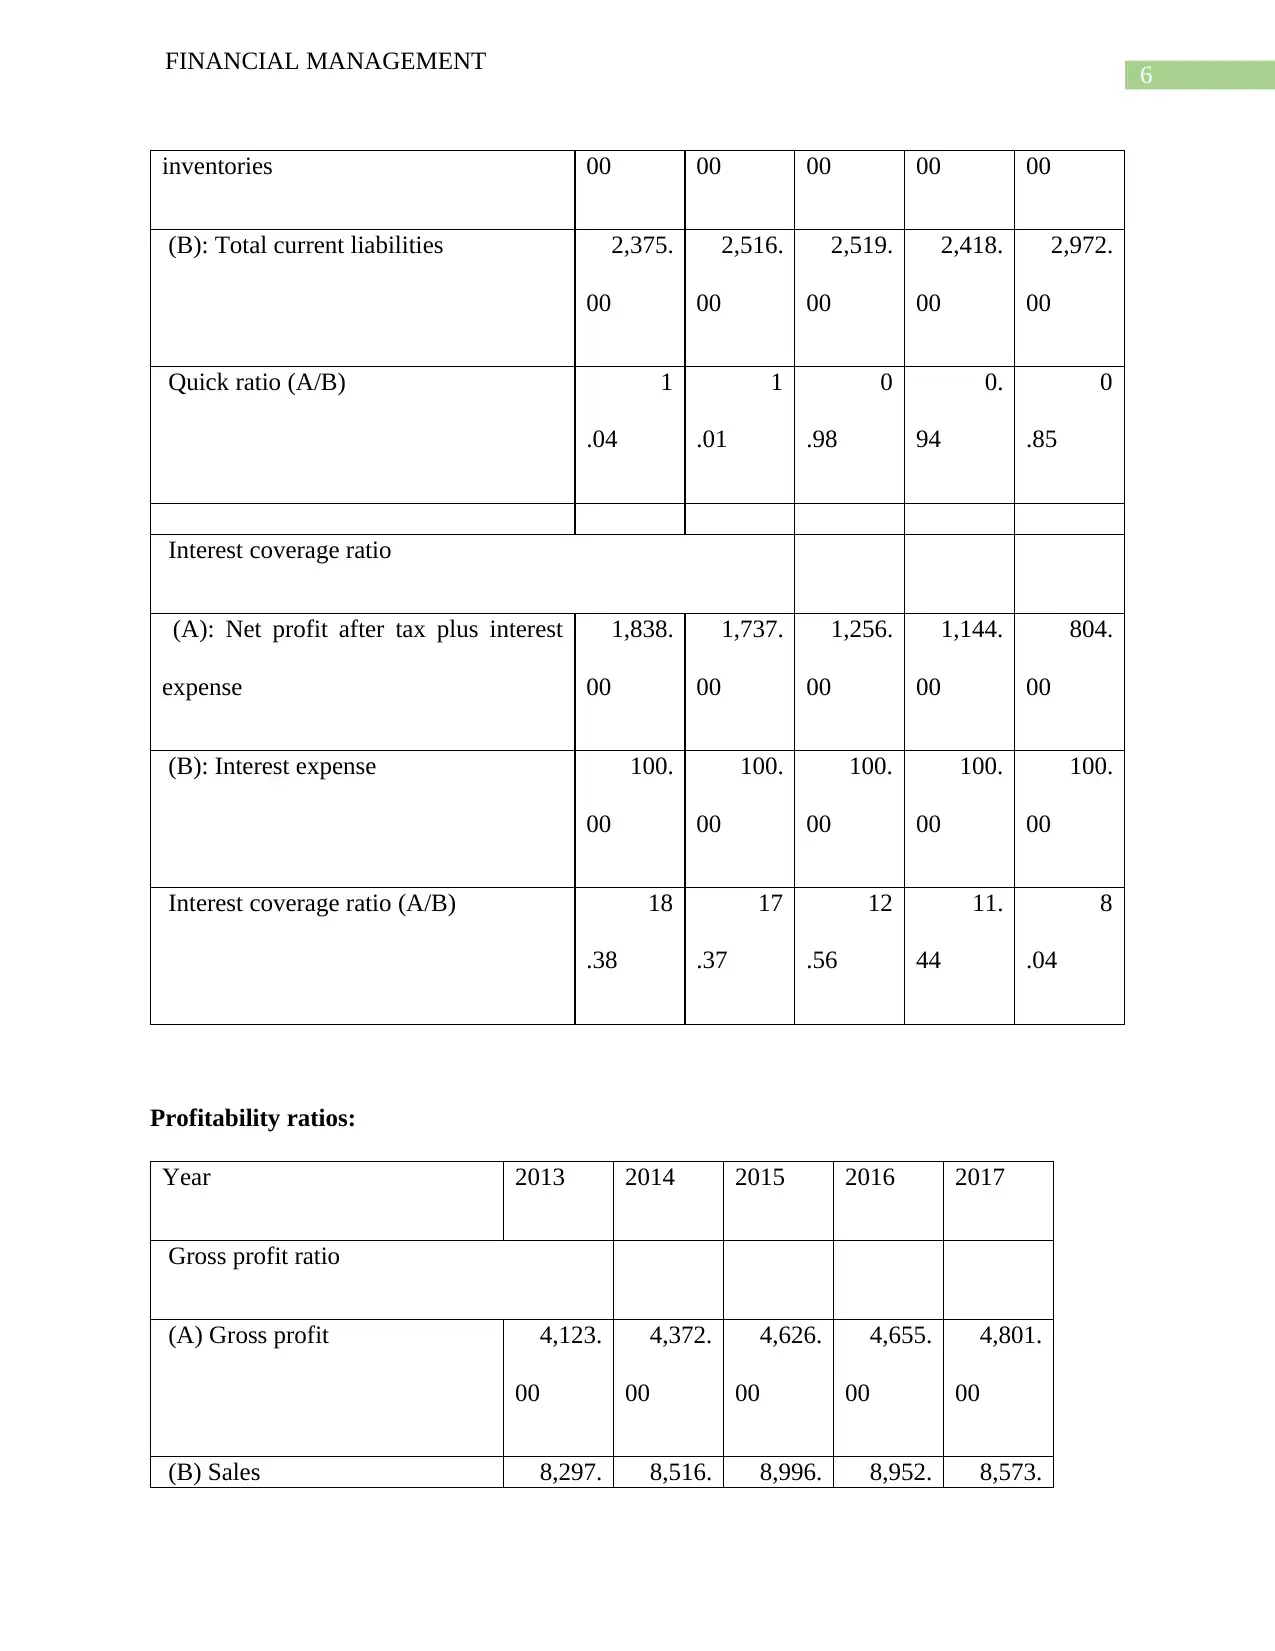
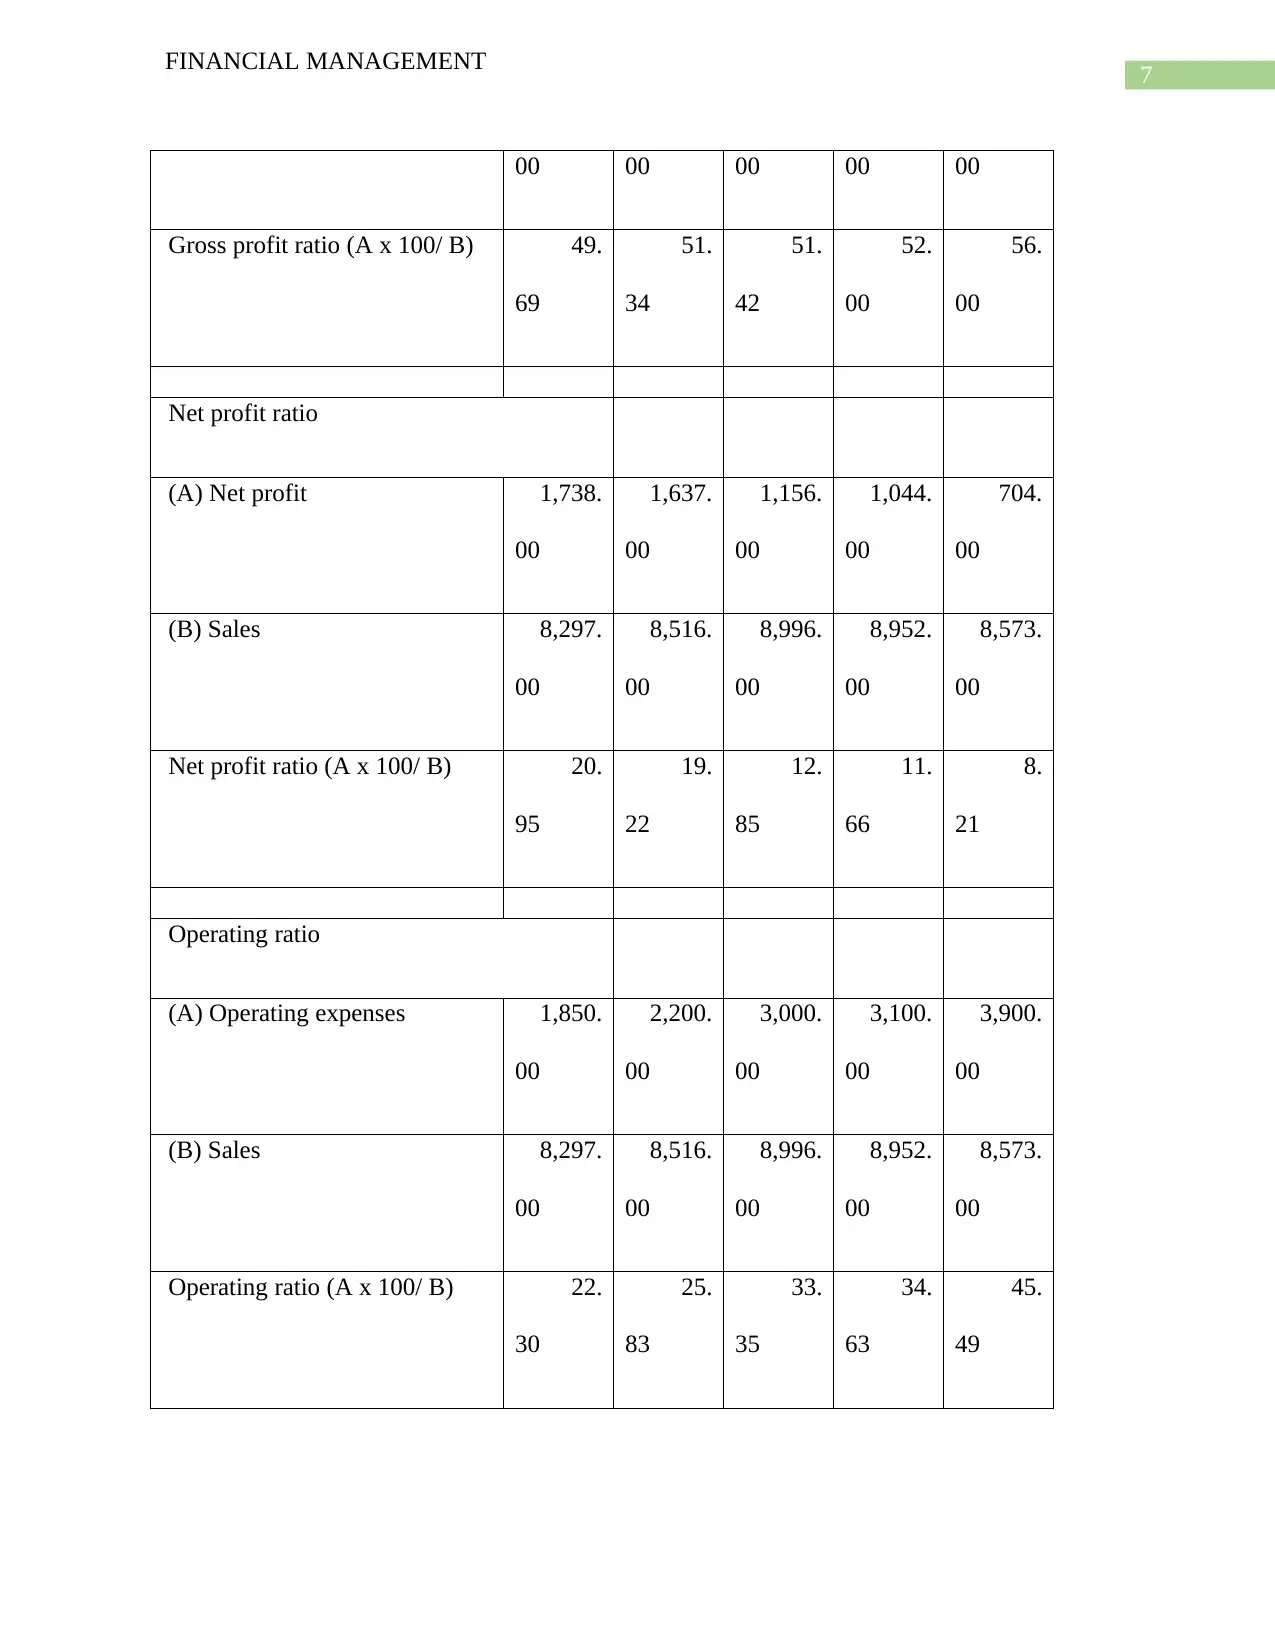
This report presents a comprehensive financial analysis of Canada Hardware (CHI). It begins with a SWOT analysis, evaluating the company's internal strengths and weaknesses, and external opportunities and threats. The report then delves into a detailed ratio analysis, covering solvency, liquidity, and profitability ratios from 2013 to 2017, with interpretations of each. The analysis assesses the company's debt-to-equity, capital gearing, interest coverage, current, quick, gross profit, net profit, and operating ratios. Furthermore, the report evaluates distribution and acquisition proposals, offering recommendations for future financial strategies, particularly focusing on online and digital platform investments. Finally, it includes a CCA (Capital Cost Allowance) schedule, analyzing depreciation, terminal loss, tax savings, and the calculation of the average tax rate, providing a complete overview of CHI's financial position and strategic recommendations.

Running head: FINANCIAL MANAGEMENT
Financial Management
Name of the Student:
Name of the University:
Authors Note:
Financial Management
Name of the Student:
Name of the University:
Authors Note:
Paraphrase This Document
Need a fresh take? Get an instant paraphrase of this document with our AI Paraphraser

1
FINANCIAL MANAGEMENT
Contents
Answer 2:.........................................................................................................................................2
Answer 3:.........................................................................................................................................3
Solvency ratios:...........................................................................................................................3
Liquidity ratios:...........................................................................................................................5
Profitability ratios:.......................................................................................................................7
Interpretation of ratios:................................................................................................................8
Answer 4:.........................................................................................................................................9
Evaluation of distribution proposal:............................................................................................9
Evaluation of restaurant acquisition:.........................................................................................10
Recommendation along with reasoning:...................................................................................10
Answer 6:.......................................................................................................................................10
References:....................................................................................................................................14

2
FINANCIAL MANAGEMENT
Answer 2:
SWOT analysis is the concept of analysis the relevant strengths, weaknesses, opportunities and
threat to an organization. Strengths and weaknesses are internal to an organization thus, an
organization has significant control to enhance its strengths and improve its area of weaknesses.
However, opportunities and threats are external and beyond control of the organization but by
proper management of an organization these can be used in favour of the organization. In case of
Canada Hardware (CHI) the SWOT analysis is provided below.
Strengths:
I. Huge goodwill and reputation of the company in national market.
II. The company has specific knowledge about customers’ preference and choices in
regional market.
III. Diversification of business by proper acquisition management.
IV. Ability to keep the management team of acquired companies intact to use their
experience for management of different business segments.
V. Ability of develop its own products ("An Assessment of Effective Risk Management
Strategies on Project Supply Chain in Kwale County – Kenya", 2018).
Weaknesses:
I. Inability of the company to expand its business beyond the domestic market.
II. Inability of the company to attract new customers from millennial and gen Z segment.
III. Failure of the company to use modern day marketing and promotional strategy to
promote its products and services.
⊘ This is a preview!⊘
Do you want full access?
Subscribe today to unlock all pages.

Trusted by 1+ million students worldwide

3
FINANCIAL MANAGEMENT
Opportunities:
I. Strategic opportunities available in Canadian market to operate in strategic
partnership to improve the ability of the company to generate more revenue.
II. Use of aggressive promotional and marketing strategies including social networking
sites and other modern day marketing techniques to attract new customers.
III. Utilize the huge scope of online and digital marketing platform.
Threats:
I. Reduction in gross profit of the company.
II. High promotional costs may not yield the expected benefits in the future.
III. Changing customer preferences to shop using online and digital platform pose a huge
threat to the traditional way of shopping by visiting stores (Chu & Chiu, 2013).
Mission statement intent:
I. Provide customers top quality products and services.
II. Maximize the wealth of the shareholders.
Mission statement alignment:
I. Having more than 100 shops in different corners of Canada to serve its customers properly.
II. Investment in online and digital platform to improve the quality of experience of the
customers.
Paraphrase This Document
Need a fresh take? Get an instant paraphrase of this document with our AI Paraphraser

4
FINANCIAL MANAGEMENT
Answer 3:
Solvency ratios:
Year 2013 2014 2015 2016 2017
Solvency ratios:
Debt to equity ratio
Long term debt 2,000.
00
2,000.
00
2,000.
00
2,000.
00
2,000.
00
Total equity 3,288.
00
4,855.
00
5,941.
00
6,915.
00
7,549.
00
Debt to equity ratio 0
.61
0.
41
0.
34
0
.29
0.
26
Capital gearing ratio
Total equity 3,288.
00
4,855.
00
5,941.
00
6,915.
00
7,549.
00
Fixed interest bearing securities and
debt
2,000.
00
2,000.
00
2,000.
00
2,000.
00
2,000.
00
Capital gearing ratio 1
.64
2.
43
2.
97
3
.46
3.
77

5
FINANCIAL MANAGEMENT
Interest coverage ratio
Net profit after tax plus interest
expense
1,838.
00
1,737.
00
1,256.
00
1,144.
00
804.
00
Interest expense 100.
00
100.
00
100.
00
100.
00
100.
00
Interest coverage ratio 18
.38
17.
37
12.
56
11
.44
8.
04
Liquidity ratios:
Year 2013 2014 2015 2016 2017
Current ratio:
(A): Total current assets 3,633.
00
5,030.
00
5,860.
00
7,083.
00
8,221.
00
(B): Total current liabilities 2,375.
00
2,516.
00
2,519.
00
2,418.
00
2,972.
00
Current ratio (A/B) 1
.53
2
.00
2
.33
2.
93
2
.77
Quick ratio
(A): Total current assets less 2,470. 2,530. 2,460. 2,283. 2,520.
⊘ This is a preview!⊘
Do you want full access?
Subscribe today to unlock all pages.

Trusted by 1+ million students worldwide

6
FINANCIAL MANAGEMENT
inventories 00 00 00 00 00
(B): Total current liabilities 2,375.
00
2,516.
00
2,519.
00
2,418.
00
2,972.
00
Quick ratio (A/B) 1
.04
1
.01
0
.98
0.
94
0
.85
Interest coverage ratio
(A): Net profit after tax plus interest
expense
1,838.
00
1,737.
00
1,256.
00
1,144.
00
804.
00
(B): Interest expense 100.
00
100.
00
100.
00
100.
00
100.
00
Interest coverage ratio (A/B) 18
.38
17
.37
12
.56
11.
44
8
.04
Profitability ratios:
Year 2013 2014 2015 2016 2017
Gross profit ratio
(A) Gross profit 4,123.
00
4,372.
00
4,626.
00
4,655.
00
4,801.
00
(B) Sales 8,297. 8,516. 8,996. 8,952. 8,573.
Paraphrase This Document
Need a fresh take? Get an instant paraphrase of this document with our AI Paraphraser

7
FINANCIAL MANAGEMENT
00 00 00 00 00
Gross profit ratio (A x 100/ B) 49.
69
51.
34
51.
42
52.
00
56.
00
Net profit ratio
(A) Net profit 1,738.
00
1,637.
00
1,156.
00
1,044.
00
704.
00
(B) Sales 8,297.
00
8,516.
00
8,996.
00
8,952.
00
8,573.
00
Net profit ratio (A x 100/ B) 20.
95
19.
22
12.
85
11.
66
8.
21
Operating ratio
(A) Operating expenses 1,850.
00
2,200.
00
3,000.
00
3,100.
00
3,900.
00
(B) Sales 8,297.
00
8,516.
00
8,996.
00
8,952.
00
8,573.
00
Operating ratio (A x 100/ B) 22.
30
25.
83
33.
35
34.
63
45.
49

8
FINANCIAL MANAGEMENT
Interpretation of ratios:
Solvency ratios:
Solvency ratios show the solvency position of an organization. The debt to equity ratio shows the
proportion of long term debt of the company to its total equity. As is clear from the debt to equity
ratio that the company’s total debt proportion has reduced over the years. Capital gearing ratio
shows the proportion of owners’ equity with the total interest bearing funds of an organization.
Company’s owners’ equity has continued to increase signifies the improved solvency position of
the company over the years. Interest coverage ratio shows the ability of an organization to pay its
interest expenses from the net profit of the company. The company’s interest coverage ratio with
18.38 times in 2013 has deteriorated immensely in by the end of 2017 with 8.04 times.
Liquidity ratios:
Current ratio shows the ability of an organization to pay its current liabilities by using current
assets only. Quick ratio on the other hand shows the ability of the company to pay its current
liabilities by using its liquid assets such as cash and accounts receivable only. Though current
ratio of the company has improved over the last five years as it stood at 2.77 in 2017 however,
quick ratio has deteriorated suggesting increase in proportion of inventories in the current assets
of the company over the years.
Profitability ratios:
Profitability ratio shows the profitability of an organization. Gross profit ratio of CHI has
increased each year suggesting significant improvement in the ability of the company to use its
raw material san labor in business operations. In 2017 the gross margin of the company is 56%
compared to 49.69% of 2013. However, both net profit and operating ratio of the company
⊘ This is a preview!⊘
Do you want full access?
Subscribe today to unlock all pages.

Trusted by 1+ million students worldwide

9
FINANCIAL MANAGEMENT
indicate that the ability of the company to generate net income has reduced significantly. Net
profit ratio in 2017 is 8.21% merely where as it was as high as 20.95% in 2013. The reason for
the lack of profitability of the company is the ever increasing operating expenses which is clearly
indicated in the increasing operation ratio of the company (Gerasimov & Novikova, 2016).
Answer 4:
Evaluation of distribution proposal:
The company has a strong acquisition system in place. As a result it has over the years acquired
different businesses to diversify its business operations to expand its revenue collection sources.
The company currently operating in three segments, namely hardware, apparel and sporting
goods. The company has more than 100 stores in all across Canada to sale its products. In fact
the company has ensured that each province in Canada shall have a store of the company to sale
its products to the customers. In addition the company has decided to experiment with strategic
partnership. By partnering NHL the company has sold more sporting jerseys to the customers.
Evaluation of restaurant acquisition:
Acquisition of restaurant is a proposed idea and if materialized has the potential to increase the
ability of the company to generate revenue from business. The shopper who will visit the stores
will have a great experience by using the services of attached restaurant. Thus, the proposal of
acquisition of restaurant is a great business idea with potential to provide significant return to the
company in the future (Karim & Arif‐Uz‐Zaman, 2013).
Paraphrase This Document
Need a fresh take? Get an instant paraphrase of this document with our AI Paraphraser

10
FINANCIAL MANAGEMENT
Recommendation along with reasoning:
Thus, at present the company has an effective distribution system in place however, looking at
the future of traditional market the company has planned to invest huge amount of fund in digital
and online infrastructure. With the future of shopping very much riding on the ability of an
organization to make effective use of digital and online platform the proposal to invest on the
given distribution proposal is very encouraging for the company and its business prospect in the
future. Hence, the company should invest in online and digital shopping platform to stay attract
new customers in the future along with keeping the existing customers by improving the
experience of traditional shoppers who will be visiting the stores of the company physically ("An
Assessment of Effective Risk Management Strategies on Project Supply Chain in Kwale County
– Kenya", 2018).
Answer 6:
CCA schedule:
Cost of acquisition of the asset 270000
Date of acquisition 1st January, 2015
Date of disposal 31st December, 2017
Rate of depreciation 30%
Depreciation schedule
year 2015 2016 2017

11
FINANCIAL MANAGEMENT
Written down value:
Opening WDV 270,000.00 189,000.00 132,300.00
Depreciation for the year 81,000.00 56,700.00 39,690.00
Closing WDV 189,000.00 132,300.00 92,610.00
Terminal loss:
Terminal loss Sale value $90000 Sale value $120000
Sale proceeds 90,000.00 120,000.00
Less: WDV as on 31.12.2017 92,610.00 92,610.00
Terminal (loss) / gain (2,610.00) 27,390.00
Tax savings:
Terminal loss Sale
value
$90000
Sale value
$120000
Sale proceeds 90,000
.00
120,000.
00
Less: WDV as on 31.12.2017 92,610 92,610.
⊘ This is a preview!⊘
Do you want full access?
Subscribe today to unlock all pages.

Trusted by 1+ million students worldwide
1 out of 15
Related Documents
Your All-in-One AI-Powered Toolkit for Academic Success.
+13062052269
info@desklib.com
Available 24*7 on WhatsApp / Email
Unlock your academic potential
Copyright © 2020–2025 A2Z Services. All Rights Reserved. Developed and managed by ZUCOL.


