Financial Management Report: Financial Decisions and Analysis
VerifiedAdded on 2021/06/15
|9
|1981
|17
Report
AI Summary
This financial management report delves into key financial concepts through case studies. It begins with an analysis of Home Guardian's new pest control device, utilizing Net Present Value (NPV) analysis to evaluate the project's profitability, considering initial investment, depreciation, tax rates, and salvage values. The report then examines HRE Mining Limited's financing options, comparing the weighted average cost of capital (WACC) when using equity, preference shares, and debt. The report computes the cost of equity using the Capital Asset Pricing Model (CAPM), the cost of debt, and the cost of preference shares, along with the market value of bonds. The analysis highlights the significance of WACC in risk assessment and compares it to the Internal Rate of Return (IRR) to determine project feasibility. Finally, the report discusses factors influencing short-term financing decisions, such as risk, cost, and control, providing a comprehensive overview of financial management principles.
Running head: FINANCIAL MANAGEMENT
Financial Management
Name of the Student:
Name of the University:
Author’s Note:
Financial Management
Name of the Student:
Name of the University:
Author’s Note:
Paraphrase This Document
Need a fresh take? Get an instant paraphrase of this document with our AI Paraphraser
1
FINANCIAL MANAGEMENT
Table of Contents
Answer to Question 1......................................................................................................................2
Answer to Question 2......................................................................................................................3
Requirement (a)...........................................................................................................................3
Requirement (b)...........................................................................................................................4
Requirement (c)...........................................................................................................................5
Requirement (d)...........................................................................................................................6
Requirement (e)...........................................................................................................................6
Answer to Question 3......................................................................................................................6
Reference.........................................................................................................................................8
2
FINANCIAL MANAGEMENT
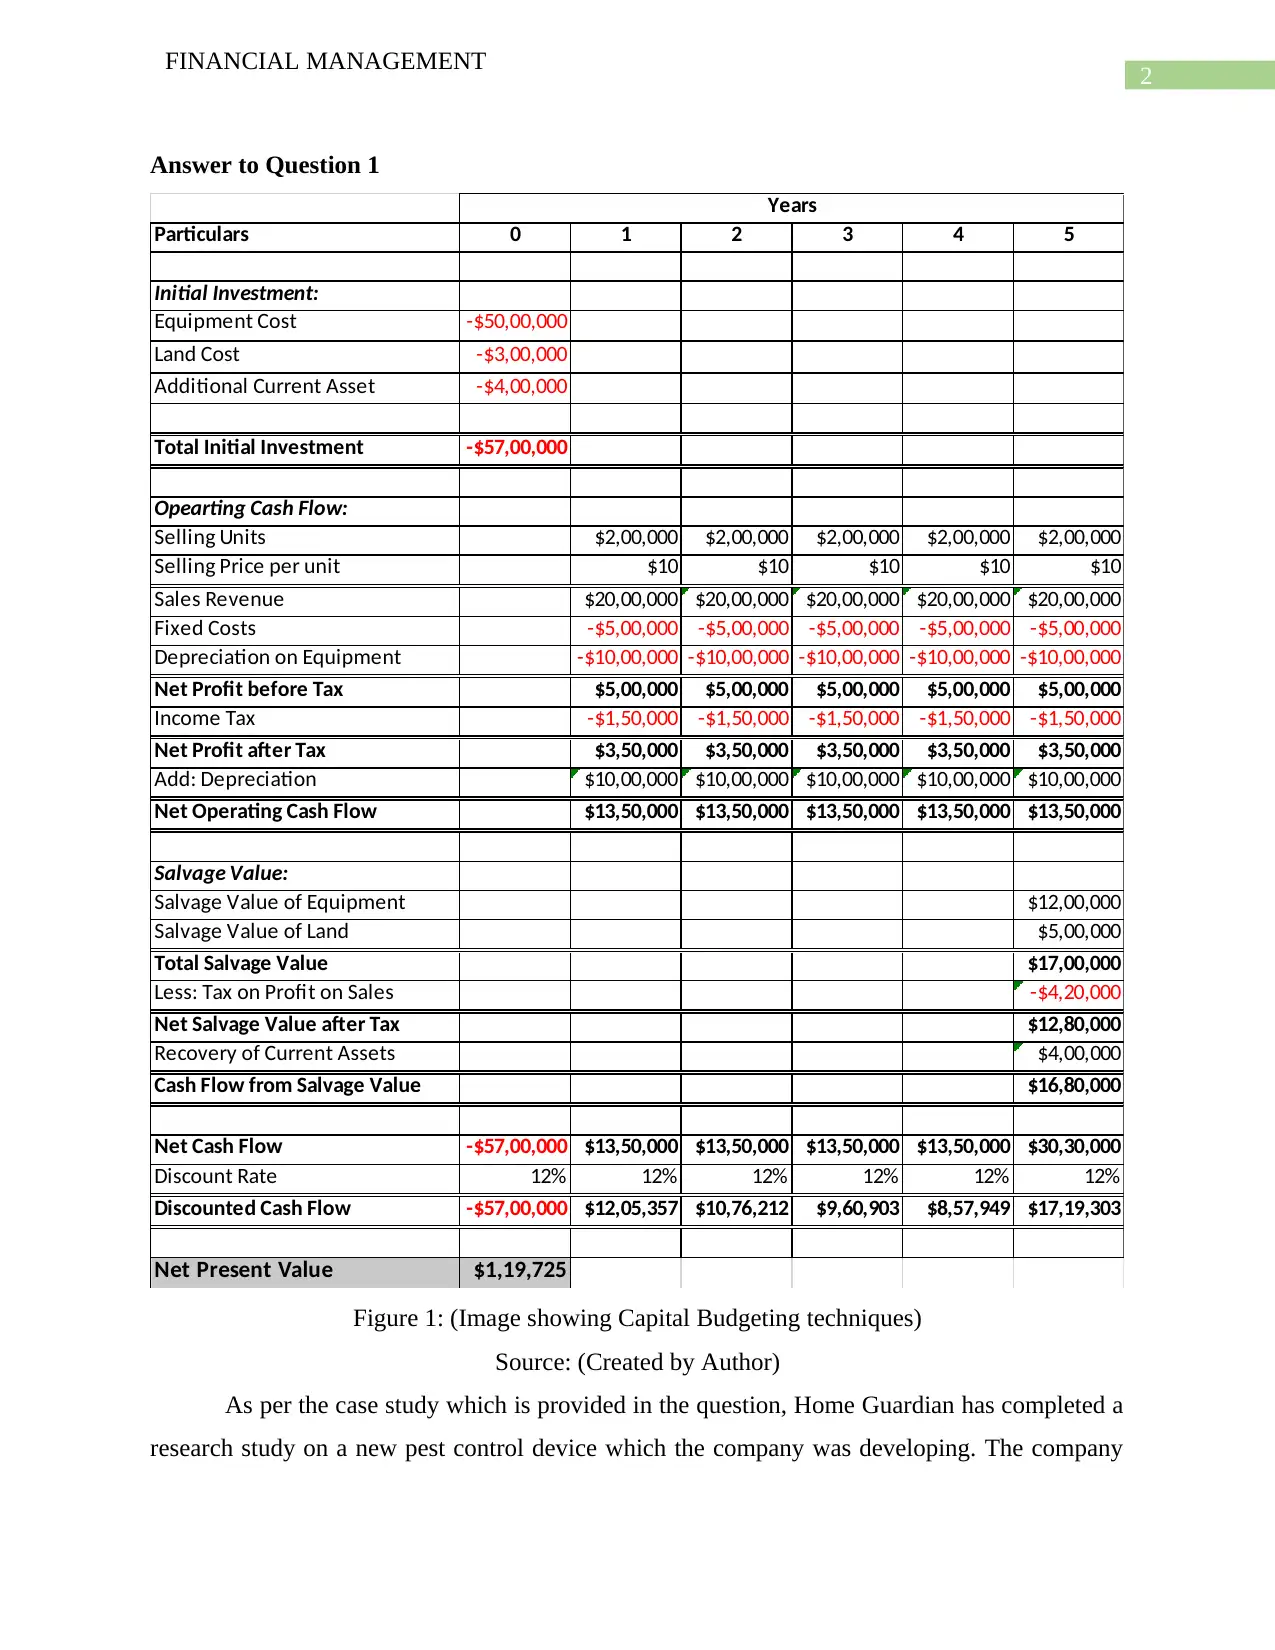
Answer to Question 1
Particulars 0 1 2 3 4 5
Initial Investment:
Equipment Cost -$50,00,000
Land Cost -$3,00,000
Additional Current Asset -$4,00,000
Total Initial Investment -$57,00,000
Opearting Cash Flow:
Selling Units $2,00,000 $2,00,000 $2,00,000 $2,00,000 $2,00,000
Selling Price per unit $10 $10 $10 $10 $10
Sales Revenue $20,00,000 $20,00,000 $20,00,000 $20,00,000 $20,00,000
Fixed Costs -$5,00,000 -$5,00,000 -$5,00,000 -$5,00,000 -$5,00,000
Depreciation on Equipment -$10,00,000 -$10,00,000 -$10,00,000 -$10,00,000 -$10,00,000
Net Profit before Tax $5,00,000 $5,00,000 $5,00,000 $5,00,000 $5,00,000
Income Tax -$1,50,000 -$1,50,000 -$1,50,000 -$1,50,000 -$1,50,000
Net Profit after Tax $3,50,000 $3,50,000 $3,50,000 $3,50,000 $3,50,000
Add: Depreciation $10,00,000 $10,00,000 $10,00,000 $10,00,000 $10,00,000
Net Operating Cash Flow $13,50,000 $13,50,000 $13,50,000 $13,50,000 $13,50,000
Salvage Value:
Salvage Value of Equipment $12,00,000
Salvage Value of Land $5,00,000
Total Salvage Value $17,00,000
Less: Tax on Profit on Sales -$4,20,000
Net Salvage Value after Tax $12,80,000
Recovery of Current Assets $4,00,000
Cash Flow from Salvage Value $16,80,000
Net Cash Flow -$57,00,000 $13,50,000 $13,50,000 $13,50,000 $13,50,000 $30,30,000
Discount Rate 12% 12% 12% 12% 12% 12%
Discounted Cash Flow -$57,00,000 $12,05,357 $10,76,212 $9,60,903 $8,57,949 $17,19,303
Net Present Value $1,19,725
Years
Figure 1: (Image showing Capital Budgeting techniques)
Source: (Created by Author)
As per the case study which is provided in the question, Home Guardian has completed a
research study on a new pest control device which the company was developing. The company
FINANCIAL MANAGEMENT
Answer to Question 1
Particulars 0 1 2 3 4 5
Initial Investment:
Equipment Cost -$50,00,000
Land Cost -$3,00,000
Additional Current Asset -$4,00,000
Total Initial Investment -$57,00,000
Opearting Cash Flow:
Selling Units $2,00,000 $2,00,000 $2,00,000 $2,00,000 $2,00,000
Selling Price per unit $10 $10 $10 $10 $10
Sales Revenue $20,00,000 $20,00,000 $20,00,000 $20,00,000 $20,00,000
Fixed Costs -$5,00,000 -$5,00,000 -$5,00,000 -$5,00,000 -$5,00,000
Depreciation on Equipment -$10,00,000 -$10,00,000 -$10,00,000 -$10,00,000 -$10,00,000
Net Profit before Tax $5,00,000 $5,00,000 $5,00,000 $5,00,000 $5,00,000
Income Tax -$1,50,000 -$1,50,000 -$1,50,000 -$1,50,000 -$1,50,000
Net Profit after Tax $3,50,000 $3,50,000 $3,50,000 $3,50,000 $3,50,000
Add: Depreciation $10,00,000 $10,00,000 $10,00,000 $10,00,000 $10,00,000
Net Operating Cash Flow $13,50,000 $13,50,000 $13,50,000 $13,50,000 $13,50,000
Salvage Value:
Salvage Value of Equipment $12,00,000
Salvage Value of Land $5,00,000
Total Salvage Value $17,00,000
Less: Tax on Profit on Sales -$4,20,000
Net Salvage Value after Tax $12,80,000
Recovery of Current Assets $4,00,000
Cash Flow from Salvage Value $16,80,000
Net Cash Flow -$57,00,000 $13,50,000 $13,50,000 $13,50,000 $13,50,000 $30,30,000
Discount Rate 12% 12% 12% 12% 12% 12%
Discounted Cash Flow -$57,00,000 $12,05,357 $10,76,212 $9,60,903 $8,57,949 $17,19,303
Net Present Value $1,19,725
Years
Figure 1: (Image showing Capital Budgeting techniques)
Source: (Created by Author)
As per the case study which is provided in the question, Home Guardian has completed a
research study on a new pest control device which the company was developing. The company
⊘ This is a preview!⊘
Do you want full access?
Subscribe today to unlock all pages.
Trusted by 1+ million students worldwide
3
FINANCIAL MANAGEMENT
can finally implement the product for production. As shown in figure 1, the initial investment
which is required to be made for the production of the new pest control device amounts to $ 5
million. It is also provided in the question that the equipment is to be depreciated over the useful
of 5 years until the value becomes zero. The tax rate which is considered for the analysis is 30%.
As per the calculation which is shown in the above table, the management has applied
NPV analysis for the purpose of reviewing whether the production of the new product which the
business wants to undertake is favorable or not. NPV analysis is conducted when the business
wants to ident6ify the future discounted cash inflow which can be earned from the project
(Ognjenovic et al., 2016). The discounting rate and the tax rate which are considered for the
purpose of computing the NPV of the production option are 12% and 30% respectively. The
analysis is for a period of five years at the end of which the company will receive the salvage
value of the equipment and land which amounts to $ 12,00,000 and $ 5,00,000 respectively. The
company will also able to recover a portion of the current asset which was employed in the
production process. As shown in figure 1, the NPV of the project comes to about $ 1,19,725
which shows that the company can expect profit in future and also steady cash inflows as well,
therefore the company must invest in the project.
Answer to Question 2
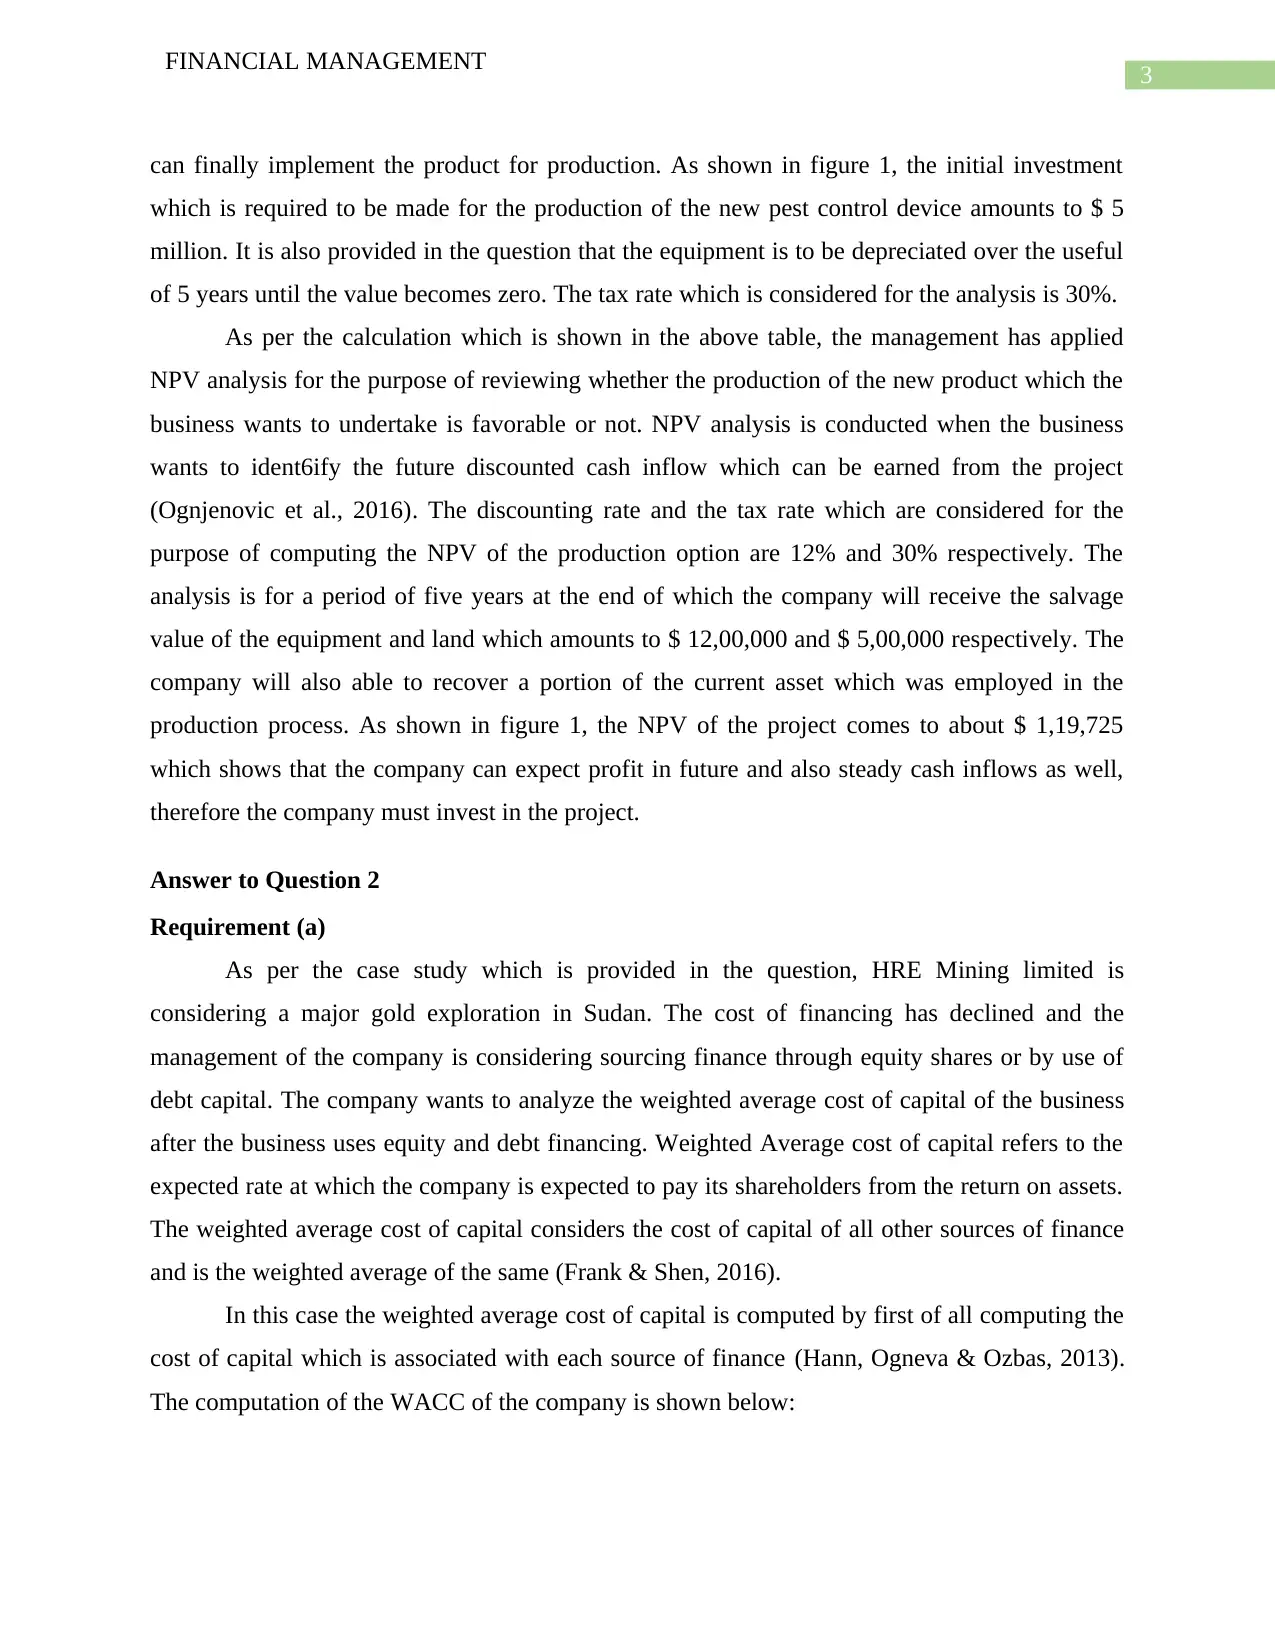
Requirement (a)
As per the case study which is provided in the question, HRE Mining limited is
considering a major gold exploration in Sudan. The cost of financing has declined and the
management of the company is considering sourcing finance through equity shares or by use of
debt capital. The company wants to analyze the weighted average cost of capital of the business
after the business uses equity and debt financing. Weighted Average cost of capital refers to the
expected rate at which the company is expected to pay its shareholders from the return on assets.
The weighted average cost of capital considers the cost of capital of all other sources of finance
and is the weighted average of the same (Frank & Shen, 2016).
In this case the weighted average cost of capital is computed by first of all computing the
cost of capital which is associated with each source of finance (Hann, Ogneva & Ozbas, 2013).
The computation of the WACC of the company is shown below:
FINANCIAL MANAGEMENT
can finally implement the product for production. As shown in figure 1, the initial investment
which is required to be made for the production of the new pest control device amounts to $ 5
million. It is also provided in the question that the equipment is to be depreciated over the useful
of 5 years until the value becomes zero. The tax rate which is considered for the analysis is 30%.
As per the calculation which is shown in the above table, the management has applied
NPV analysis for the purpose of reviewing whether the production of the new product which the
business wants to undertake is favorable or not. NPV analysis is conducted when the business
wants to ident6ify the future discounted cash inflow which can be earned from the project
(Ognjenovic et al., 2016). The discounting rate and the tax rate which are considered for the
purpose of computing the NPV of the production option are 12% and 30% respectively. The
analysis is for a period of five years at the end of which the company will receive the salvage
value of the equipment and land which amounts to $ 12,00,000 and $ 5,00,000 respectively. The
company will also able to recover a portion of the current asset which was employed in the
production process. As shown in figure 1, the NPV of the project comes to about $ 1,19,725
which shows that the company can expect profit in future and also steady cash inflows as well,
therefore the company must invest in the project.
Answer to Question 2
Requirement (a)
As per the case study which is provided in the question, HRE Mining limited is
considering a major gold exploration in Sudan. The cost of financing has declined and the
management of the company is considering sourcing finance through equity shares or by use of
debt capital. The company wants to analyze the weighted average cost of capital of the business
after the business uses equity and debt financing. Weighted Average cost of capital refers to the
expected rate at which the company is expected to pay its shareholders from the return on assets.
The weighted average cost of capital considers the cost of capital of all other sources of finance
and is the weighted average of the same (Frank & Shen, 2016).
In this case the weighted average cost of capital is computed by first of all computing the
cost of capital which is associated with each source of finance (Hann, Ogneva & Ozbas, 2013).
The computation of the WACC of the company is shown below:
Paraphrase This Document
Need a fresh take? Get an instant paraphrase of this document with our AI Paraphraser
4
FINANCIAL MANAGEMENT
Particulars Amount Weight
After-Tax
Cost
Weighted Cost of
Capital
Debt $806,61,804 81.76% 10.50% 8.58%
Preference Shares $30,00,000 3.04% 8.42% 0.26%
Equity Shares $150,00,000 15.20% 20.80% 3.16%
TOTAL $986,61,804 100% 12.00%
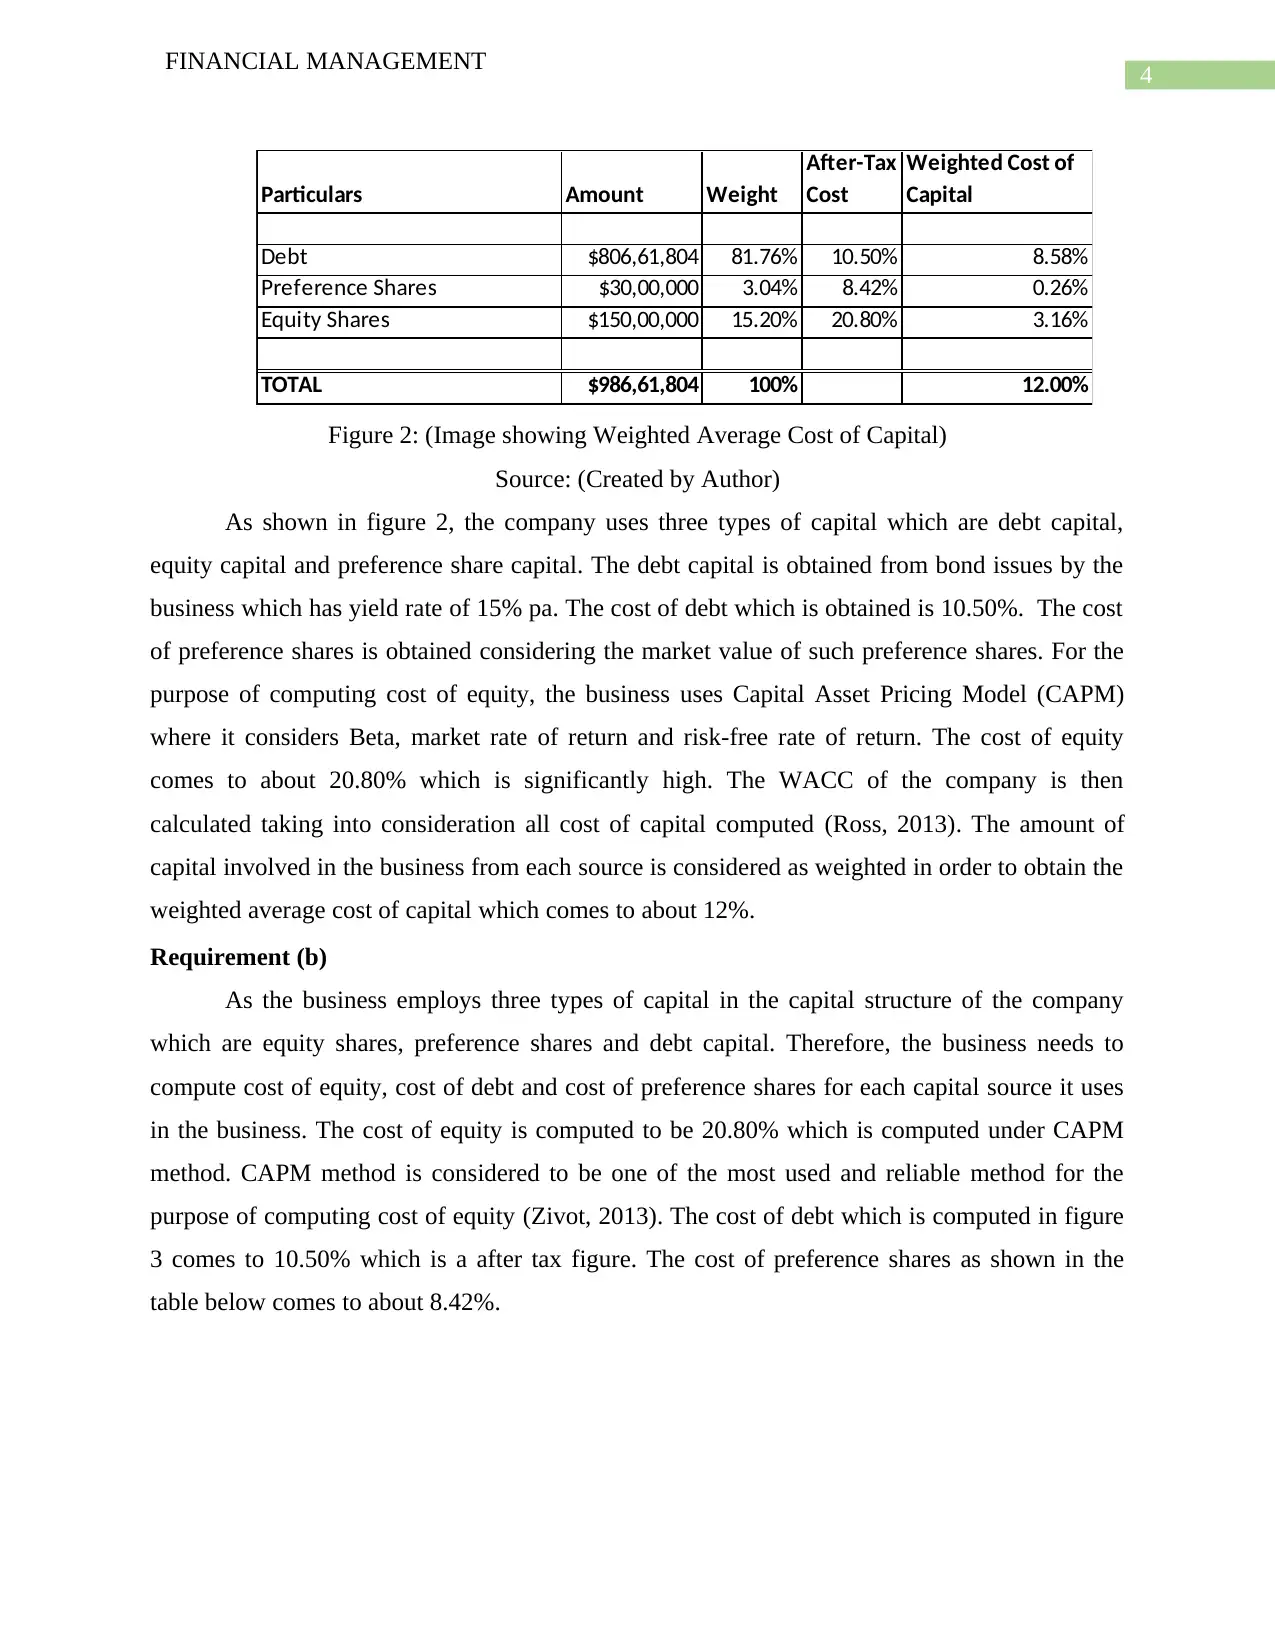
Figure 2: (Image showing Weighted Average Cost of Capital)
Source: (Created by Author)
As shown in figure 2, the company uses three types of capital which are debt capital,
equity capital and preference share capital. The debt capital is obtained from bond issues by the
business which has yield rate of 15% pa. The cost of debt which is obtained is 10.50%. The cost
of preference shares is obtained considering the market value of such preference shares. For the
purpose of computing cost of equity, the business uses Capital Asset Pricing Model (CAPM)
where it considers Beta, market rate of return and risk-free rate of return. The cost of equity
comes to about 20.80% which is significantly high. The WACC of the company is then
calculated taking into consideration all cost of capital computed (Ross, 2013). The amount of
capital involved in the business from each source is considered as weighted in order to obtain the
weighted average cost of capital which comes to about 12%.
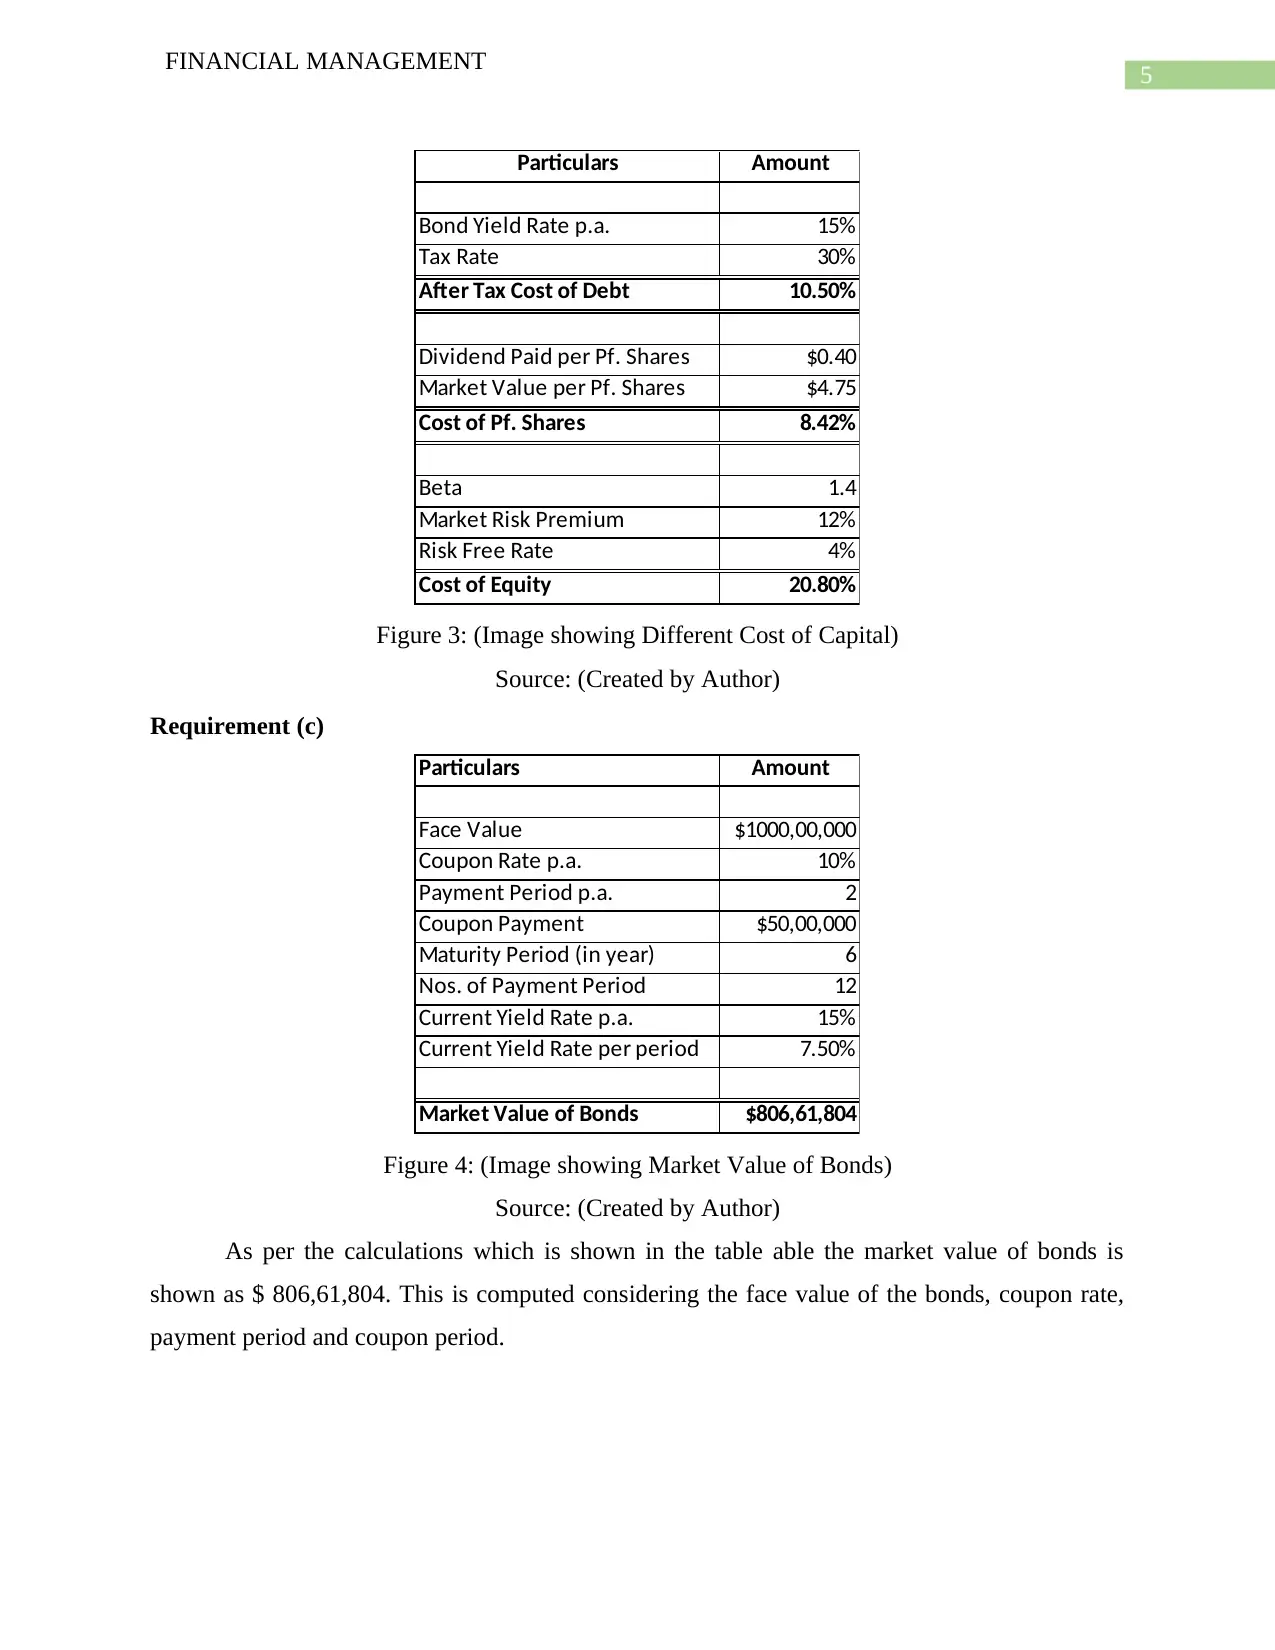
Requirement (b)
As the business employs three types of capital in the capital structure of the company
which are equity shares, preference shares and debt capital. Therefore, the business needs to
compute cost of equity, cost of debt and cost of preference shares for each capital source it uses
in the business. The cost of equity is computed to be 20.80% which is computed under CAPM
method. CAPM method is considered to be one of the most used and reliable method for the
purpose of computing cost of equity (Zivot, 2013). The cost of debt which is computed in figure
3 comes to 10.50% which is a after tax figure. The cost of preference shares as shown in the
table below comes to about 8.42%.
FINANCIAL MANAGEMENT
Particulars Amount Weight
After-Tax
Cost
Weighted Cost of
Capital
Debt $806,61,804 81.76% 10.50% 8.58%
Preference Shares $30,00,000 3.04% 8.42% 0.26%
Equity Shares $150,00,000 15.20% 20.80% 3.16%
TOTAL $986,61,804 100% 12.00%
Figure 2: (Image showing Weighted Average Cost of Capital)
Source: (Created by Author)
As shown in figure 2, the company uses three types of capital which are debt capital,
equity capital and preference share capital. The debt capital is obtained from bond issues by the
business which has yield rate of 15% pa. The cost of debt which is obtained is 10.50%. The cost
of preference shares is obtained considering the market value of such preference shares. For the
purpose of computing cost of equity, the business uses Capital Asset Pricing Model (CAPM)
where it considers Beta, market rate of return and risk-free rate of return. The cost of equity
comes to about 20.80% which is significantly high. The WACC of the company is then
calculated taking into consideration all cost of capital computed (Ross, 2013). The amount of
capital involved in the business from each source is considered as weighted in order to obtain the
weighted average cost of capital which comes to about 12%.
Requirement (b)
As the business employs three types of capital in the capital structure of the company
which are equity shares, preference shares and debt capital. Therefore, the business needs to
compute cost of equity, cost of debt and cost of preference shares for each capital source it uses
in the business. The cost of equity is computed to be 20.80% which is computed under CAPM
method. CAPM method is considered to be one of the most used and reliable method for the
purpose of computing cost of equity (Zivot, 2013). The cost of debt which is computed in figure
3 comes to 10.50% which is a after tax figure. The cost of preference shares as shown in the
table below comes to about 8.42%.
5
FINANCIAL MANAGEMENT
Particulars Amount
Bond Yield Rate p.a. 15%
Tax Rate 30%
After Tax Cost of Debt 10.50%
Dividend Paid per Pf. Shares $0.40
Market Value per Pf. Shares $4.75
Cost of Pf. Shares 8.42%
Beta 1.4
Market Risk Premium 12%
Risk Free Rate 4%
Cost of Equity 20.80%
Figure 3: (Image showing Different Cost of Capital)
Source: (Created by Author)
Requirement (c)
Particulars Amount
Face Value $1000,00,000
Coupon Rate p.a. 10%
Payment Period p.a. 2
Coupon Payment $50,00,000
Maturity Period (in year) 6
Nos. of Payment Period 12
Current Yield Rate p.a. 15%
Current Yield Rate per period 7.50%
Market Value of Bonds $806,61,804
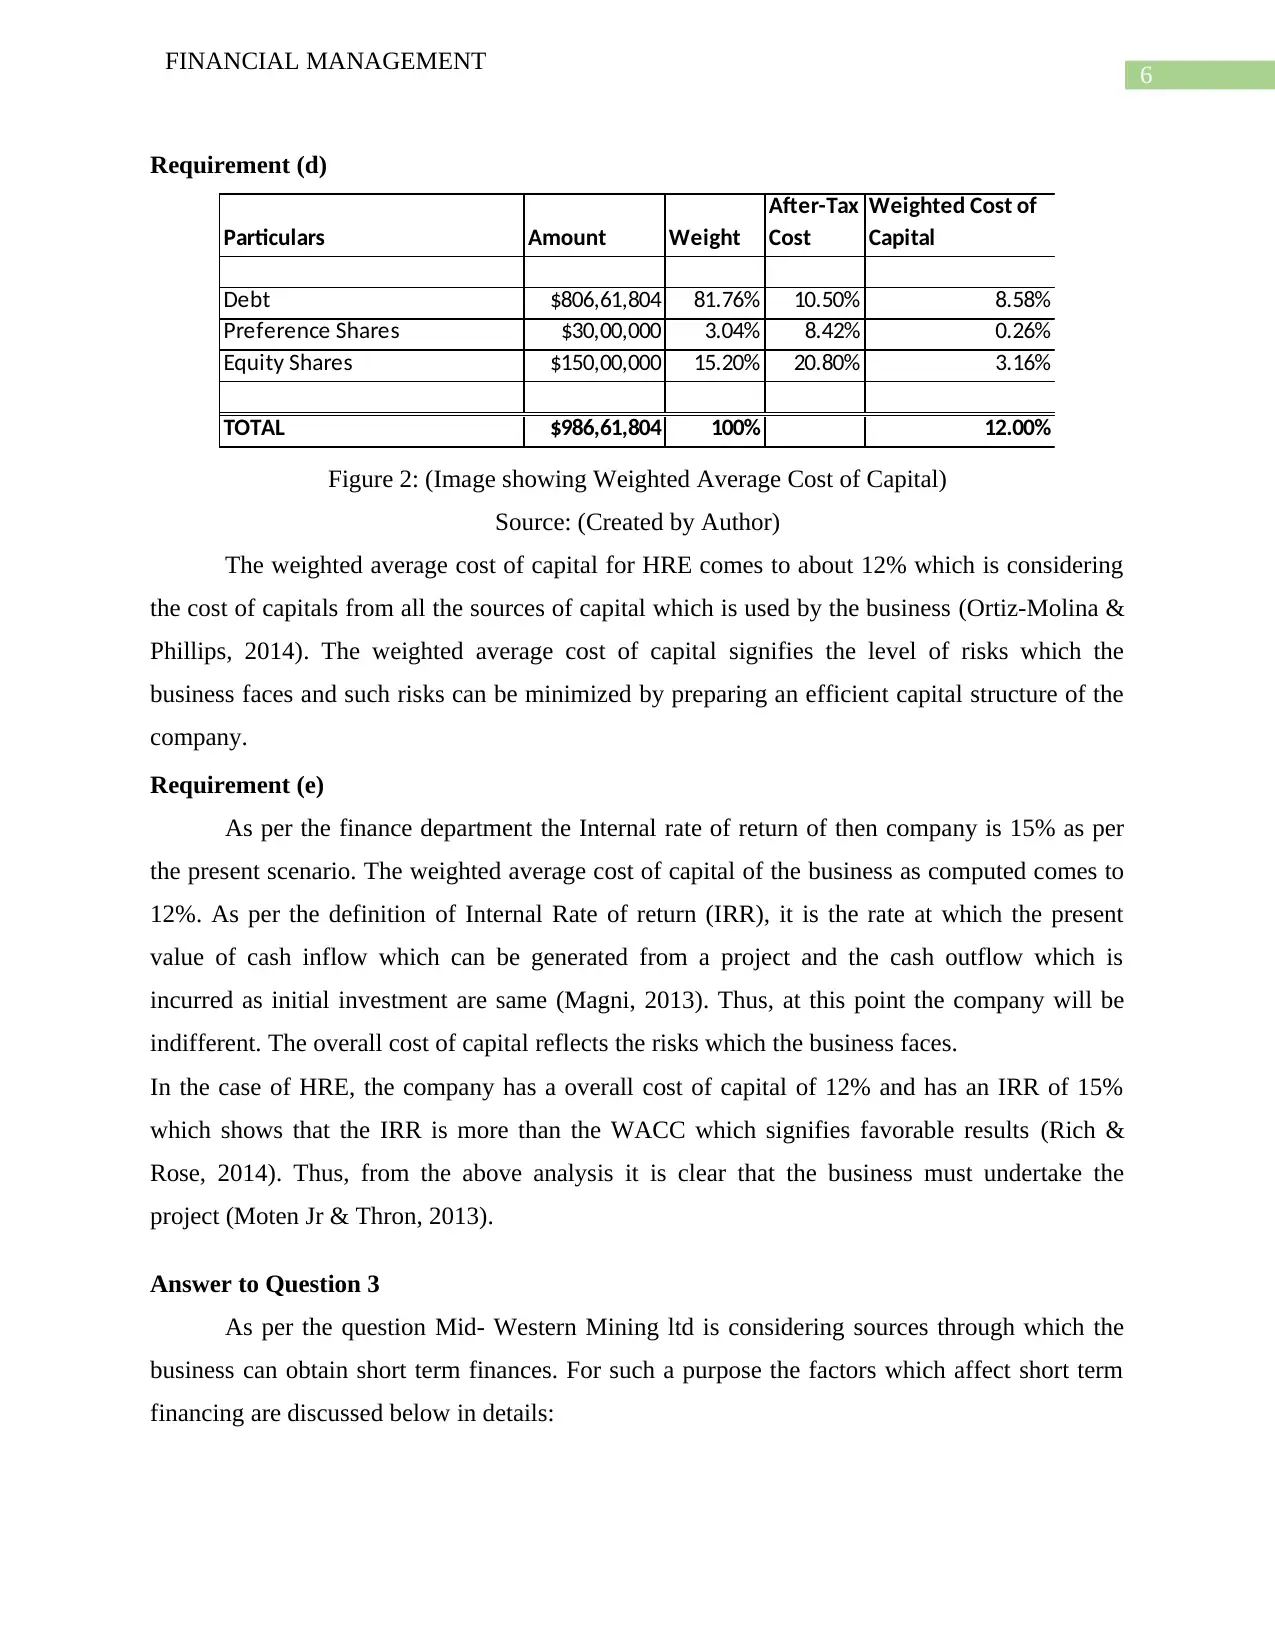
Figure 4: (Image showing Market Value of Bonds)
Source: (Created by Author)
As per the calculations which is shown in the table able the market value of bonds is
shown as $ 806,61,804. This is computed considering the face value of the bonds, coupon rate,
payment period and coupon period.
FINANCIAL MANAGEMENT
Particulars Amount
Bond Yield Rate p.a. 15%
Tax Rate 30%
After Tax Cost of Debt 10.50%
Dividend Paid per Pf. Shares $0.40
Market Value per Pf. Shares $4.75
Cost of Pf. Shares 8.42%
Beta 1.4
Market Risk Premium 12%
Risk Free Rate 4%
Cost of Equity 20.80%
Figure 3: (Image showing Different Cost of Capital)
Source: (Created by Author)
Requirement (c)
Particulars Amount
Face Value $1000,00,000
Coupon Rate p.a. 10%
Payment Period p.a. 2
Coupon Payment $50,00,000
Maturity Period (in year) 6
Nos. of Payment Period 12
Current Yield Rate p.a. 15%
Current Yield Rate per period 7.50%
Market Value of Bonds $806,61,804
Figure 4: (Image showing Market Value of Bonds)
Source: (Created by Author)
As per the calculations which is shown in the table able the market value of bonds is
shown as $ 806,61,804. This is computed considering the face value of the bonds, coupon rate,
payment period and coupon period.
⊘ This is a preview!⊘
Do you want full access?
Subscribe today to unlock all pages.
Trusted by 1+ million students worldwide
6
FINANCIAL MANAGEMENT
Requirement (d)
Particulars Amount Weight
After-Tax
Cost
Weighted Cost of
Capital
Debt $806,61,804 81.76% 10.50% 8.58%
Preference Shares $30,00,000 3.04% 8.42% 0.26%
Equity Shares $150,00,000 15.20% 20.80% 3.16%
TOTAL $986,61,804 100% 12.00%
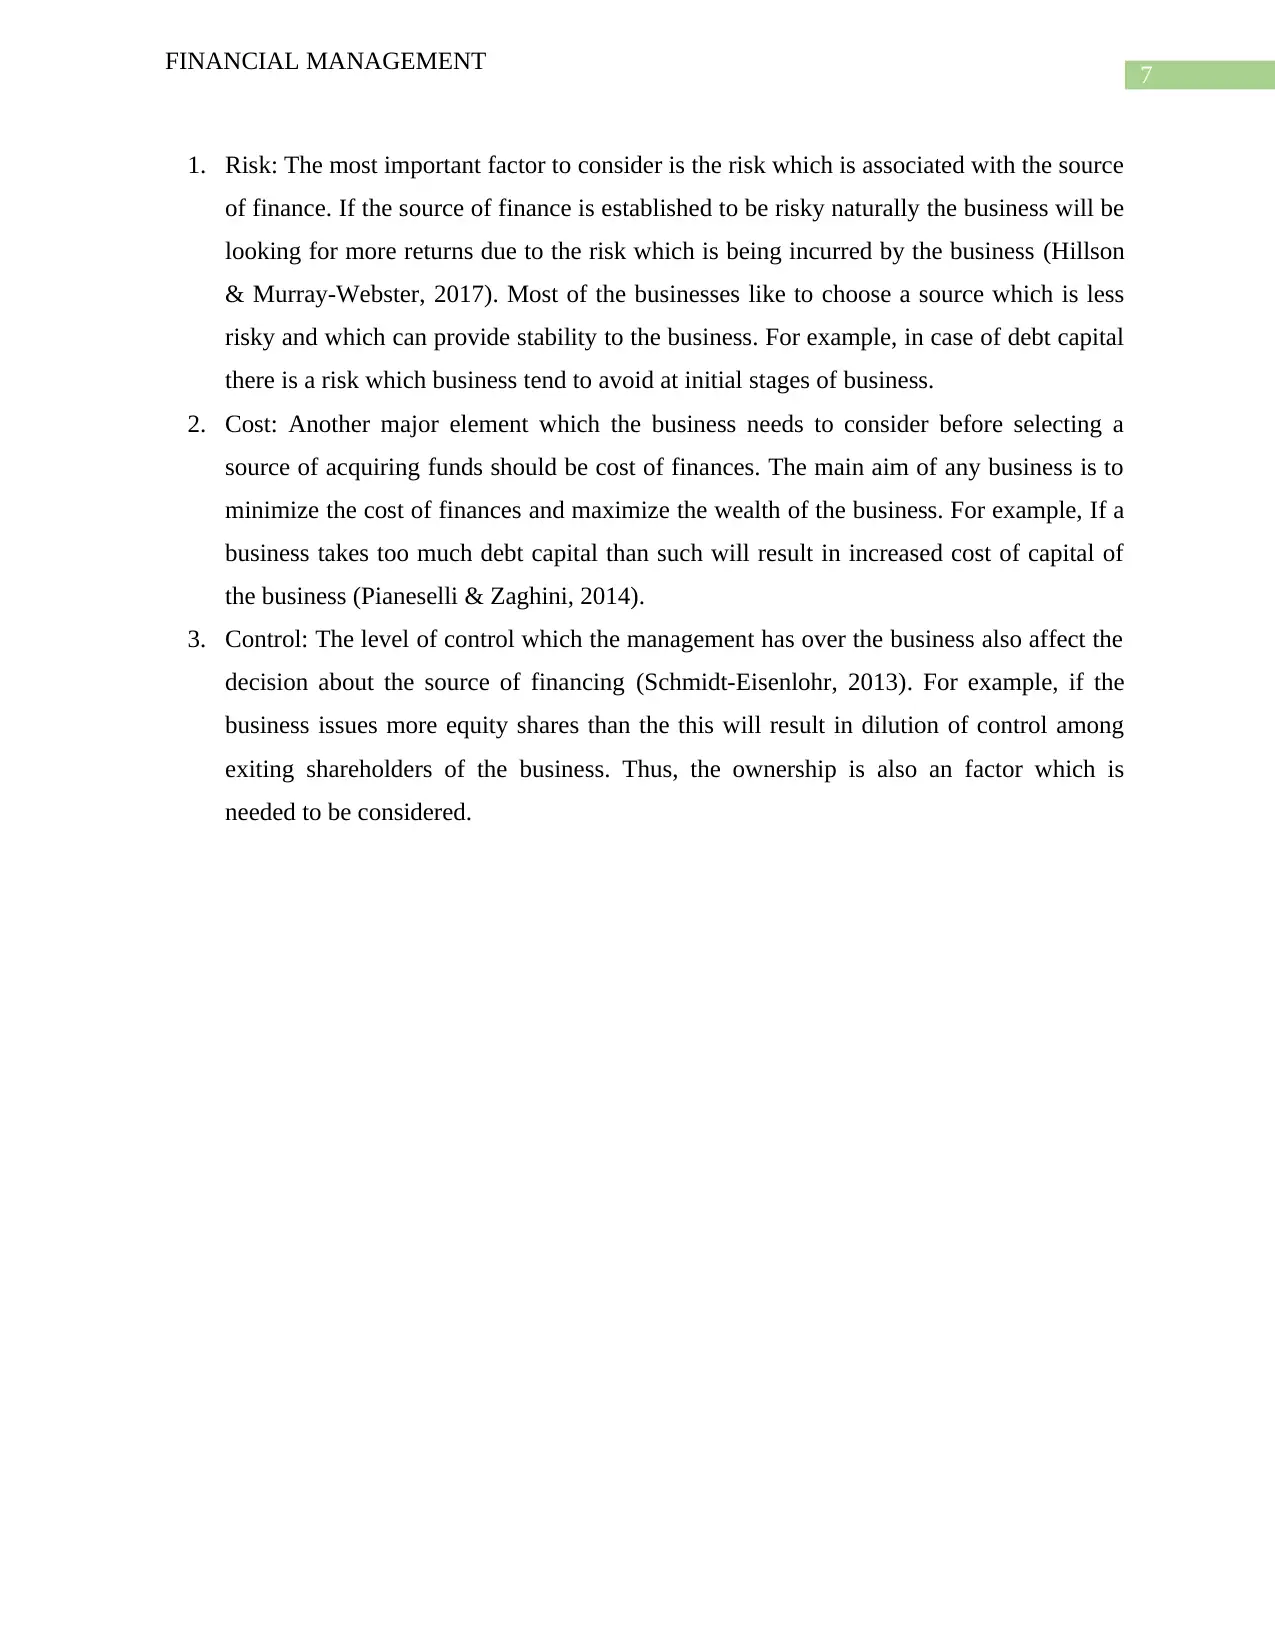
Figure 2: (Image showing Weighted Average Cost of Capital)
Source: (Created by Author)
The weighted average cost of capital for HRE comes to about 12% which is considering
the cost of capitals from all the sources of capital which is used by the business (Ortiz-Molina &
Phillips, 2014). The weighted average cost of capital signifies the level of risks which the
business faces and such risks can be minimized by preparing an efficient capital structure of the
company.
Requirement (e)
As per the finance department the Internal rate of return of then company is 15% as per
the present scenario. The weighted average cost of capital of the business as computed comes to
12%. As per the definition of Internal Rate of return (IRR), it is the rate at which the present
value of cash inflow which can be generated from a project and the cash outflow which is
incurred as initial investment are same (Magni, 2013). Thus, at this point the company will be
indifferent. The overall cost of capital reflects the risks which the business faces.
In the case of HRE, the company has a overall cost of capital of 12% and has an IRR of 15%
which shows that the IRR is more than the WACC which signifies favorable results (Rich &
Rose, 2014). Thus, from the above analysis it is clear that the business must undertake the
project (Moten Jr & Thron, 2013).
Answer to Question 3
As per the question Mid- Western Mining ltd is considering sources through which the
business can obtain short term finances. For such a purpose the factors which affect short term
financing are discussed below in details:
FINANCIAL MANAGEMENT
Requirement (d)
Particulars Amount Weight
After-Tax
Cost
Weighted Cost of
Capital
Debt $806,61,804 81.76% 10.50% 8.58%
Preference Shares $30,00,000 3.04% 8.42% 0.26%
Equity Shares $150,00,000 15.20% 20.80% 3.16%
TOTAL $986,61,804 100% 12.00%
Figure 2: (Image showing Weighted Average Cost of Capital)
Source: (Created by Author)
The weighted average cost of capital for HRE comes to about 12% which is considering
the cost of capitals from all the sources of capital which is used by the business (Ortiz-Molina &
Phillips, 2014). The weighted average cost of capital signifies the level of risks which the
business faces and such risks can be minimized by preparing an efficient capital structure of the
company.
Requirement (e)
As per the finance department the Internal rate of return of then company is 15% as per
the present scenario. The weighted average cost of capital of the business as computed comes to
12%. As per the definition of Internal Rate of return (IRR), it is the rate at which the present
value of cash inflow which can be generated from a project and the cash outflow which is
incurred as initial investment are same (Magni, 2013). Thus, at this point the company will be
indifferent. The overall cost of capital reflects the risks which the business faces.
In the case of HRE, the company has a overall cost of capital of 12% and has an IRR of 15%
which shows that the IRR is more than the WACC which signifies favorable results (Rich &
Rose, 2014). Thus, from the above analysis it is clear that the business must undertake the
project (Moten Jr & Thron, 2013).
Answer to Question 3
As per the question Mid- Western Mining ltd is considering sources through which the
business can obtain short term finances. For such a purpose the factors which affect short term
financing are discussed below in details:
Paraphrase This Document
Need a fresh take? Get an instant paraphrase of this document with our AI Paraphraser
7
FINANCIAL MANAGEMENT
1. Risk: The most important factor to consider is the risk which is associated with the source
of finance. If the source of finance is established to be risky naturally the business will be
looking for more returns due to the risk which is being incurred by the business (Hillson
& Murray-Webster, 2017). Most of the businesses like to choose a source which is less
risky and which can provide stability to the business. For example, in case of debt capital
there is a risk which business tend to avoid at initial stages of business.
2. Cost: Another major element which the business needs to consider before selecting a
source of acquiring funds should be cost of finances. The main aim of any business is to
minimize the cost of finances and maximize the wealth of the business. For example, If a
business takes too much debt capital than such will result in increased cost of capital of
the business (Pianeselli & Zaghini, 2014).
3. Control: The level of control which the management has over the business also affect the
decision about the source of financing (Schmidt-Eisenlohr, 2013). For example, if the
business issues more equity shares than the this will result in dilution of control among
exiting shareholders of the business. Thus, the ownership is also an factor which is
needed to be considered.
8
FINANCIAL MANAGEMENT
Reference
Frank, M. Z., & Shen, T. (2016). Investment and the weighted average cost of capital. Journal of
Financial Economics, 119(2), 300-315.
Hann, R. N., Ogneva, M., & Ozbas, O. (2013). Corporate diversification and the cost of
capital. The journal of finance, 68(5), 1961-1999.
Hillson, D., & Murray-Webster, R. (2017). Understanding and managing risk attitude.
Routledge.
Magni, C. A. (2013). The internal rate of return approach and the AIRR paradigm: a refutation
and a corroboration. The Engineering Economist, 58(2), 73-111.
Moten Jr, J. M., & Thron, C. (2013). Improvements on secant method for estimating internal rate
of return (IRR). Int. J. Appl. Math. Stat, 42(12), 84-93.
Ognjenovic, S., Ishkov, A., Cvetkovic, D., Peric, D., & Romanovich, M. (2016). Analyses of
Costs and Benefits in the Pavement Management Systems. Procedia Engineering, 165, 954-
959.
Ortiz-Molina, H., & Phillips, G. M. (2014). Real asset illiquidity and the cost of capital. Journal
of Financial and Quantitative Analysis, 49(1), 1-32.
Pianeselli, D., & Zaghini, A. (2014). The cost of firms’ debt financing and the global financial
crisis. Finance Research Letters, 11(2), 74-83.
Rich, S. P., & Rose, J. T. (2014). Re-examining an old question: Does the IRR method implicitly
assume a reinvestment rate?. Journal of Financial Education, 152-166.
Ross, S. A. (2013). The arbitrage theory of capital asset pricing. In HANDBOOK OF THE
FUNDAMENTALS OF FINANCIAL DECISION MAKING: Part I (pp. 11-30).
Schmidt-Eisenlohr, T. (2013). Towards a theory of trade finance. Journal of International
Economics, 91(1), 96-112.
Zivot, E. (2013). Capital asset pricing model.
⊘ This is a preview!⊘
Do you want full access?
Subscribe today to unlock all pages.
Trusted by 1+ million students worldwide
1 out of 9
Related Documents


Your All-in-One AI-Powered Toolkit for Academic Success.
+13062052269
info@desklib.com
Available 24*7 on WhatsApp / Email
![[object Object]](/_next/static/media/star-bottom.7253800d.svg)
Unlock your academic potential
Copyright © 2020–2026 A2Z Services. All Rights Reserved. Developed and managed by ZUCOL.