Comprehensive Financial Management Report: Business Project Analysis

Verified

Added on  2021/05/31

|20
|3538
|310
Report
AI Summary
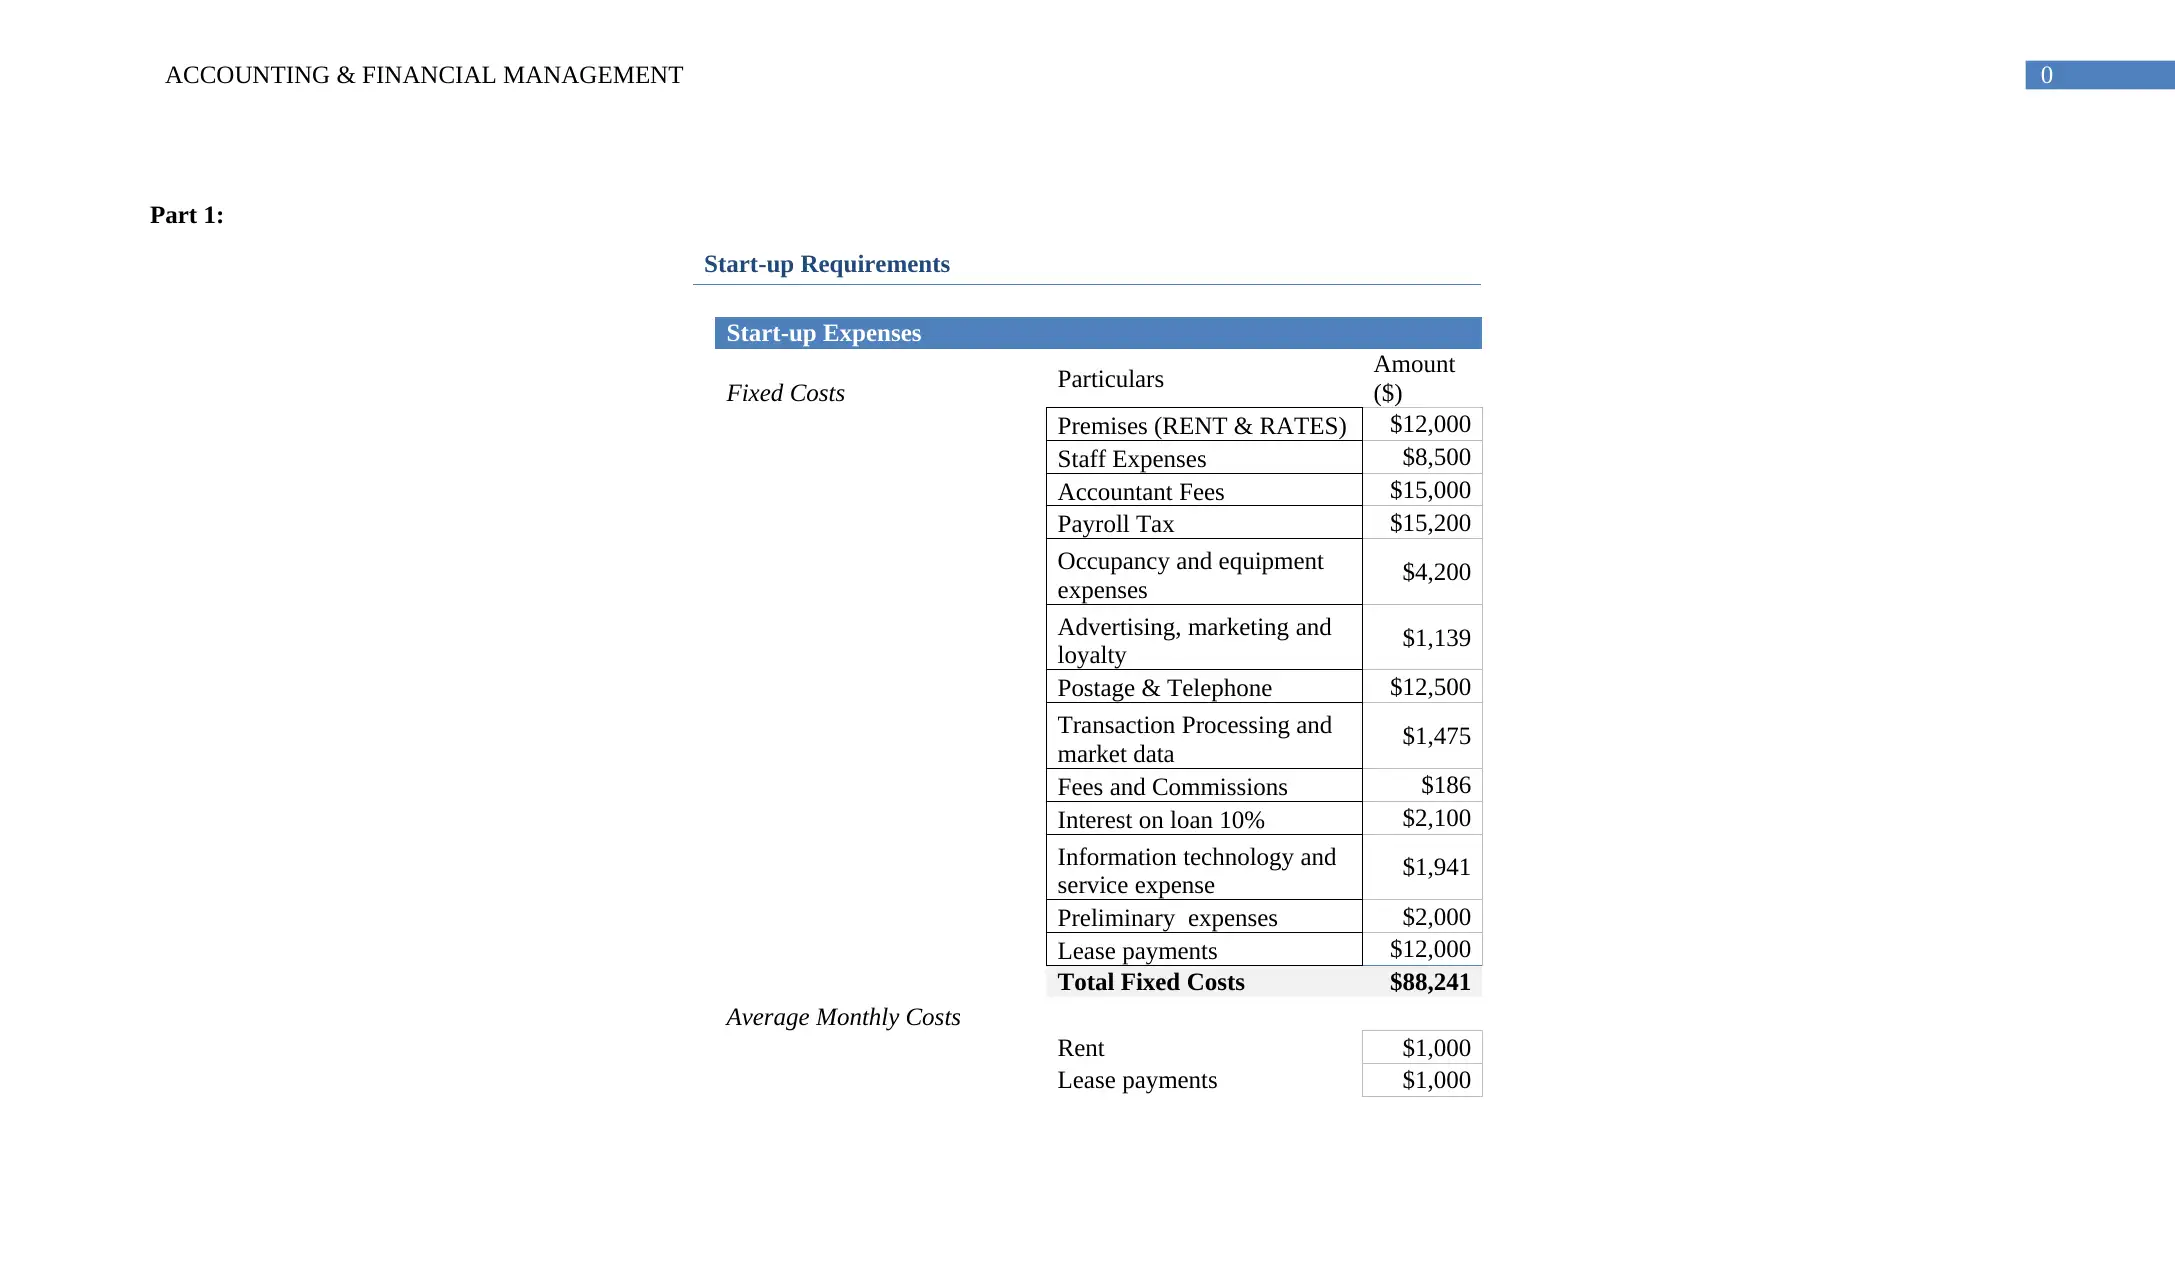
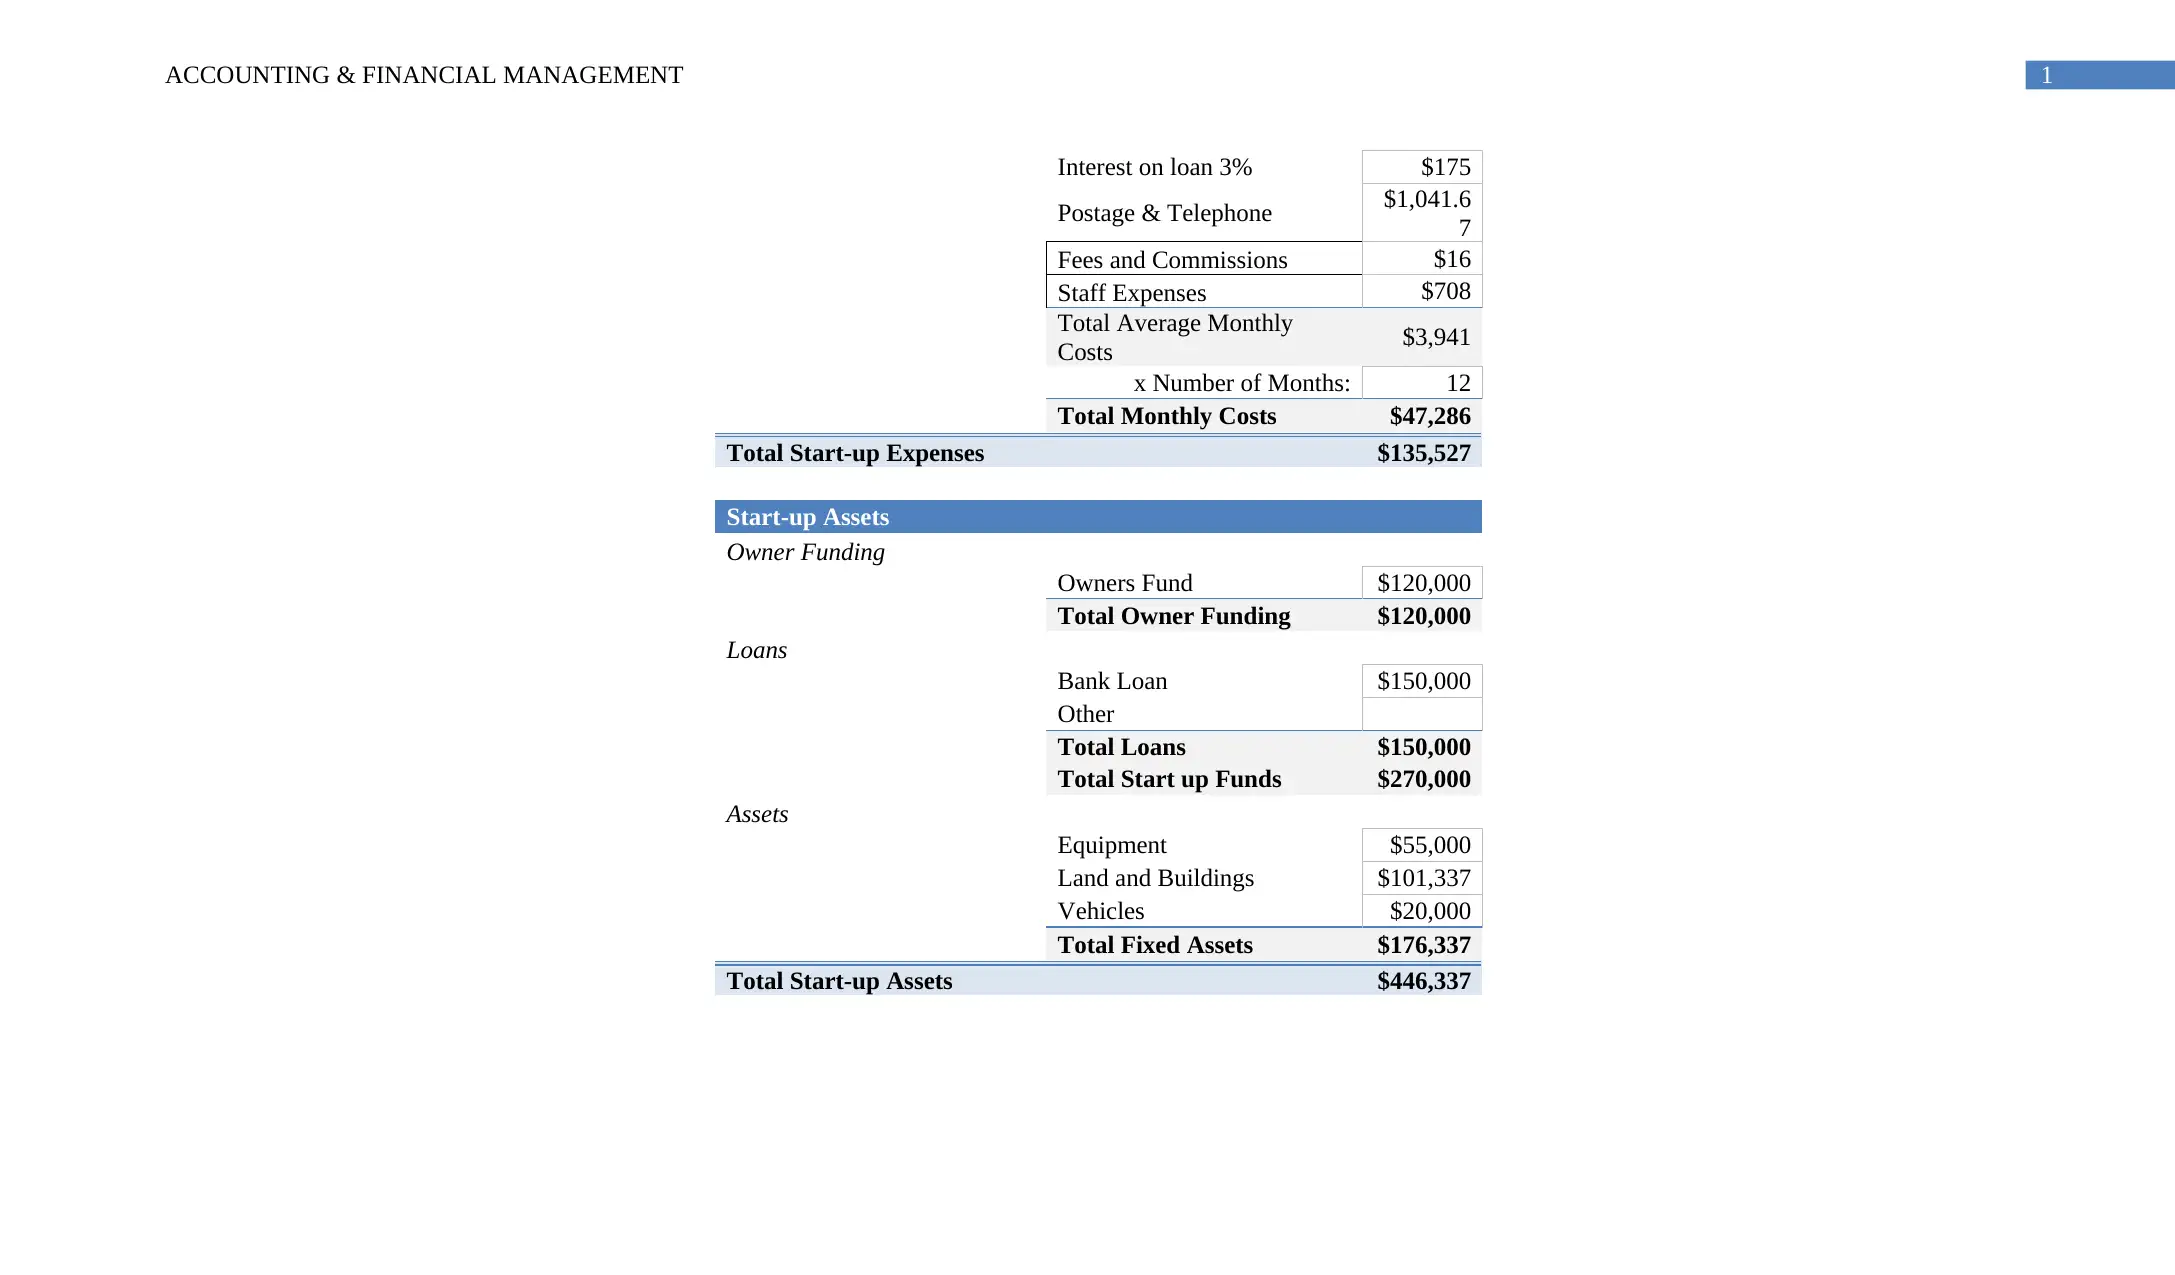
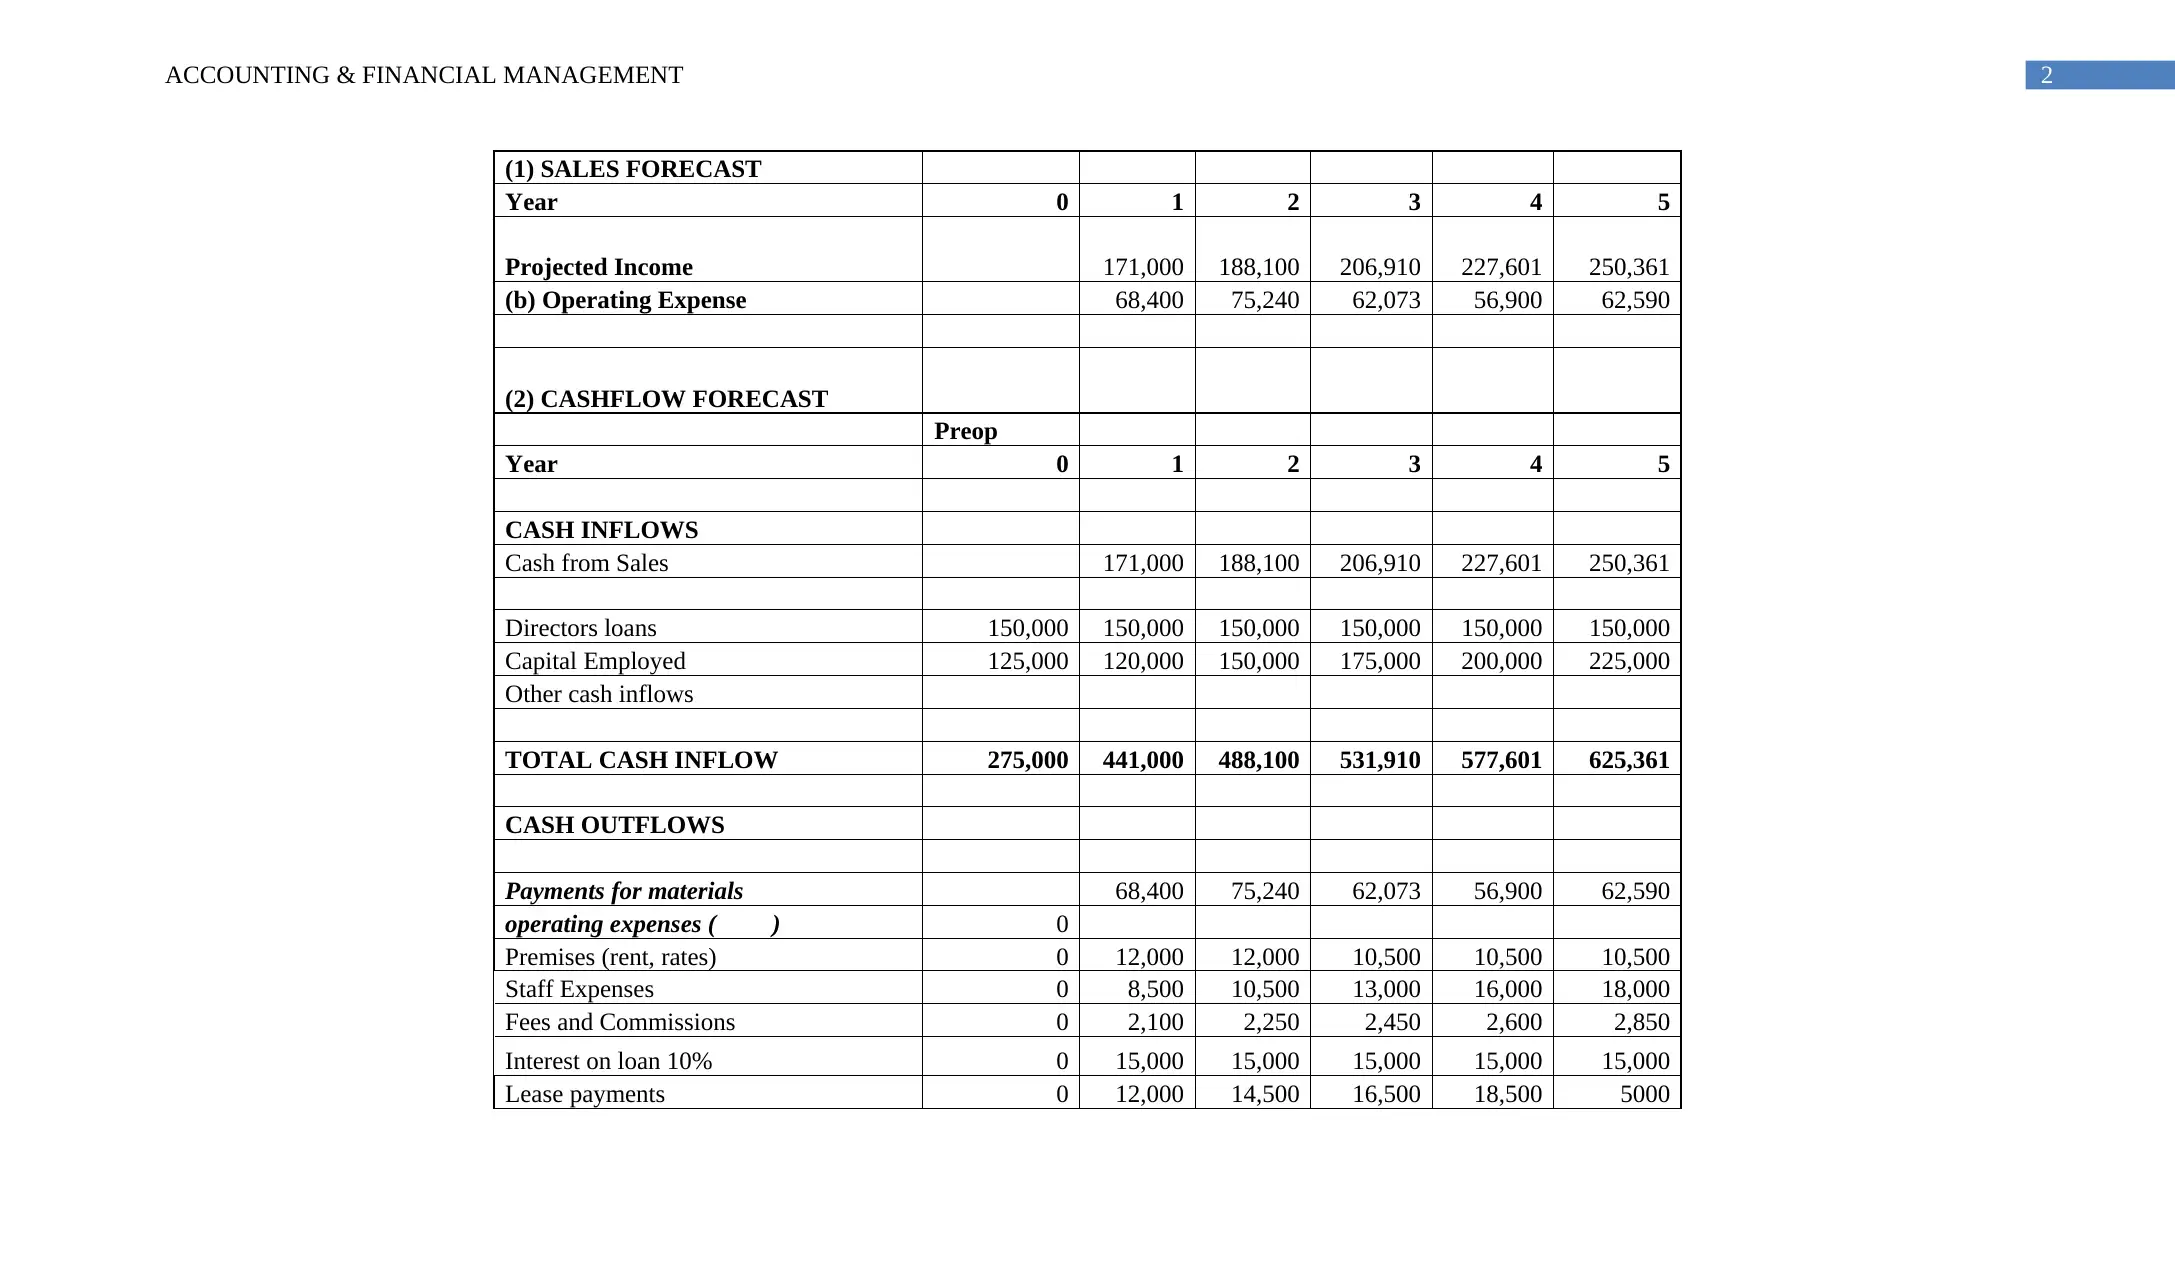
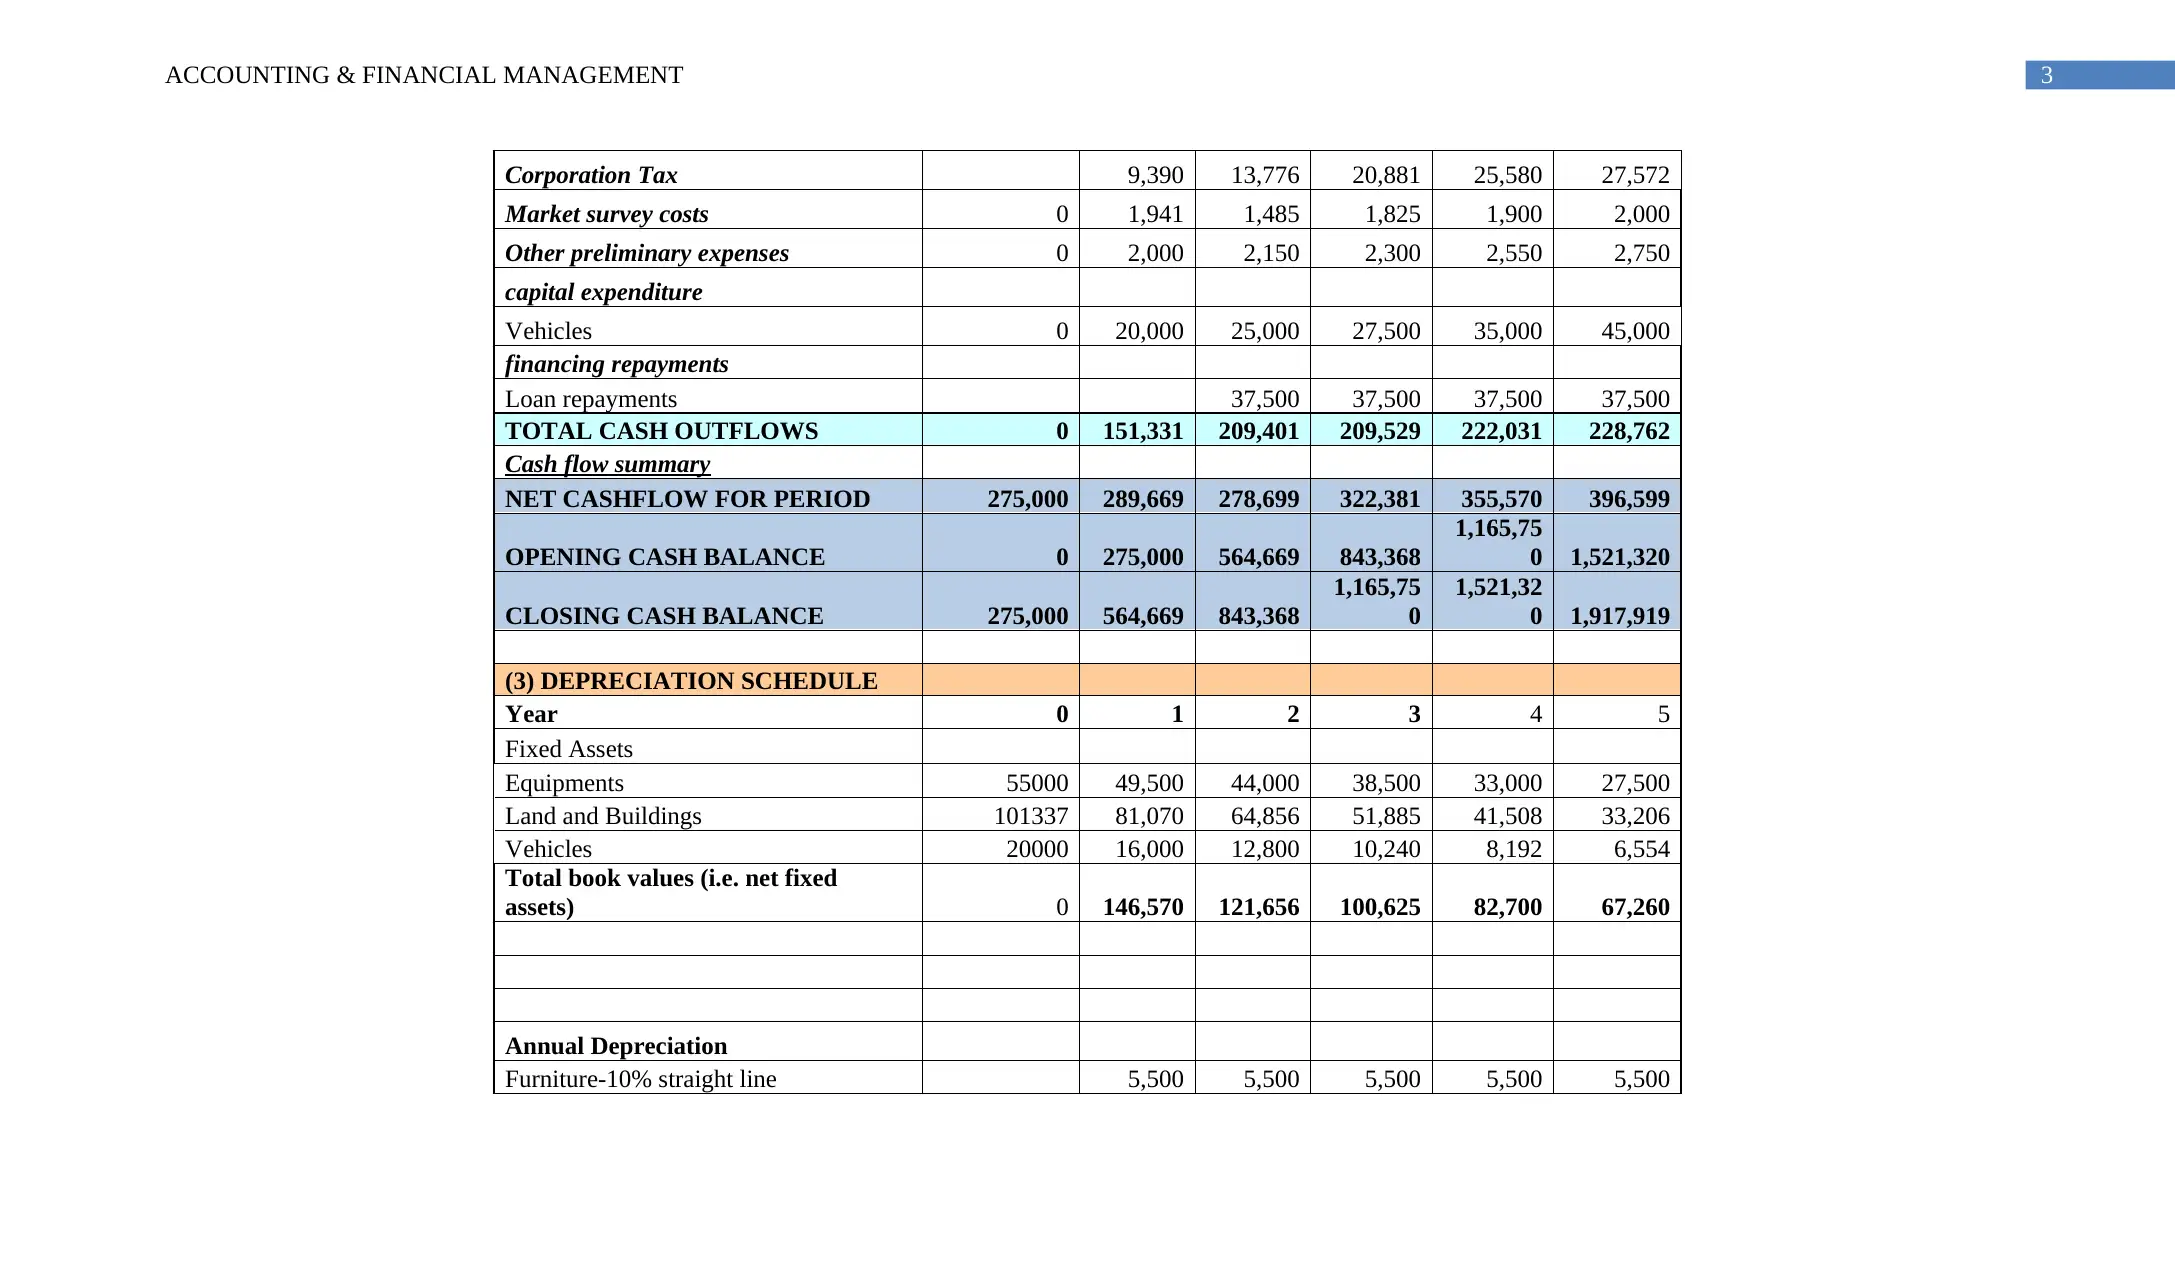
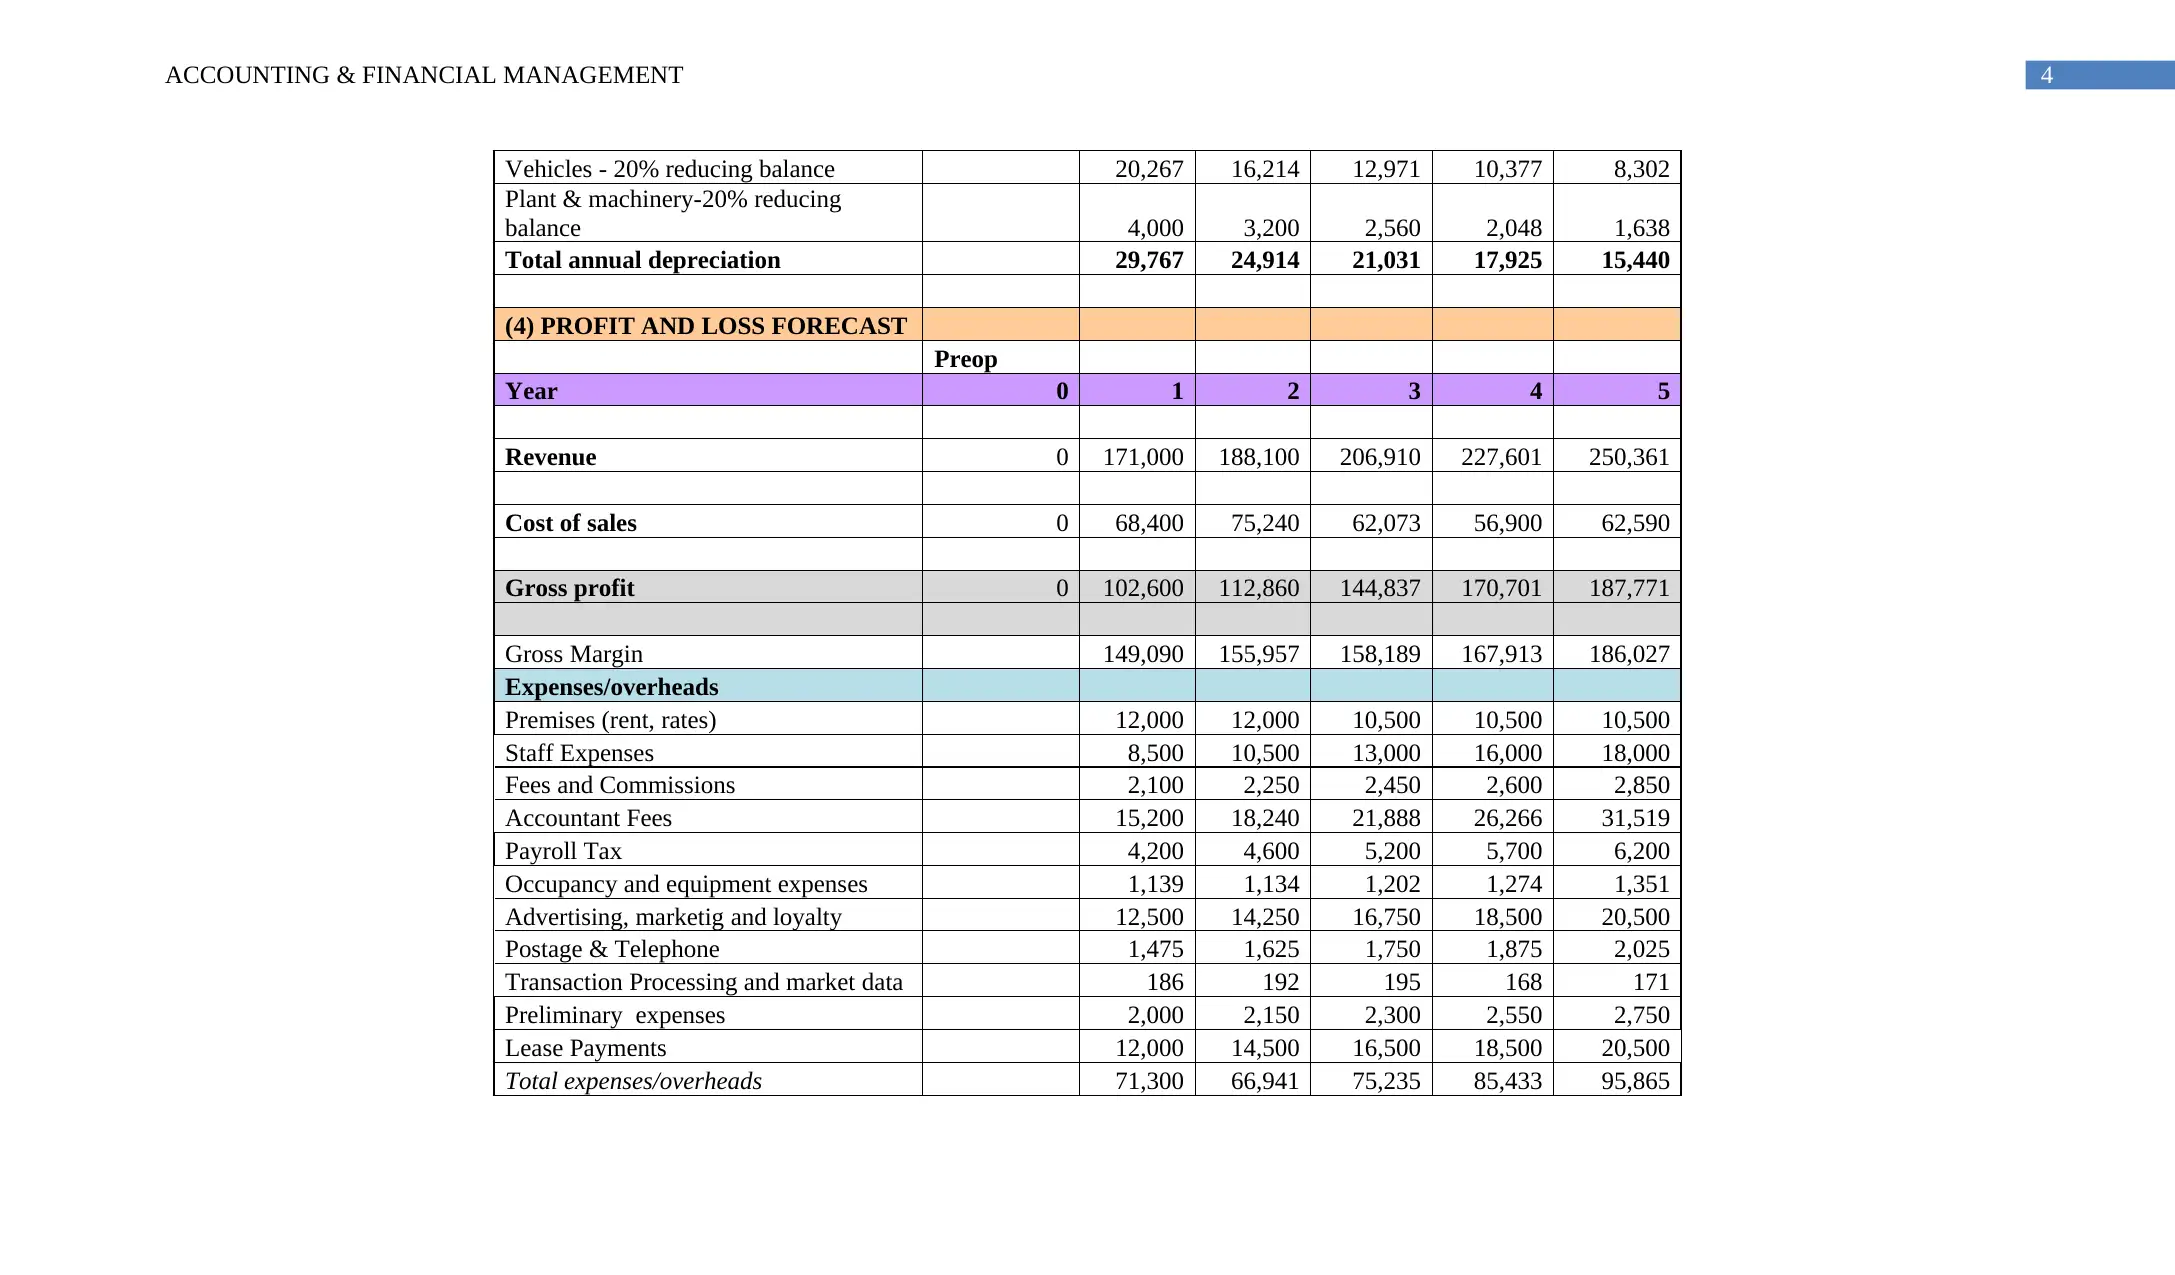
This report provides a comprehensive analysis of financial management principles applied to a hypothetical business. It begins with an examination of start-up requirements, including detailed breakdowns of fixed costs, average monthly expenses, and asset allocation, supported by owner funding and loans. The report then presents sales and cash flow forecasts over a five-year period, accompanied by a depreciation schedule and profit and loss forecasts. A break-even analysis is also included. Part 2 delves into the company's products and services, forecasting techniques, and statutory requirements. It also covers negotiation strategies for acquiring funding, record-keeping for resource allocation, and budget performance reporting. Risk and return analysis and budget monitoring are addressed. Part 3 analyzes the financial records of a company, including horizontal and vertical analysis of income statements and balance sheets, and discusses how financial decisions meet planned outcomes.
Document Page
Running head: ACCOUNTING & FINANCIAL MANAGEMENT
Accounting & Financial Management
Name of Student:
Name of University:
Author’s Note:
tabler-icon-diamond-filled.svg

Paraphrase This Document

Need a fresh take? Get an instant paraphrase of this document with our AI Paraphraser
Document Page
1ACCOUNTING & FINANCIAL MANAGEMENT
Table of Contents
Introduction......................................................................................................................................2
Part 1:...............................................................................................................................................0
Part 2:...............................................................................................................................................0
Products or services.....................................................................................................................0
Forecasting technique..................................................................................................................0
Analysis of forecasts....................................................................................................................0
Statutory requirements.................................................................................................................0
Collection of comparative and trend information to support budget...........................................0
Negotiation strategy to acquiring funding for business project...................................................1
Records maintained to ensure up-to-date information about resource allocations and usage.....2
Reporting budget performance and expenditure..........................................................................2
Risk return analysis......................................................................................................................2
Budget monitoring.......................................................................................................................2
Part 3:...............................................................................................................................................3
Reports that require lodging by this company according to ASIC..............................................3
Analyse these financial records by applying the horizontal and vertical analysis.......................3
Organisations financial decisions will serve to meet the organisations planned outcomes.............7
Conclusion:......................................................................................................................................7
References and Bibliography...........................................................................................................8
Document Page
2ACCOUNTING & FINANCIAL MANAGEMENT
Introduction
The organisation provides services related to manufacture packing materials and provide
third party logistics services across Australia. The company will produce high quality packing
material for “variety of food, beverage, pharmaceutical, medical-device, home and personal-care
and other products”. Some of the main third-party logistics functions performed by the company
includes “cross docking, Transportation services, Cross-docking, Inventory management,
Packaging and different types of freight forwarding services and warehousing” (Evans 2015).
Document Page
0ACCOUNTING & FINANCIAL MANAGEMENT
Part 1:
Start-up Requirements
Start-up Expenses
Fixed Costs Particulars Amount
($)
Premises (RENT & RATES) $12,000
Staff Expenses $8,500
Accountant Fees $15,000
Payroll Tax $15,200
Occupancy and equipment
expenses $4,200
Advertising, marketing and
loyalty $1,139
Postage & Telephone $12,500
Transaction Processing and
market data $1,475
Fees and Commissions $186
Interest on loan 10% $2,100
Information technology and
service expense $1,941
Preliminary expenses $2,000
Lease payments $12,000
Total Fixed Costs $88,241
Average Monthly Costs
Rent $1,000
Lease payments $1,000
tabler-icon-diamond-filled.svg

Paraphrase This Document

Need a fresh take? Get an instant paraphrase of this document with our AI Paraphraser
Document Page
1ACCOUNTING & FINANCIAL MANAGEMENT
Interest on loan 3% $175
Postage & Telephone $1,041.6
7
Fees and Commissions $16
Staff Expenses $708
Total Average Monthly
Costs $3,941
x Number of Months: 12
Total Monthly Costs $47,286
Total Start-up Expenses $135,527
Start-up Assets
Owner Funding
Owners Fund $120,000
Total Owner Funding $120,000
Loans
Bank Loan $150,000
Other
Total Loans $150,000
Total Start up Funds $270,000
Assets
Equipment $55,000
Land and Buildings $101,337
Vehicles $20,000
Total Fixed Assets $176,337
Total Start-up Assets $446,337
Document Page
2ACCOUNTING & FINANCIAL MANAGEMENT
(1) SALES FORECAST
Year 0 1 2 3 4 5
Projected Income 171,000 188,100 206,910 227,601 250,361
(b) Operating Expense 68,400 75,240 62,073 56,900 62,590
(2) CASHFLOW FORECAST
Preop
Year 0 1 2 3 4 5
CASH INFLOWS
Cash from Sales 171,000 188,100 206,910 227,601 250,361
Directors loans 150,000 150,000 150,000 150,000 150,000 150,000
Capital Employed 125,000 120,000 150,000 175,000 200,000 225,000
Other cash inflows
TOTAL CASH INFLOW 275,000 441,000 488,100 531,910 577,601 625,361
CASH OUTFLOWS
Payments for materials 68,400 75,240 62,073 56,900 62,590
operating expenses ( ) 0
Premises (rent, rates) 0 12,000 12,000 10,500 10,500 10,500
Staff Expenses 0 8,500 10,500 13,000 16,000 18,000
Fees and Commissions 0 2,100 2,250 2,450 2,600 2,850
Interest on loan 10% 0 15,000 15,000 15,000 15,000 15,000
Lease payments 0 12,000 14,500 16,500 18,500 5000
Document Page
3ACCOUNTING & FINANCIAL MANAGEMENT
Corporation Tax 9,390 13,776 20,881 25,580 27,572
Market survey costs 0 1,941 1,485 1,825 1,900 2,000
Other preliminary expenses 0 2,000 2,150 2,300 2,550 2,750
capital expenditure
Vehicles 0 20,000 25,000 27,500 35,000 45,000
financing repayments
Loan repayments 37,500 37,500 37,500 37,500
TOTAL CASH OUTFLOWS 0 151,331 209,401 209,529 222,031 228,762
Cash flow summary
NET CASHFLOW FOR PERIOD 275,000 289,669 278,699 322,381 355,570 396,599
OPENING CASH BALANCE 0 275,000 564,669 843,368
1,165,75
0 1,521,320
CLOSING CASH BALANCE 275,000 564,669 843,368
1,165,75
0
1,521,32
0 1,917,919
(3) DEPRECIATION SCHEDULE
Year 0 1 2 3 4 5
Fixed Assets
Equipments 55000 49,500 44,000 38,500 33,000 27,500
Land and Buildings 101337 81,070 64,856 51,885 41,508 33,206
Vehicles 20000 16,000 12,800 10,240 8,192 6,554
Total book values (i.e. net fixed
assets) 0 146,570 121,656 100,625 82,700 67,260
Annual Depreciation
Furniture-10% straight line 5,500 5,500 5,500 5,500 5,500
tabler-icon-diamond-filled.svg

Paraphrase This Document

Need a fresh take? Get an instant paraphrase of this document with our AI Paraphraser
Document Page
4ACCOUNTING & FINANCIAL MANAGEMENT
Vehicles - 20% reducing balance 20,267 16,214 12,971 10,377 8,302
Plant & machinery-20% reducing
balance 4,000 3,200 2,560 2,048 1,638
Total annual depreciation 29,767 24,914 21,031 17,925 15,440
(4) PROFIT AND LOSS FORECAST
Preop
Year 0 1 2 3 4 5
Revenue 0 171,000 188,100 206,910 227,601 250,361
Cost of sales 0 68,400 75,240 62,073 56,900 62,590
Gross profit 0 102,600 112,860 144,837 170,701 187,771
Gross Margin 149,090 155,957 158,189 167,913 186,027
Expenses/overheads
Premises (rent, rates) 12,000 12,000 10,500 10,500 10,500
Staff Expenses 8,500 10,500 13,000 16,000 18,000
Fees and Commissions 2,100 2,250 2,450 2,600 2,850
Accountant Fees 15,200 18,240 21,888 26,266 31,519
Payroll Tax 4,200 4,600 5,200 5,700 6,200
Occupancy and equipment expenses 1,139 1,134 1,202 1,274 1,351
Advertising, marketig and loyalty 12,500 14,250 16,750 18,500 20,500
Postage & Telephone 1,475 1,625 1,750 1,875 2,025
Transaction Processing and market data 186 192 195 168 171
Preliminary expenses 2,000 2,150 2,300 2,550 2,750
Lease Payments 12,000 14,500 16,500 18,500 20,500
Total expenses/overheads 71,300 66,941 75,235 85,433 95,865
Document Page
5ACCOUNTING & FINANCIAL MANAGEMENT
Profit before tax 31,300 45,919 69,602 85,268 91,905
Tax @ 30% 9,390 13,776 20,881 25,580 27,572
Before tax net margin 18% 24% 34% 37% 37%
Profit after tax 21,910 32,143 48,721 59,688 64,334
Transfer to reserves 31,300 45,919 69,602 85,268 91,905
ROC 18% 27% 32% 34% 32%
Balance Sheet
Assets FY-1 FY-2 FY-3 FY-4 FY-5
Current Assets
Cash $106,050 $137,050 $124,650 $110,900 $116,650
Accounts receivable $480,000 $520,000 $625,000 $660,000 $700,000
Total current assets $586,050 $657,050 $749,650 $770,900 $816,650
Fixed (Long-Term) Assets
Vehicles $25,000 $25,600 $22,400 $19,200 $16,000
Furniture $32,000 $16,000 $12,800 $10,240 $8,192
Equipment $35,000 $22,400 $17,920 $14,336 $11,469
(Less accumulated depreciation) $15,200 $12,800 $10,880 $9,344 $8,115
Intangible assets $50,700
Total fixed assets $127,500 $51,200 $42,240 $34,432 $27,546
Total Assets $713,550 $708,250 $791,890 $805,332 $844,196
Document Page
6ACCOUNTING & FINANCIAL MANAGEMENT
Liabilities and Owner's Equity
Current Liabilities
Accounts payable $24,000 $25,000 $27,000 $25,000 $27,000
Accrued Rent $18,000 $18,000 $18,000 $18,000 $18,000
Bank Charges Payable $3,000 $3,000 $3,000 $3,000 $3,000
Short-term loans $10,000 $10,000 $10,000 $10,000 $10,000
Income taxes payable $2,970 $3,315 $6,975 $10,950 $14,880
Accrued salaries and wages $8,000 $10,000 $12,000 $15,000 $17,500
General Expenses $2,250 $2,450 $2,600 $2,850 $3,050
Lease Payment $14,000 $16,000 $19,000 $21,000 $24,000
Current portion of long-term debt $150,000 $140,000 $130,000 $140,000 $130,000
Total current liabilities $232,220 $227,765 $228,575 $245,800 $247,430
Long-Term Liabilities
Long-term debt $75,000 $90,000 $80,000 $70,000 $60,000
Less: Loan Repayment $7,500 $7,500 $7,500 $7,500
Deferred income tax $189,500 $154,200 $176,290 $109,982 $84,946
Total long-term liabilities $264,500 $236,700 $248,790 $172,482 $137,446
Owner's Equity
Owner's investment $200,000 $225,000 $275,000 $325,000 $375,000
Net Profits $6,930 $7,735 $16,275 $25,550 $34,720
Reserve and Surplus $9,900 $11,050 $23,250 $36,500 $49,600
Total owner's equity $216,830 $243,785 $314,525 $387,050 $459,320
Total Liabilities and Owner's Equity $713,550 $708,250 $791,890 $805,332 $844,196
{42}
tabler-icon-diamond-filled.svg

Paraphrase This Document

Need a fresh take? Get an instant paraphrase of this document with our AI Paraphraser
Document Page
7ACCOUNTING & FINANCIAL MANAGEMENT
Breakeven Analysis
Breakeven Sales Value = average fixed cost/% contribution
Average fixed cost 78954.827
Contribution % 50%
Revenue
Contributio
n
Fixed
Cost Profit
171000 85500
78954.82
7
6545.17
3
188100 94050
78954.82
7
15095.1
7
197387 98693.534
78954.82
7
19738.7
1
236864 118432.24
78954.82
7
39477.4
1
Document Page
0ACCOUNTING & FINANCIAL MANAGEMENT
Part 2:
Products or services
The products of the company will include manufacturing of high quality packaging
material for “food, beverage, pharmaceutical, medical-device, home and personal-care and other
products”. The third-party logistics services of the company include “cross docking,
Transportation services, Cross-docking, Inventory management, Packaging and different types of
freight forwarding services and warehousing” (Finkler et al. 2016).
Forecasting technique
The main forecasting is done with the application of ratio analysis.
Common Financial Ratios Year 1 Year 2 Year 3 Year 4 Year 5
Debt Ratio (Total Liabilities / Total Assets) 0.63 0.48 0.38 0.30 0.23
Current Ratio (Current Assets / Current
Liabilities) 2.24 2.52 2.75 2.92 2.95
Working Capital (Current Assets - Current
Liabilities) 176,64
0
206,32
0
251,23
0
280,18
1
291,91
9
Assets-to-Equity Ratio (Total Assets /
Owner's Equity) 2.69 1.93 1.62 1.42 1.29
Debt-to-Equity Ratio (Total Liabilities /
Owner's Equity) 1.69 0.93 0.62 0.42 0.29
Analysis of forecasts
The overall analysis shows that the company has been able to increase its current assets
and reduce the debt to equity over a period of five years.
Statutory requirements
The statutory requirement for the business will include:
Application for the Australian Business Number (ABN)
Registration of the business
Register a website name
Arranging for the Insurance needs
Registration for the taxes
Leasing of the premises
Collection of comparative and trend information to support budget
X-Axis Label Sales Gross Margin Net Profit
Year 1 $171,000 $149,090 $21,910
Year 2 $188,100 $155,957 $32,143
Year 3 $206,910 $158,189 $48,721
Year 4 $227,601 $167,913 $59,688
Year 5 $250,361 $186,027 $64,334
chevron_up_icon
1 out of 20
circle_padding
hide_on_mobile
zoom_out_icon
[object Object]