Financial Management: Brookfield Asset Management Analysis Report
VerifiedAdded on 2022/08/12
|10
|1681
|19
Report
AI Summary
This report provides a comprehensive financial analysis of Brookfield Asset Management (BAM), a Canadian financial firm. The analysis includes a stock overview, financial ratio calculations (profitability, asset turnover, debt-to-equity, and liquidity), and risk assessment (investment and financial risks). The report uses data from 2016-2018, offering insights into BAM's performance and financial health. Recommendations are provided, suggesting the stock's viability for investment based on positive alpha and expected return. The report also includes a bibliography and an appendix with financial data.
Running head: FINANCIAL MANAGEMENT
Financial Management
Name of the Student:
Name of the University:
Author’s Note:
Financial Management
Name of the Student:
Name of the University:
Author’s Note:
Paraphrase This Document
Need a fresh take? Get an instant paraphrase of this document with our AI Paraphraser
1FINANCIAL MANAGEMENT
Table of Contents
Part 2................................................................................................................................................2
Stock Analysis.................................................................................................................................2
Financial Ratio.............................................................................................................................4
Risk Analysis...............................................................................................................................5
Recommendations............................................................................................................................6
Bibliography....................................................................................................................................7
Appendix..........................................................................................................................................9
2FINANCIAL MANAGEMENT
Part 2
Stock Analysis
The stock has been considered for the purpose of analysis is the Brookfield Asset
Management which is a Canadian Financial Firm acting as an asset management which works in
key fields like real assets, property, infrastructure and renewable form of energy (Brookfield
Asset Management - BAM - Stock Price & News | The Motley Fool 2020). The company has well
expanded their business over the past 200 years which have allowed the company to manage a
fund of over $500 Billion as Assets under Management. The operations and business activities of
the company are well diversified into several asset class into properties filed like tool roads, data
centers, solar farms, gas pipelines, hydroelectric dams and skyscrapers across the five continents.
The key holding stake that the BAM Company has are as follows:
Brookfield Property Partners (BPY)
Brookfield Renewable Partners (BEP)
Brookfield Infrastructure Partners (BIP)
Brookfield Business Partners (BBU)
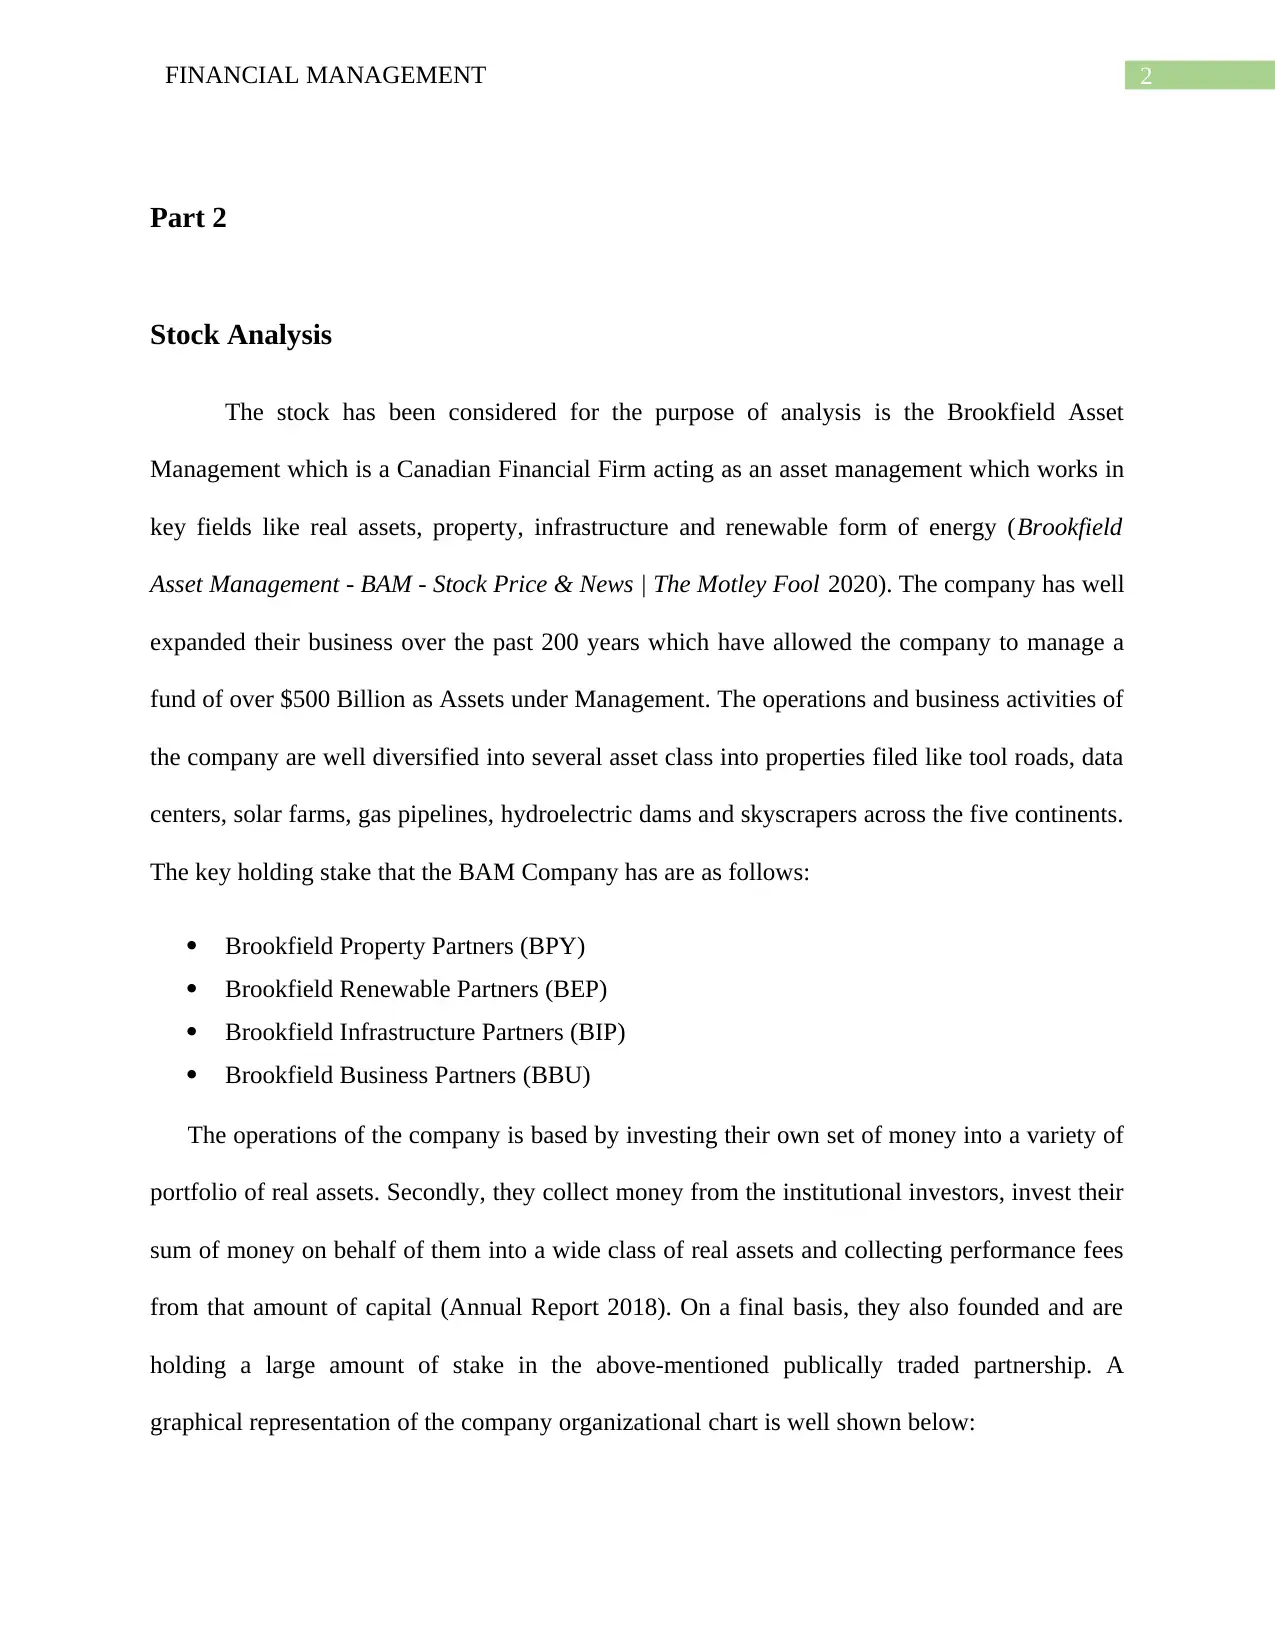
The operations of the company is based by investing their own set of money into a variety of
portfolio of real assets. Secondly, they collect money from the institutional investors, invest their
sum of money on behalf of them into a wide class of real assets and collecting performance fees
from that amount of capital (Annual Report 2018). On a final basis, they also founded and are
holding a large amount of stake in the above-mentioned publically traded partnership. A
graphical representation of the company organizational chart is well shown below:
Part 2
Stock Analysis
The stock has been considered for the purpose of analysis is the Brookfield Asset
Management which is a Canadian Financial Firm acting as an asset management which works in
key fields like real assets, property, infrastructure and renewable form of energy (Brookfield
Asset Management - BAM - Stock Price & News | The Motley Fool 2020). The company has well
expanded their business over the past 200 years which have allowed the company to manage a
fund of over $500 Billion as Assets under Management. The operations and business activities of
the company are well diversified into several asset class into properties filed like tool roads, data
centers, solar farms, gas pipelines, hydroelectric dams and skyscrapers across the five continents.
The key holding stake that the BAM Company has are as follows:
Brookfield Property Partners (BPY)
Brookfield Renewable Partners (BEP)
Brookfield Infrastructure Partners (BIP)
Brookfield Business Partners (BBU)
The operations of the company is based by investing their own set of money into a variety of
portfolio of real assets. Secondly, they collect money from the institutional investors, invest their
sum of money on behalf of them into a wide class of real assets and collecting performance fees
from that amount of capital (Annual Report 2018). On a final basis, they also founded and are
holding a large amount of stake in the above-mentioned publically traded partnership. A
graphical representation of the company organizational chart is well shown below:
⊘ This is a preview!⊘
Do you want full access?
Subscribe today to unlock all pages.
Trusted by 1+ million students worldwide
3FINANCIAL MANAGEMENT
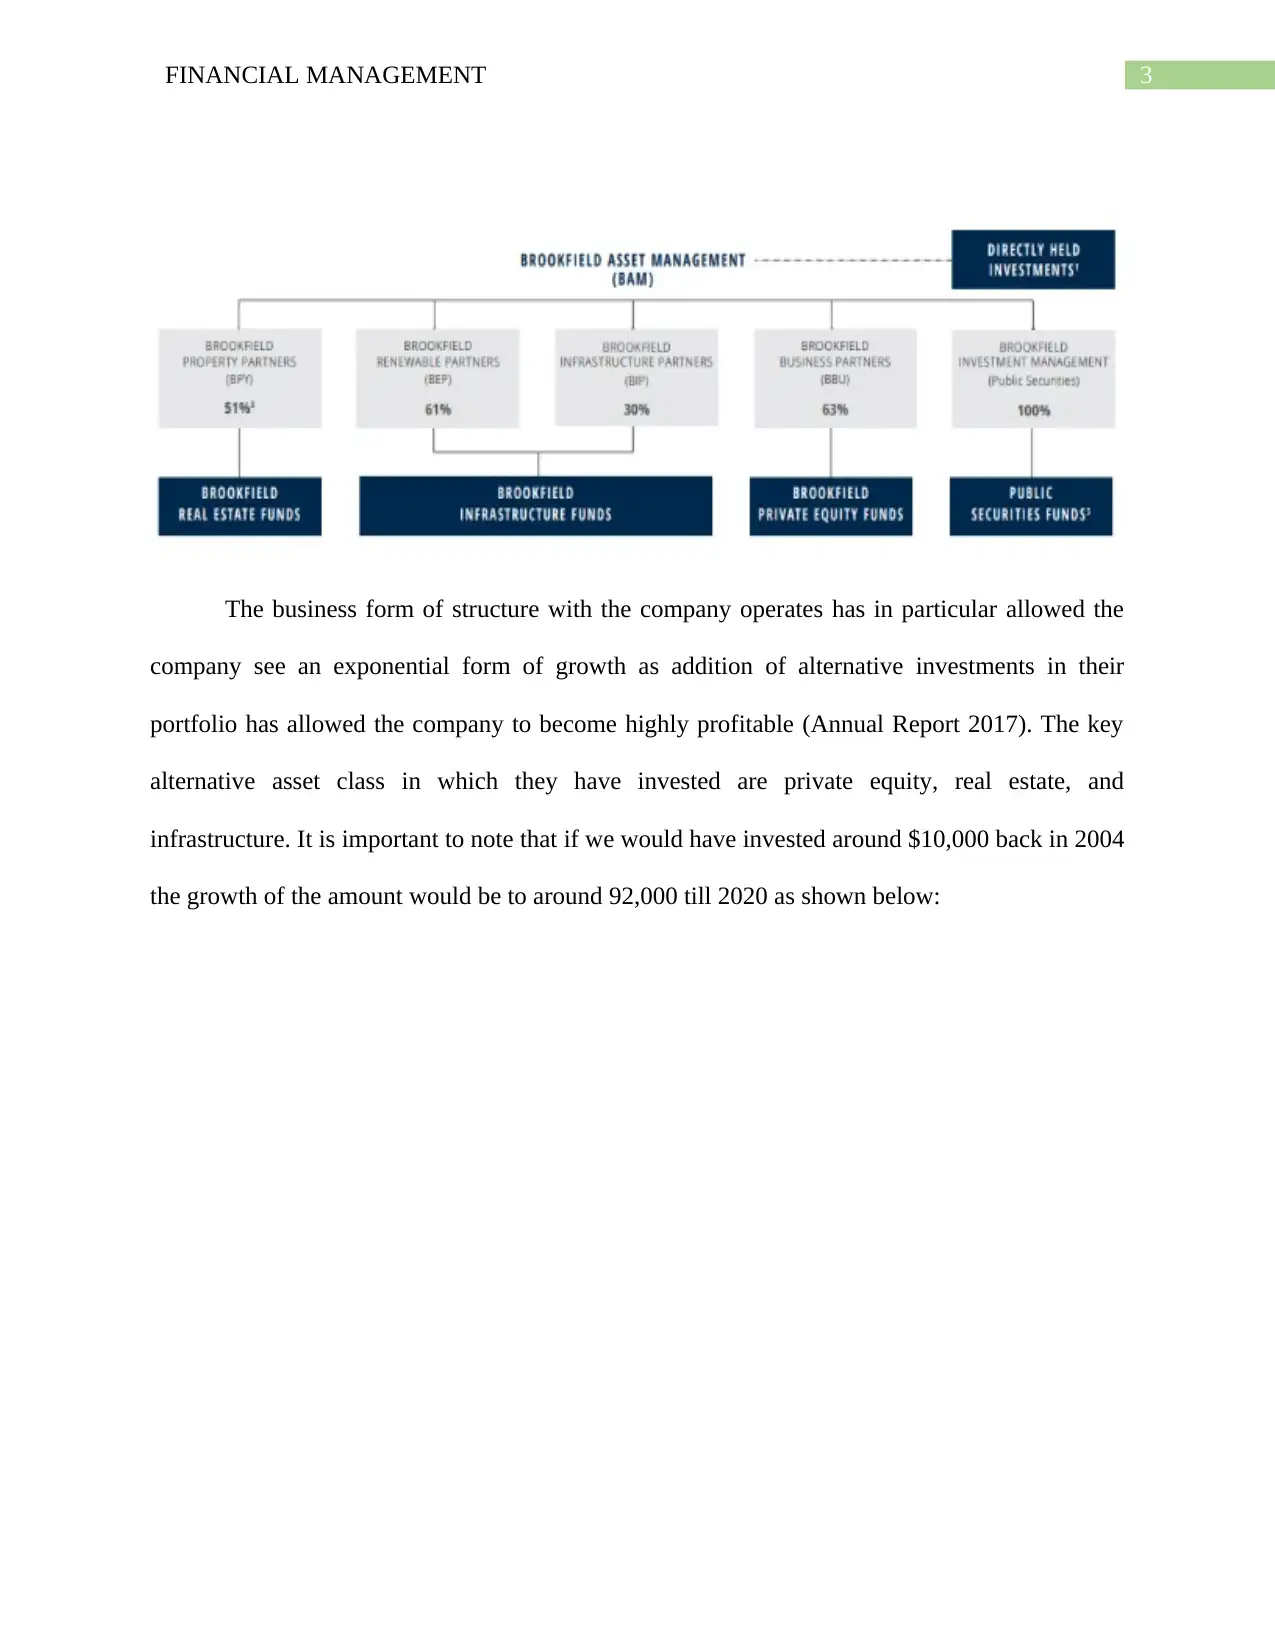
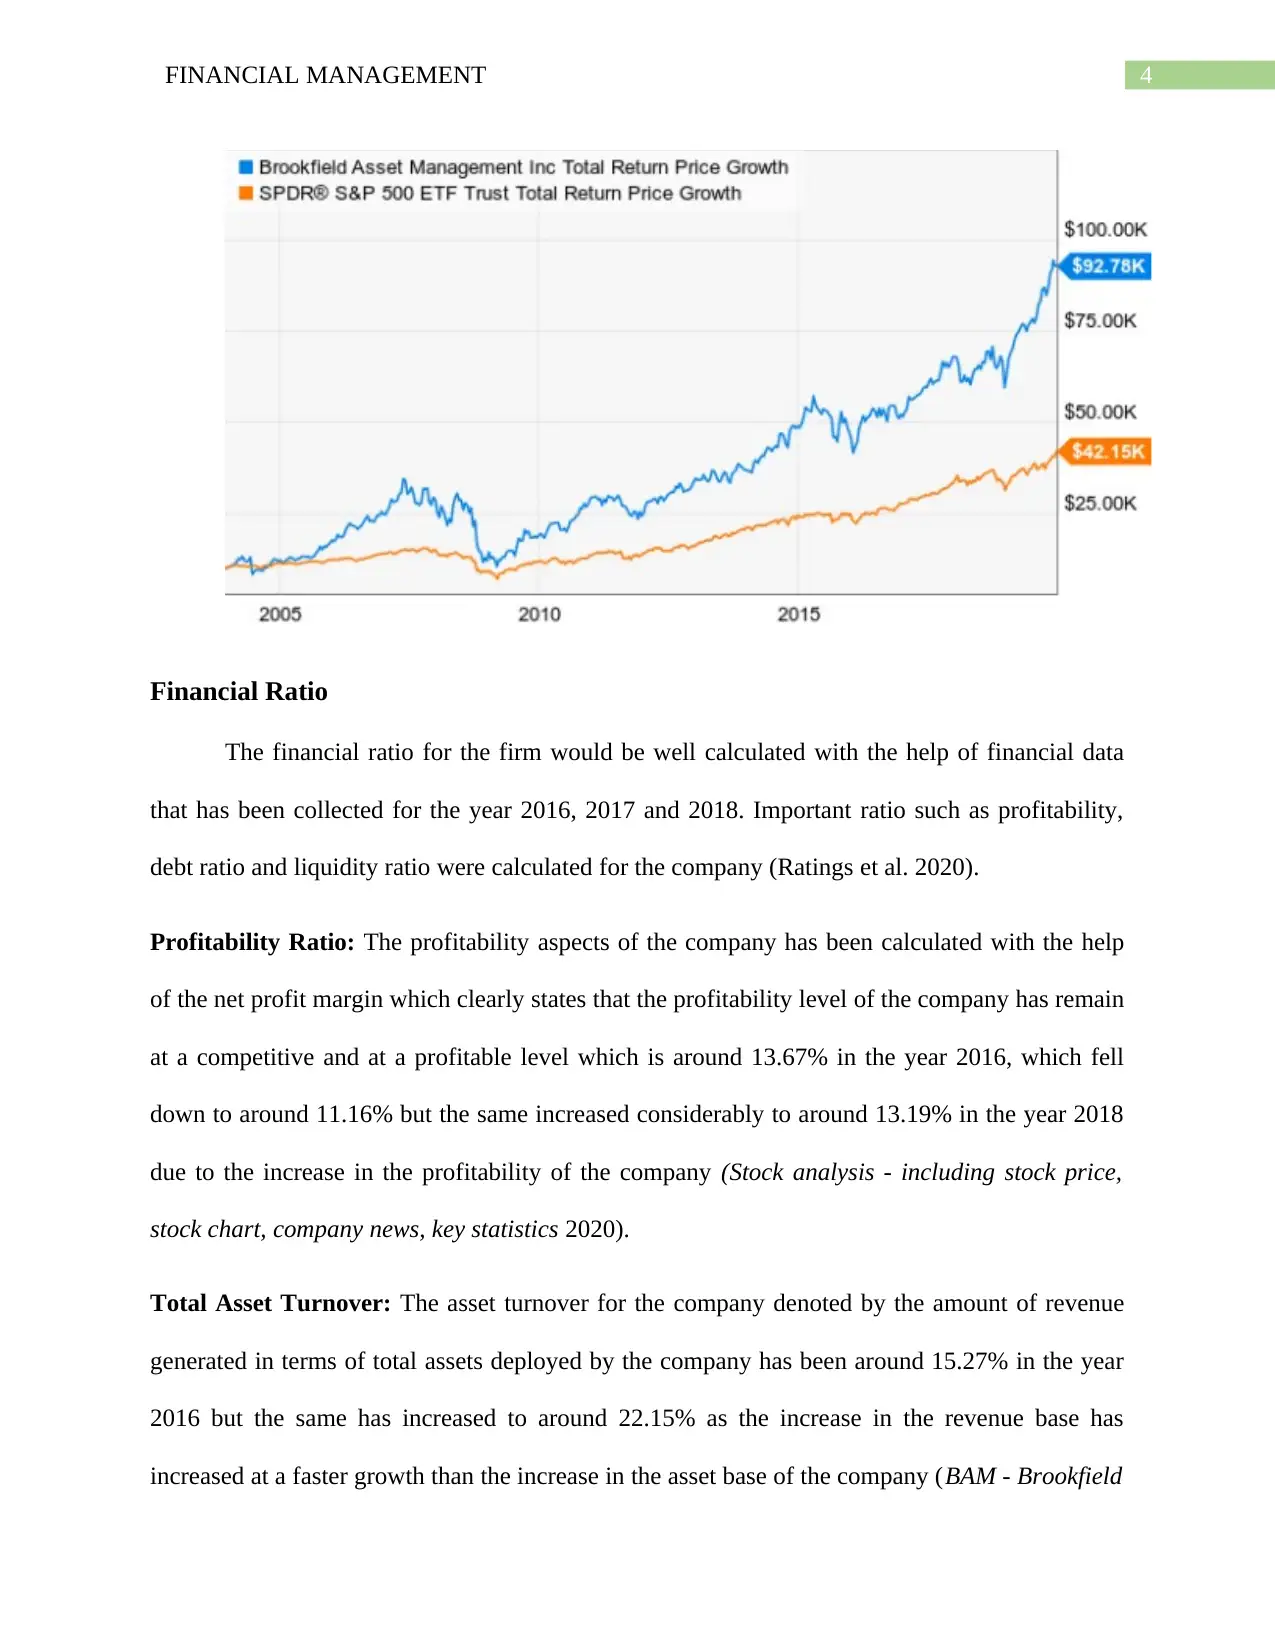
The business form of structure with the company operates has in particular allowed the
company see an exponential form of growth as addition of alternative investments in their
portfolio has allowed the company to become highly profitable (Annual Report 2017). The key
alternative asset class in which they have invested are private equity, real estate, and
infrastructure. It is important to note that if we would have invested around $10,000 back in 2004
the growth of the amount would be to around 92,000 till 2020 as shown below:
Paraphrase This Document
Need a fresh take? Get an instant paraphrase of this document with our AI Paraphraser
4FINANCIAL MANAGEMENT
Financial Ratio
The financial ratio for the firm would be well calculated with the help of financial data
that has been collected for the year 2016, 2017 and 2018. Important ratio such as profitability,
debt ratio and liquidity ratio were calculated for the company (Ratings et al. 2020).
Profitability Ratio: The profitability aspects of the company has been calculated with the help
of the net profit margin which clearly states that the profitability level of the company has remain
at a competitive and at a profitable level which is around 13.67% in the year 2016, which fell
down to around 11.16% but the same increased considerably to around 13.19% in the year 2018
due to the increase in the profitability of the company (Stock analysis - including stock price,
stock chart, company news, key statistics 2020).
Total Asset Turnover: The asset turnover for the company denoted by the amount of revenue
generated in terms of total assets deployed by the company has been around 15.27% in the year
2016 but the same has increased to around 22.15% as the increase in the revenue base has
increased at a faster growth than the increase in the asset base of the company (BAM - Brookfield
5FINANCIAL MANAGEMENT
Asset Management Inc Forecast - CNNMoney.com 2020). Increase in the asset turnover reflect
the higher efficiency of the management in generating sales for the company.
Debt to Equity Ratio: The debt to equity ratio shows the proportionate amount of debt capital
employed in respect to equity finance. The ratio was around 1.29 times which have increased to
around 1.64 times in the year 2016-2018 (Inc 2020). The increase in the ratio shows that the
company is increasing debt financing which in turn might affect the profitability and increase the
financial risk of the company.
Debt Ratio: The proportionate amount of debt that a company has deployed in response to the
total assets has been around 0.56 times in the year 2016, 0.59 times in the year 2017 and around
0.62 times in the year 2018. The increase in the debt ratio has increased due to increase in debt
financing.
Liquidity Ratio: The liquidity aspects of the company has been well assessed with the help of
current ratio which states the amount of current assets a company has deployed in response to the
current liabilities of the company for well maintain an sufficient amount of liquidity in the
company. The liquidity ratio for the company has been around 1.42 times in the year 2016 which
has reduced to around 1.23 times and this has been primarily due to the increase in the current
liabilities of the company with respect to the current assets of the company for the trend period
analyzed for the company.
Risk Analysis
The risk analysis of the stock could be well done with the help of the investment risk and
financial risk that is associated with the company. The investment risk associated with the
company has been well evaluated with the help of the BAM Stock Beta and Standard Deviation.
⊘ This is a preview!⊘
Do you want full access?
Subscribe today to unlock all pages.
Trusted by 1+ million students worldwide
6FINANCIAL MANAGEMENT
The beta value of the stock was calculated for the past five-years of historical data which gave us
a value of 1.09 which was moderate (Bloomberg 2020). On the other hand, the annual SD of the
stock was around 22.36% for the trend period analyzed (Yahoo Finance 2020). On the other
hand the financial risk associated with the company is comparatively higher as the company goes
on increasing debt as a prime source of financing. In terms of well managing the operational
business risk the company applies a range of financial derivatives for the purpose of well
hedging its forex risk (BAM Stock Rating and Data | Brookfield Asset Management -
GuruFocus.com 2020).
Recommendations
The analysis conducted for the stock well shows that the from an investment perspective
the stock is financially viable for investment purpose. Considering the excess return which was
calculated with the help of expected return and actual return, the alpha for the stock has been
positive to around 3.35%. The expected return calculated with CAPM Model was around 11.39%
and the actual return was around 14.71%. From an investment perspective it is expected that the
stock considered would be outperforming the benchmark index that is S&P 500. However, it is
still recommended that continuous reviews and research upon the business environment and
conditions should be well analyzed for the company.
Paraphrase This Document
Need a fresh take? Get an instant paraphrase of this document with our AI Paraphraser
7FINANCIAL MANAGEMENT
Bibliography
Alden, L. 2020 7 Top Stocks to Buy Today and Hold Forever, Lynalden.com. Available at:
https://www.lynalden.com/top-stocks-to-buy/ (Accessed: 18 February 2020).
Alden, L. 2020 7 Top Stocks to Buy Today and Hold Forever, Lynalden.com. Available at:
https://www.lynalden.com/top-stocks-to-buy/ (Accessed: 18 February 2020).
Annual Report 2017 Bam.brookfield.com. Available at:
https://bam.brookfield.com/~/media/Files/B/BrookField-BAM-IR-V2/quarterly-reports/2018/
annual/BAM-Annual-2018.pdf (Accessed: 18 February 2020).
Annual Report 2018 Bam.brookfield.com. Available at: Annual
Rehttps://bam.brookfield.com/~/media/Files/B/BrookField-BAM-IR-V2/quarterly-reports/
2017/bam-annual-2017/bam-annual-report-2017-r.pdf (Accessed: 18 February 2020).
BAM - Brookfield Asset Management Inc Forecast - CNNMoney.com 2020. Available at:
https://money.cnn.com/quote/forecast/forecast.html?symb=BAM (Accessed: 18 February 2020).
BAM Stock Rating and Data | Brookfield Asset Management - GuruFocus.com 2020. Available
at: https://www.gurufocus.com/stock/BAM/summary (Accessed: 18 February 2020).
Bloomberg 2020. Available at: https://www.bloomberg.com/markets/rates-bonds/government-
bonds/us (Accessed: 18 February 2020).
Brookfield Asset Management - BAM - Stock Price & News | The Motley Fool 2020. Available
at: https://www.fool.com/quote/nyse/brookfield-asset-management/bam/ (Accessed: 18 February
2020).
8FINANCIAL MANAGEMENT
Brookfield Asset Management 2020. Available at: https://bam.brookfield.com/ (Accessed: 18
February 2020).
Financial Report 2017. Available at: https://bam.brookfield.com/reports-and-filings/financial-
reports/annual-reports/2017 (Accessed: 18 February 2020).
Inc, B. 2020 Brookfield Asset Management Reports 2019 Net Income and FFO and Announces
Three-for-Two Stock Split, GlobeNewswire News Room. Available at:
https://www.globenewswire.com/news-release/2020/02/13/1984415/0/en/Brookfield-Asset-
Management-Reports-2019-Net-Income-and-FFO-and-Announces-Three-for-Two-Stock-
Split.html (Accessed: 18 February 2020).
Ratings, A. et al. 2020 BAM Stock Price, Forecast & News (Brookfield Asset
Management), Marketbeat.com. Available at: https://www.marketbeat.com/stocks/NYSE/BAM/
(Accessed: 18 February 2020).
Stock analysis - including stock price, stock chart, company news, key statistics 2020. Available
at: https://www.bnnbloomberg.ca/stock/BAM/A:CT (Accessed: 18 February 2020).
Yahoo Finance 2020. Available at: https://finance.yahoo.com/quote/%5EGSPC/history?
period1=1424217600&period2=1581984000&interval=1mo&filter=history&frequency=1mo
(Accessed: 18 February 2020).
⊘ This is a preview!⊘
Do you want full access?
Subscribe today to unlock all pages.
Trusted by 1+ million students worldwide
9FINANCIAL MANAGEMENT
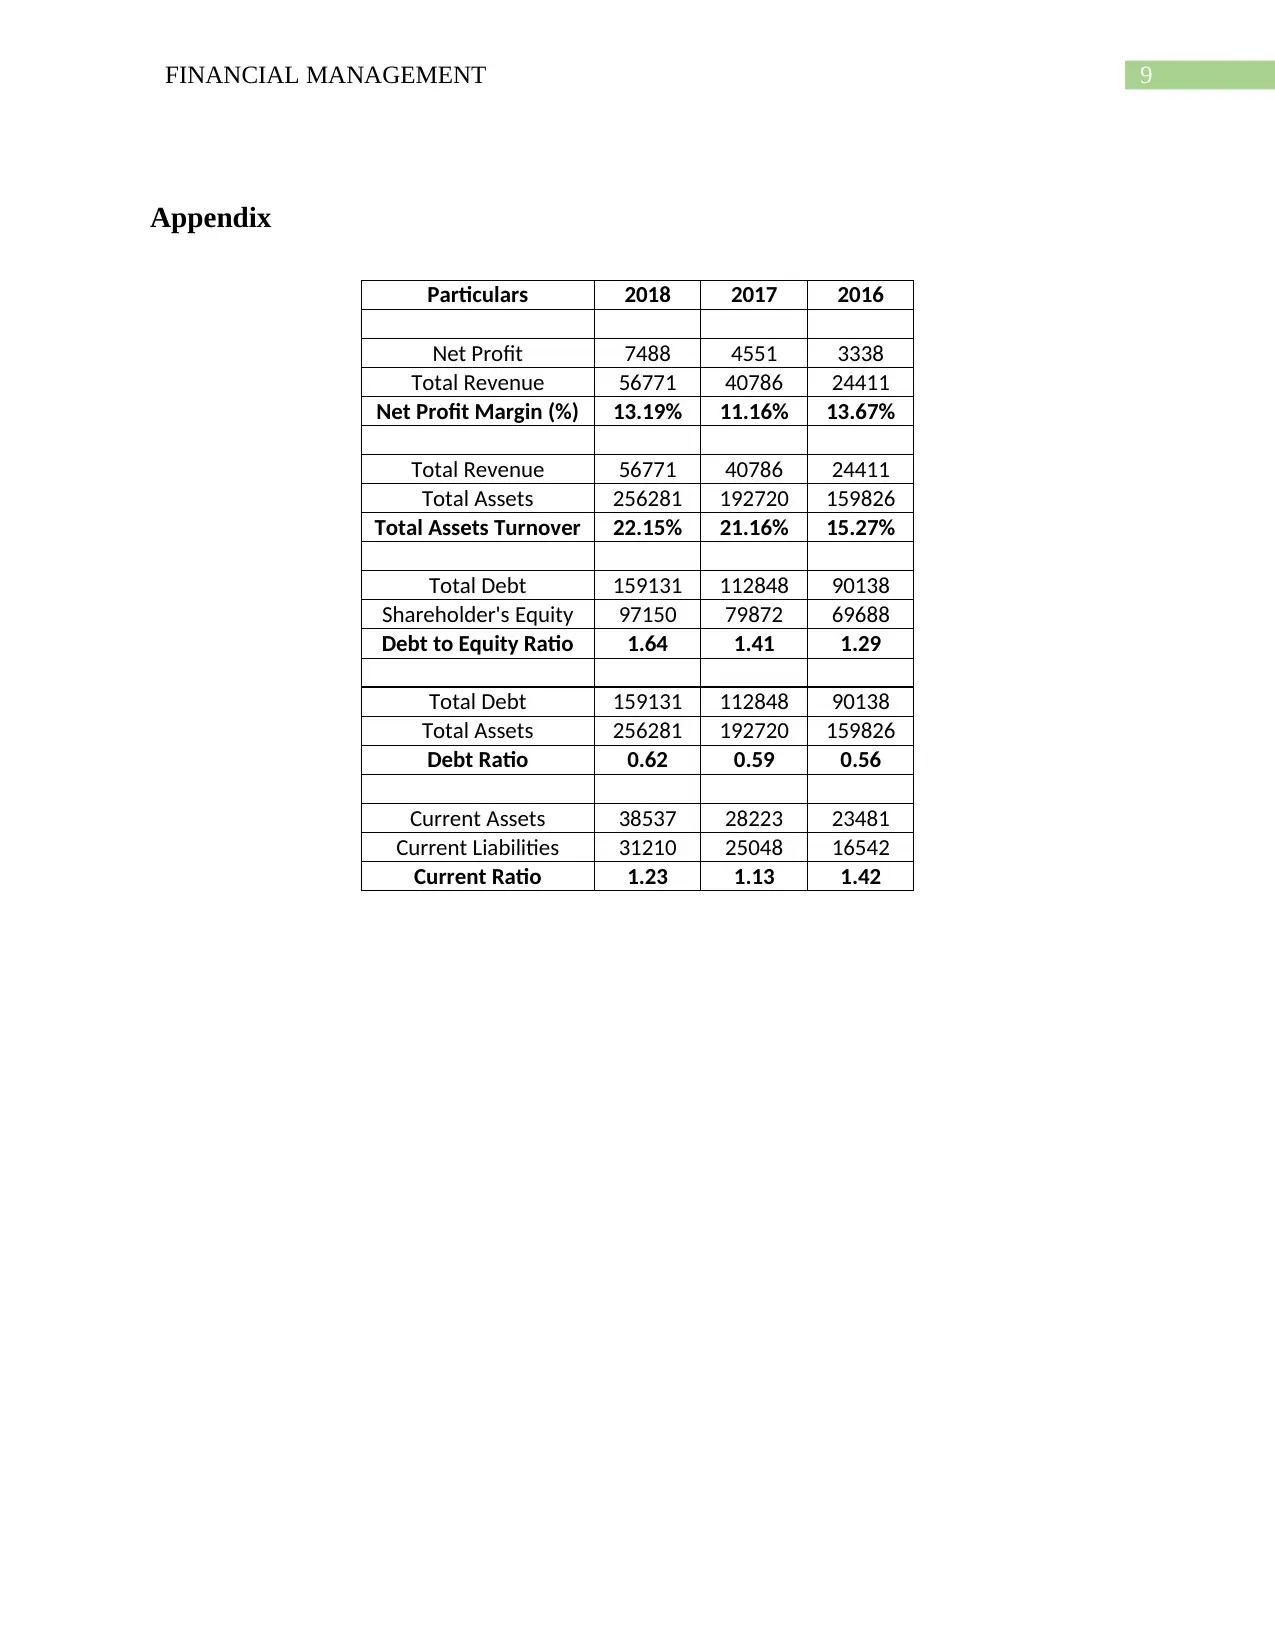
Appendix
Particulars 2018 2017 2016
Net Profit 7488 4551 3338
Total Revenue 56771 40786 24411
Net Profit Margin (%) 13.19% 11.16% 13.67%
Total Revenue 56771 40786 24411
Total Assets 256281 192720 159826
Total Assets Turnover 22.15% 21.16% 15.27%
Total Debt 159131 112848 90138
Shareholder's Equity 97150 79872 69688
Debt to Equity Ratio 1.64 1.41 1.29
Total Debt 159131 112848 90138
Total Assets 256281 192720 159826
Debt Ratio 0.62 0.59 0.56
Current Assets 38537 28223 23481
Current Liabilities 31210 25048 16542
Current Ratio 1.23 1.13 1.42
1 out of 10
Related Documents


Your All-in-One AI-Powered Toolkit for Academic Success.
+13062052269
info@desklib.com
Available 24*7 on WhatsApp / Email
![[object Object]](/_next/static/media/star-bottom.7253800d.svg)
Unlock your academic potential
Copyright © 2020–2026 A2Z Services. All Rights Reserved. Developed and managed by ZUCOL.