Financial Management Report: Cash Conversion Cycle and Equity
VerifiedAdded on  2022/09/28
|16
|2679
|19
Report
AI Summary
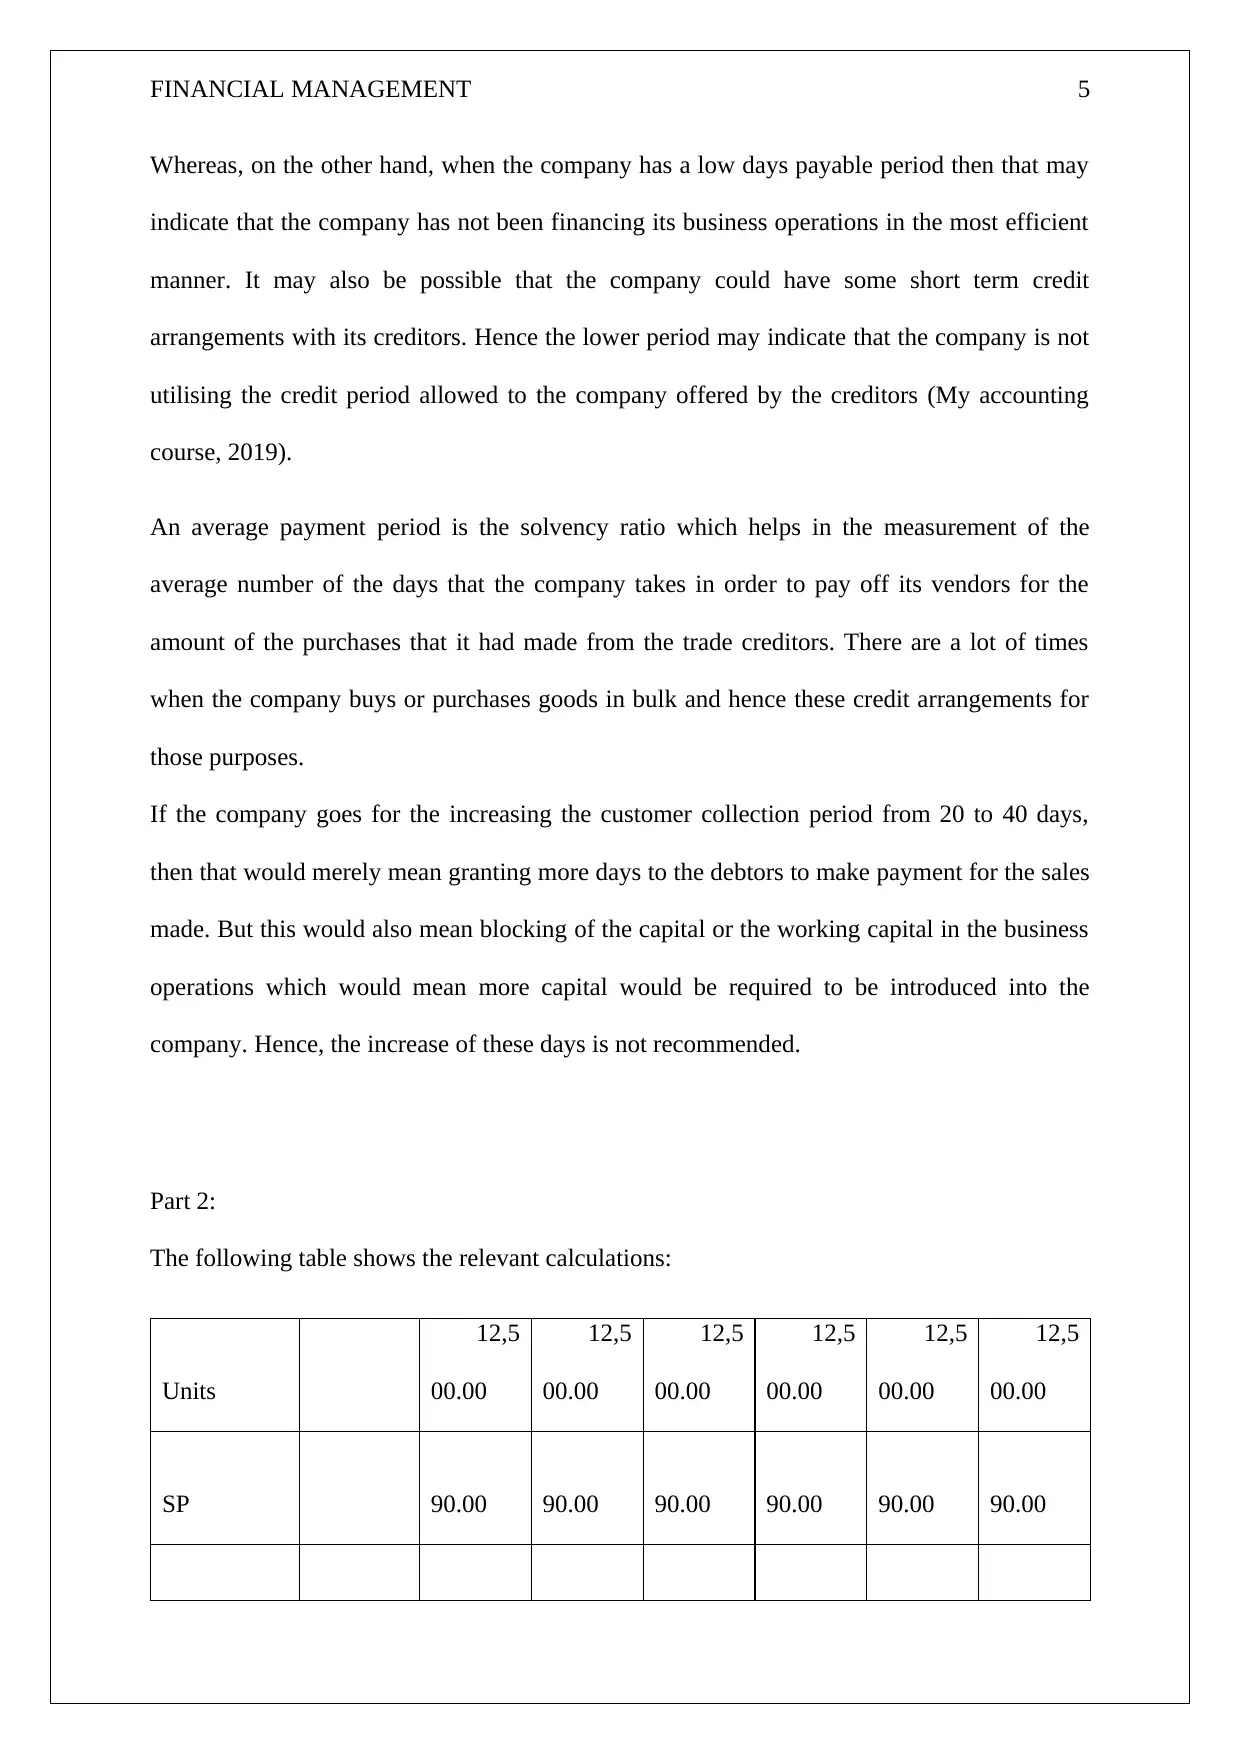
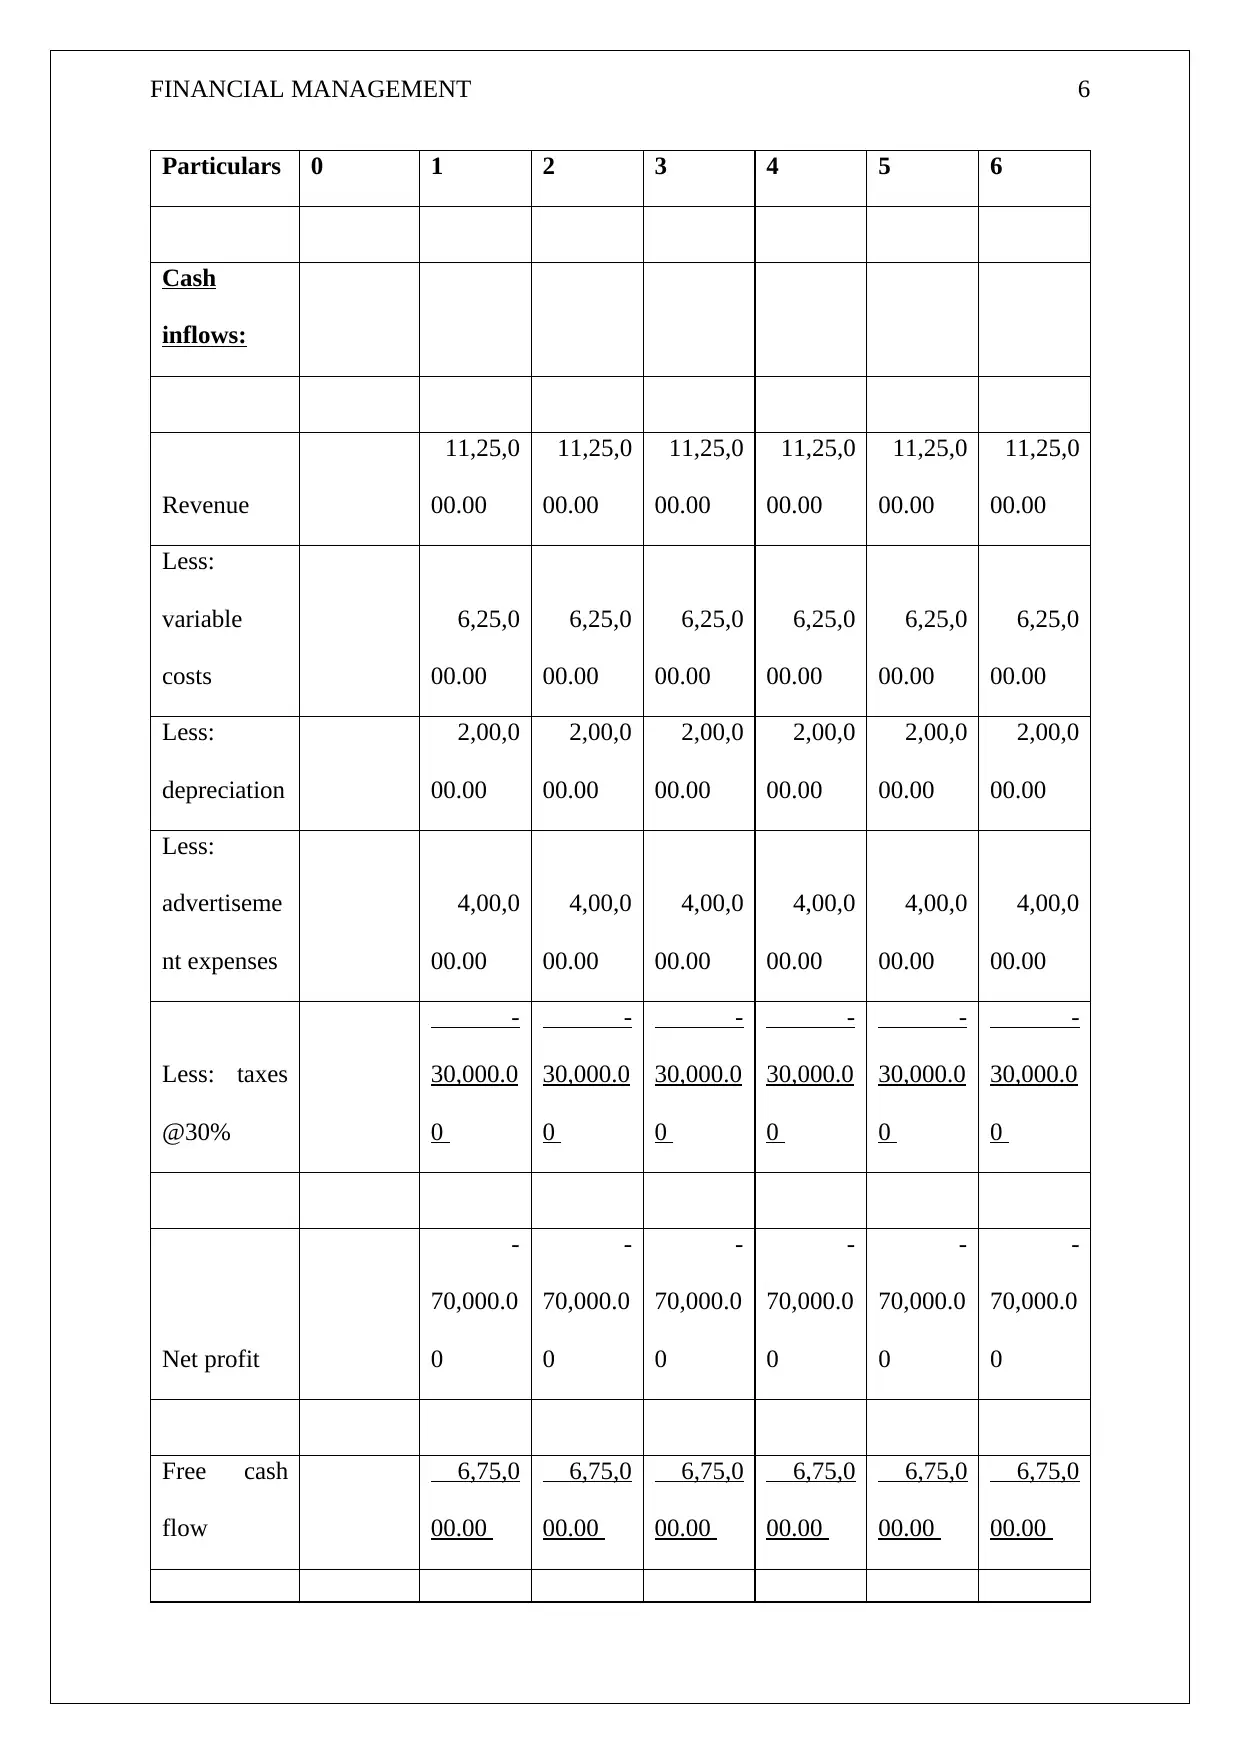
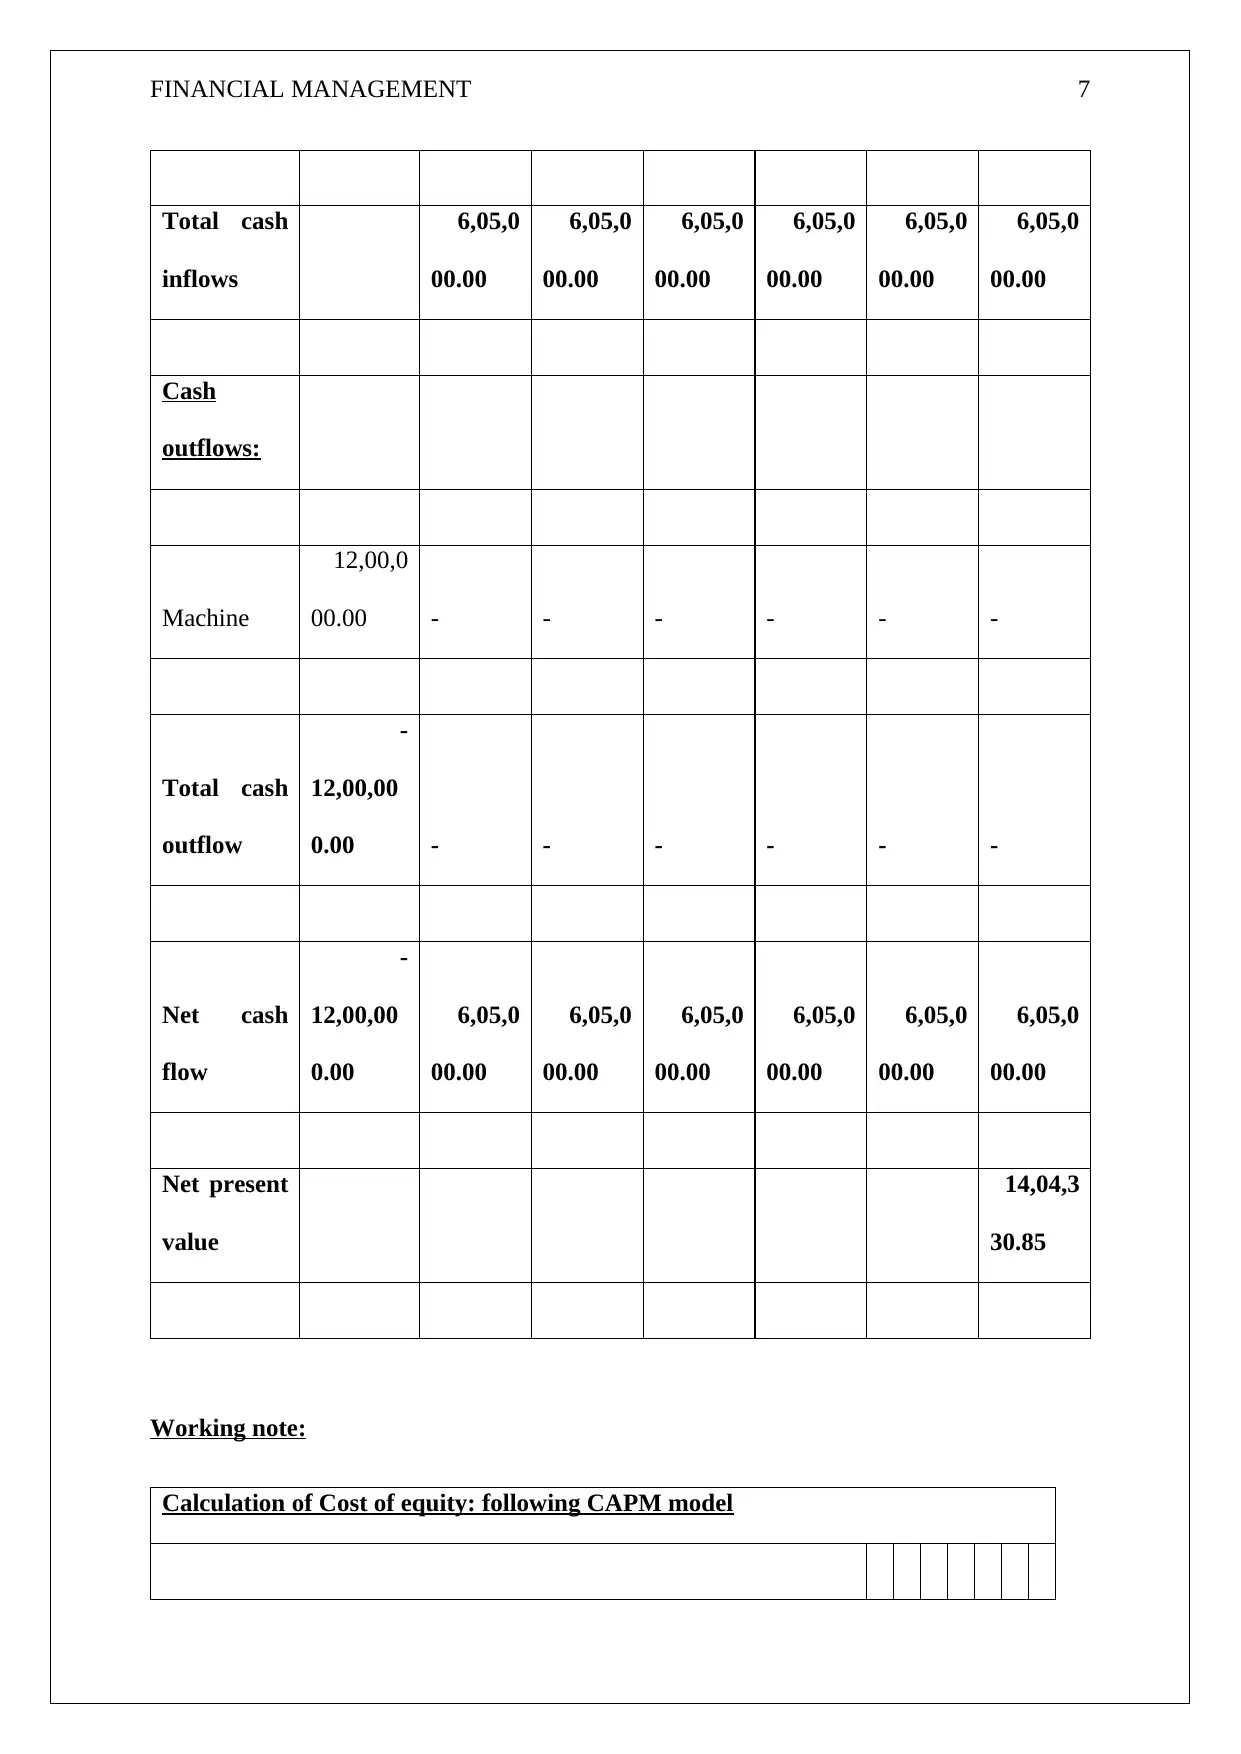
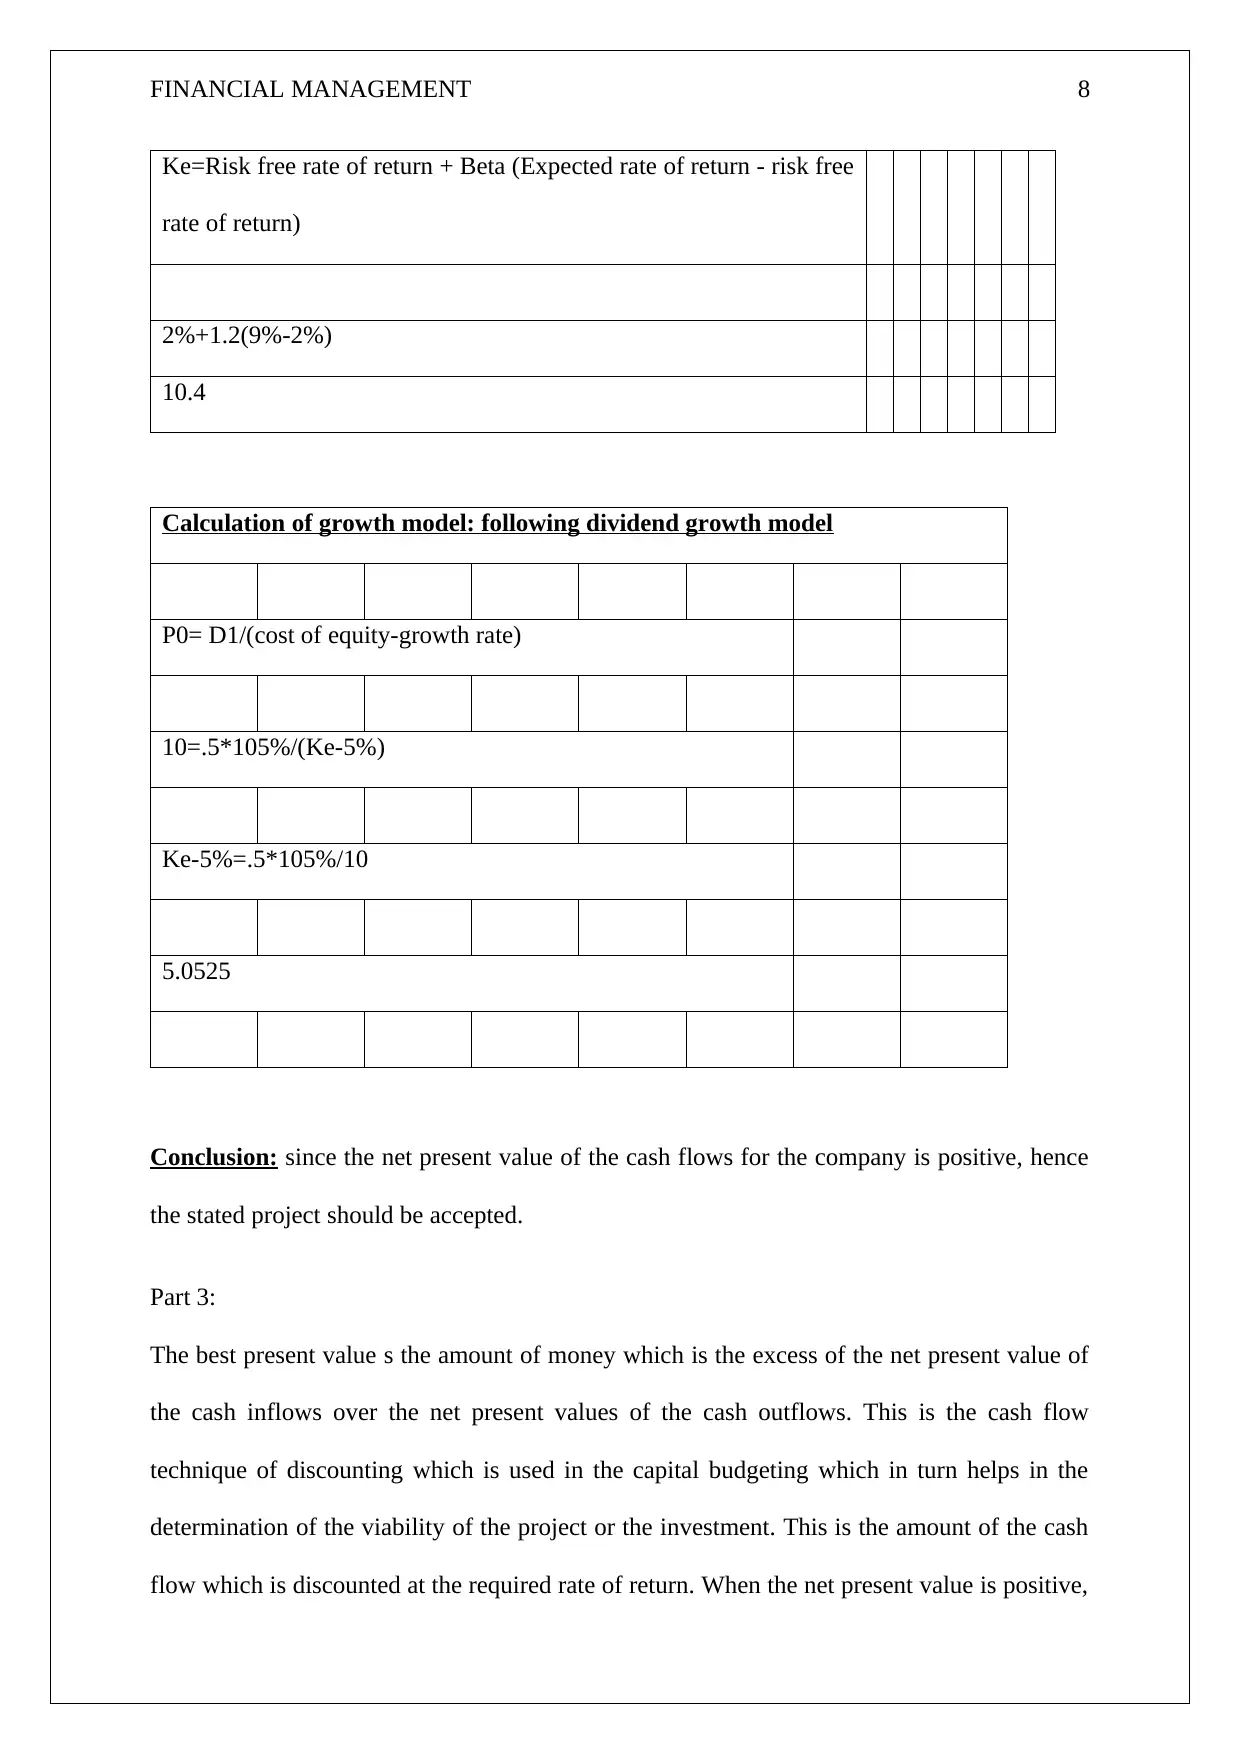
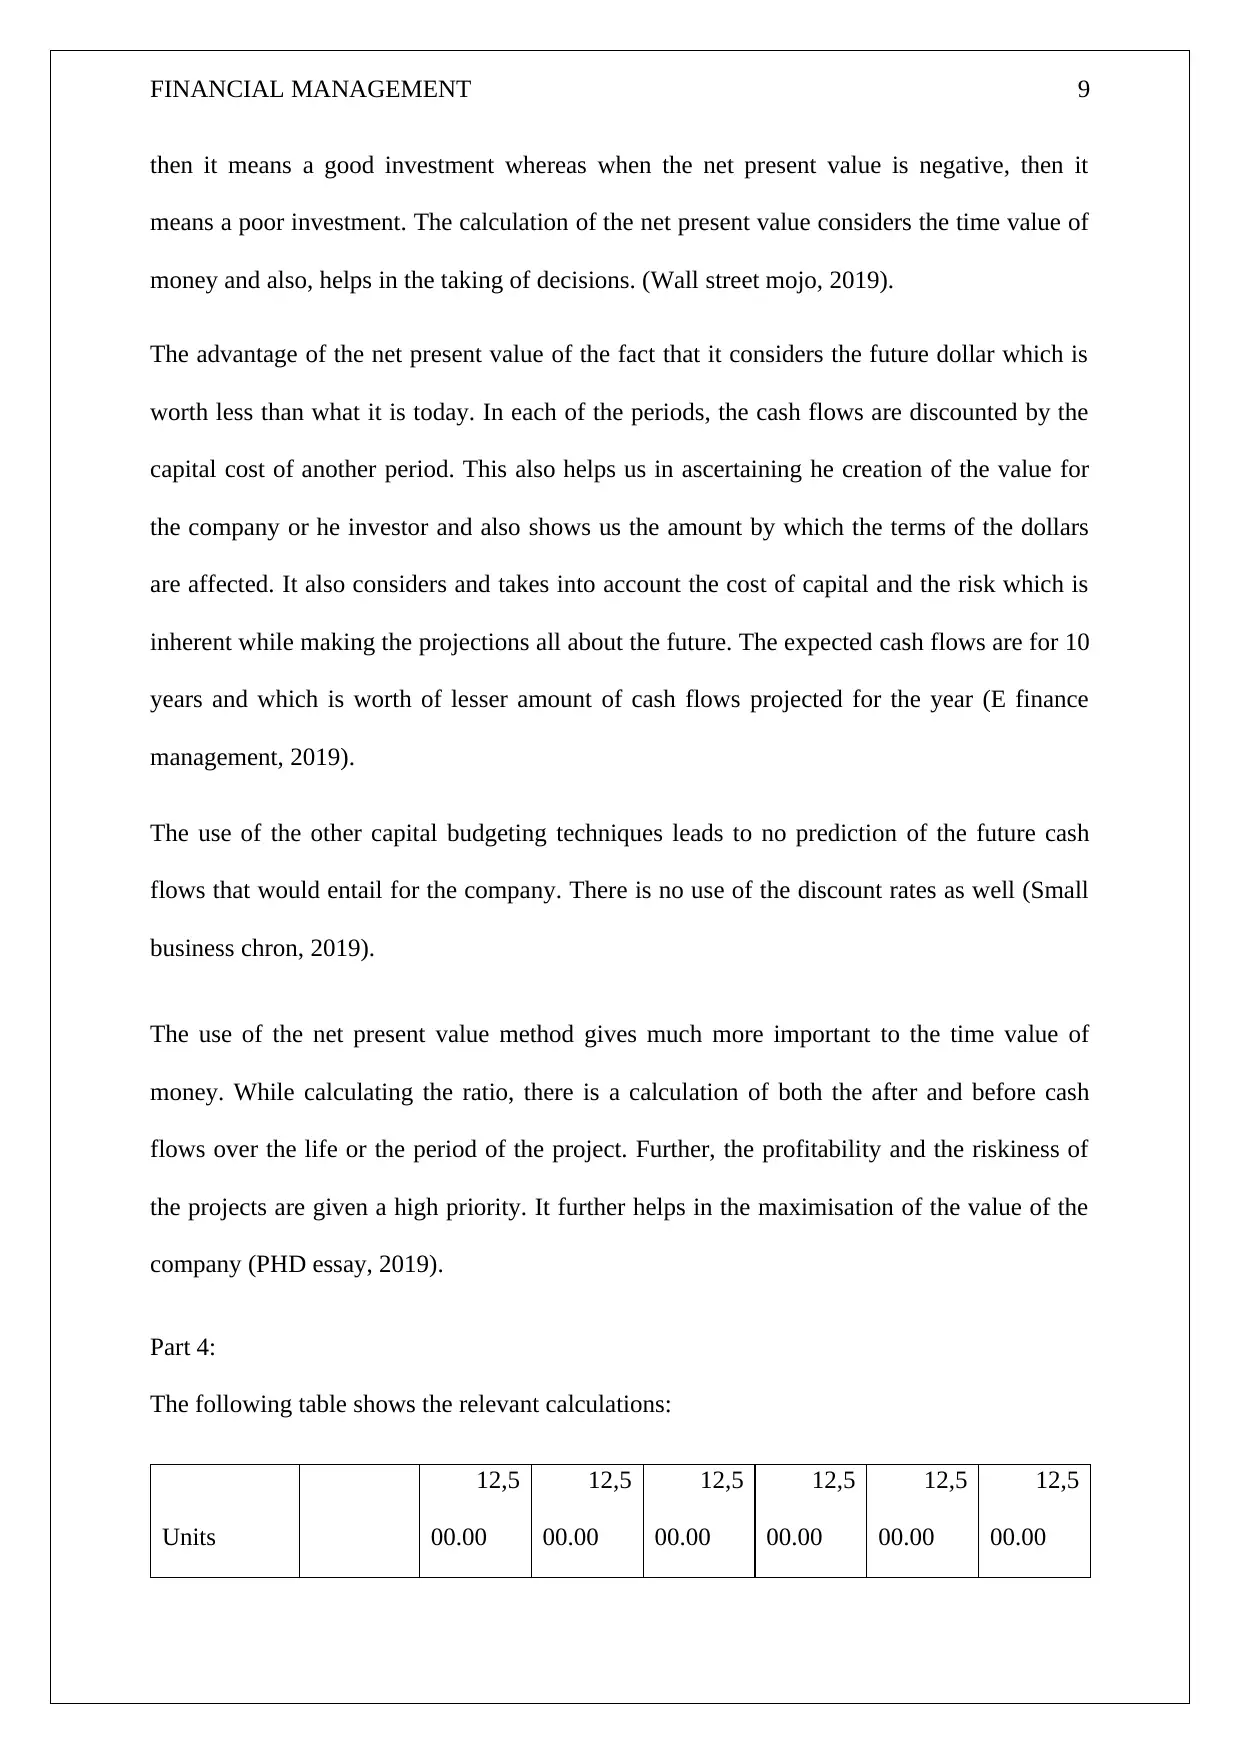
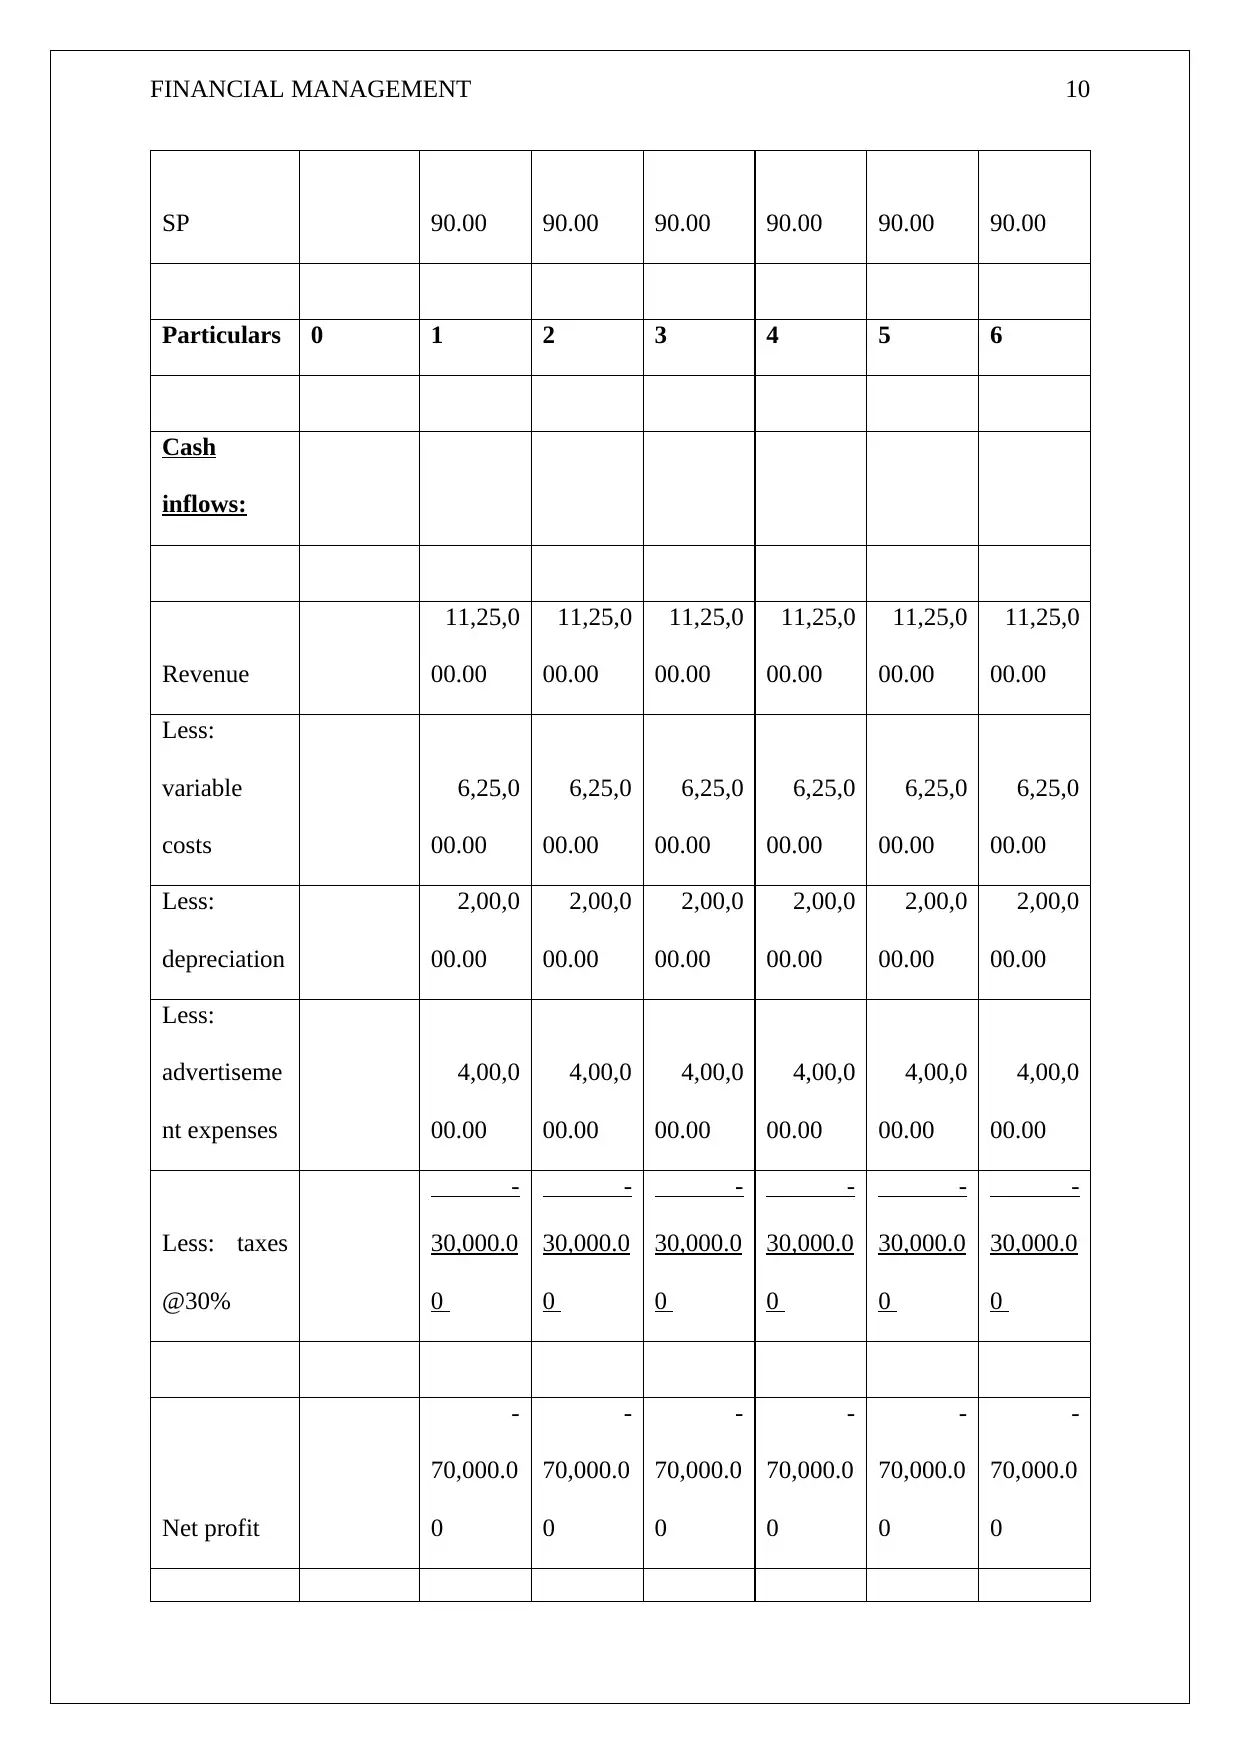
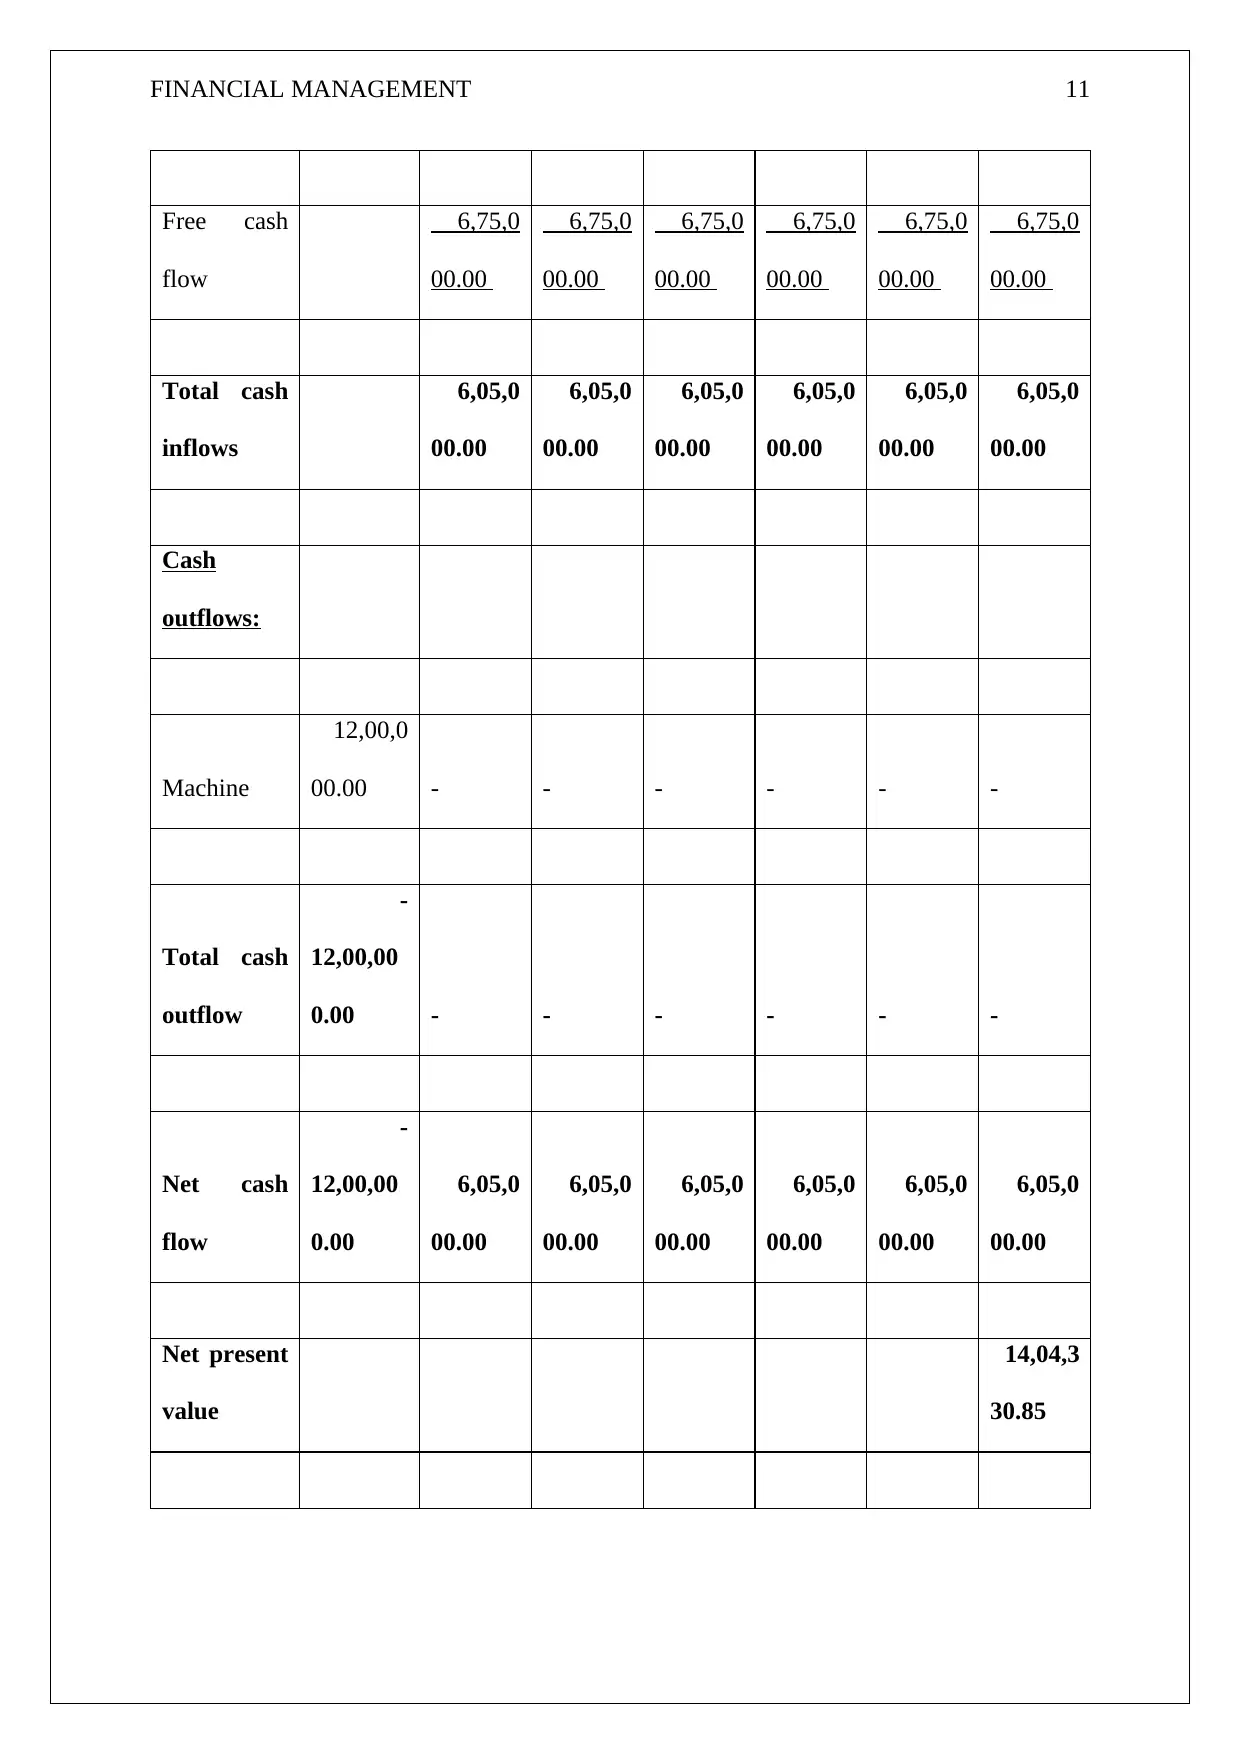
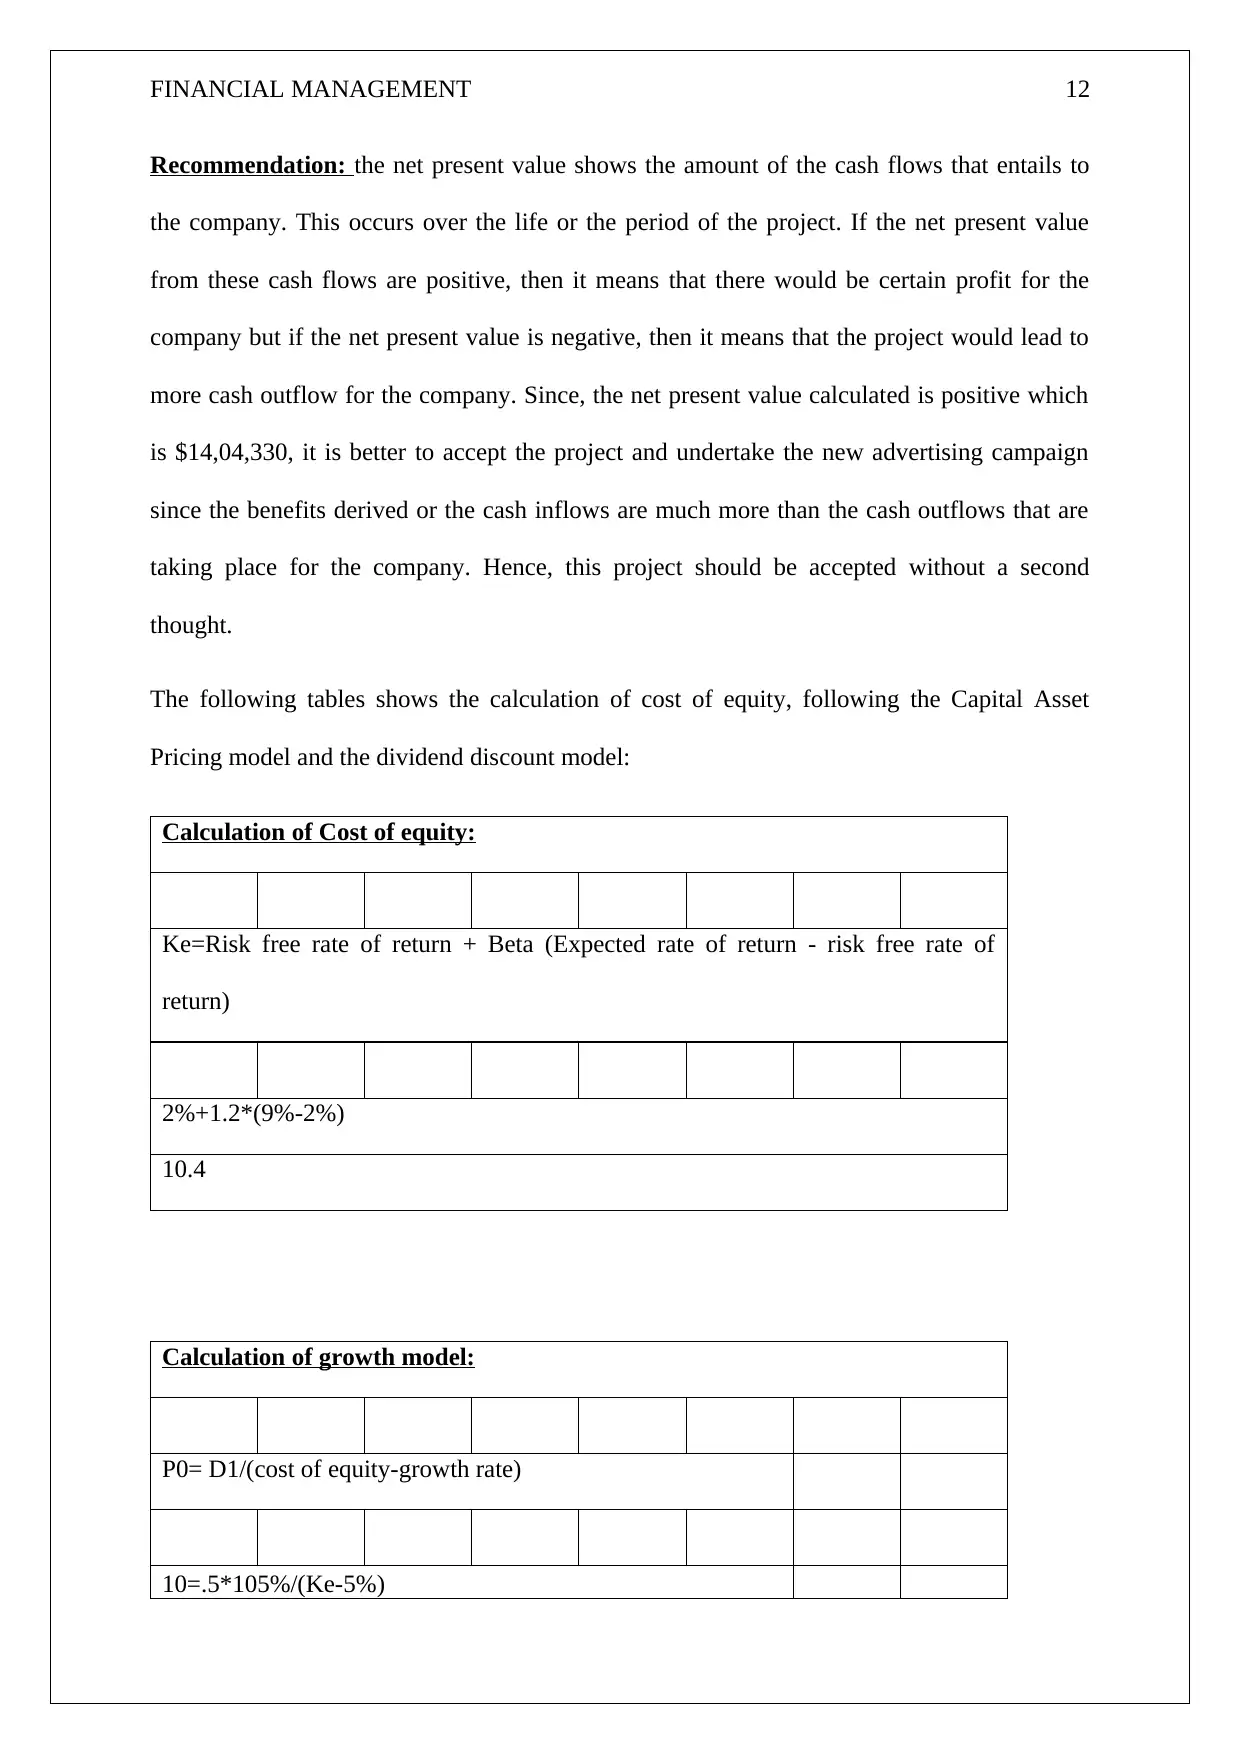
This financial management report delves into key concepts such as the cash conversion cycle, emphasizing its importance for small businesses in managing liquidity and short-term obligations. It explains the components of the cycle, including inventory days, accounts receivable days, and accounts payable days, and how they are calculated. The report then presents a cash flow analysis with detailed calculations of revenue, costs, and net profit over a six-year period, culminating in the determination of net present value (NPV). The NPV calculation incorporates the cost of equity using both the Capital Asset Pricing Model (CAPM) and the dividend growth model, leading to a recommendation to accept the project due to its positive NPV. The report also discusses the advantages of using NPV in capital budgeting, highlighting its consideration of the time value of money and its role in maximizing company value. The report concludes with a comparative analysis of financing options, evaluating the implications of issuing equity shares versus selling Australian bonds, to determine the optimal financing strategy.

FINANCIAL MANAGEMENT 1
FINANCIAL MANAGEMENT
Secure Best Marks with AI Grader
Need help grading? Try our AI Grader for instant feedback on your assignments.

FINANCIAL MANAGEMENT 2
Contents
Part 1:.........................................................................................................................................3
Part 2:.........................................................................................................................................4
Part 3:.........................................................................................................................................6
Part 4:.........................................................................................................................................7
Part 5:.......................................................................................................................................10
References................................................................................................................................11

FINANCIAL MANAGEMENT 3
Part 1:
Any small business would be very cautious about the liquidity in its business operations. It is
of an utmost importance which means that the company must have enough cash so that it is
able to pay the short term bills in the future. It is due to this reason that the owners of any
business are very stringent about the cash conversion cycle. This is the concept which deals
with the monitoring of cash to receive the cash for the inventory that it sells. A main thing in
this is the accounts payable period. The longer this period is, the shorter is its cycle.
The cash conversion cycle is the one which is calculated using the data which is available on
the balance sheet of the company and the income statements of the company. It comprises of
mainly 3 parts, the first one being inventory days that tells us the number of days from which
the inventory has been sitting in the warehouse, the second one is the account receivable days
which indicates the number of days it takes the customers to pay off the invoices and settle
their payments. The third is the account payable days which indicates the number of days it
takes to pay the suppliers for the purchases that it has made. Generally, the company wants
that the day’s inventory and the accounts receivables days must be low and the accounts
payable days should be high.
The following is the formula for the purposes of calculating cash conversion cycle:
CCC equals (Inventory days) plus (Accounts receivable days) minus (Accounts payable days)
This concept works like this. Whenever any item or the product goes into inventory, then the
clock starts clicking. The more the number of days in which this product is sold, the longer
the period of the cycle gets. When this product or the item is sold, then the number of days it
takes to pay off the customers would be added to the above. This is of course assuming that
the credit sales has been made by the company. The longer the customer stakes to pay, the
longer the cycle gets. Then finally, the number of days that it takes to pay he accounts

FINANCIAL MANAGEMENT 4
payable or the trade payables would be subtracted from the above. The longer the period of
the accounts payable, the shorter is this cash conversion cycle.
In case, the company is aggressive when it comes to collecting money from the customers
and if the company only does cash sales and so, has 0 accounts receivables days, then it is
commendable for the company since then the company may be taking more days to pay its
accounts payables and so, it would have a negative cash conversion cycle. This would in turn
mean that the business operations of the company are being financed by the trade payables.
But the company is exposed to another risk which is that this could strain the relationship
between the company and the suppliers. Generally, the company has to maintain a balance
between the trade payables and the trade debtors (Small business chron, 2019).
The day’s payable outstanding is the one wherein the average number of days it takes for the
company to get back to the accounts payable. Hence, the day’s payable outstanding indicates
how well the company is able to manage its accounts payables. When the company has 10
days outstanding payable, then that would mean that the company takes about 10 days to get
back or to pay the outsiders (Apxium, 2019).
When this period is high, then it is advantageous for the company since it takes the company
a long period to pay off its creditors. When the company has enough cash in its hand, then
that would mean that it is being used for the purposes of financing the short term activities.
But if the company is taking too long to pay off its creditors, then it would have unhappy
creditors and they may refuse or deny the credit terms to the company. When this period is
high, then that may indicate that the company has been struggling to find cash in order to pay
its creditors. Hence, a higher days outstanding payable means better credit terms than the
competitors or inability to pay the creditors on time (Corporate finance institute, 2019).
Secure Best Marks with AI Grader
Need help grading? Try our AI Grader for instant feedback on your assignments.

FINANCIAL MANAGEMENT 5
Whereas, on the other hand, when the company has a low days payable period then that may
indicate that the company has not been financing its business operations in the most efficient
manner. It may also be possible that the company could have some short term credit
arrangements with its creditors. Hence the lower period may indicate that the company is not
utilising the credit period allowed to the company offered by the creditors (My accounting
course, 2019).
An average payment period is the solvency ratio which helps in the measurement of the
average number of the days that the company takes in order to pay off its vendors for the
amount of the purchases that it had made from the trade creditors. There are a lot of times
when the company buys or purchases goods in bulk and hence these credit arrangements for
those purposes.
If the company goes for the increasing the customer collection period from 20 to 40 days,
then that would merely mean granting more days to the debtors to make payment for the sales
made. But this would also mean blocking of the capital or the working capital in the business
operations which would mean more capital would be required to be introduced into the
company. Hence, the increase of these days is not recommended.
Part 2:
The following table shows the relevant calculations:
Units
12,5
00.00
12,5
00.00
12,5
00.00
12,5
00.00
12,5
00.00
12,5
00.00
SP 90.00 90.00 90.00 90.00 90.00 90.00

FINANCIAL MANAGEMENT 6
Particulars 0 1 2 3 4 5 6
Cash
inflows:
Revenue
11,25,0
00.00
11,25,0
00.00
11,25,0
00.00
11,25,0
00.00
11,25,0
00.00
11,25,0
00.00
Less:
variable
costs
6,25,0
00.00
6,25,0
00.00
6,25,0
00.00
6,25,0
00.00
6,25,0
00.00
6,25,0
00.00
Less:
depreciation
2,00,0
00.00
2,00,0
00.00
2,00,0
00.00
2,00,0
00.00
2,00,0
00.00
2,00,0
00.00
Less:
advertiseme
nt expenses
4,00,0
00.00
4,00,0
00.00
4,00,0
00.00
4,00,0
00.00
4,00,0
00.00
4,00,0
00.00
Less: taxes
@30%
-
30,000.0
0
-
30,000.0
0
-
30,000.0
0
-
30,000.0
0
-
30,000.0
0
-
30,000.0
0
Net profit
-
70,000.0
0
-
70,000.0
0
-
70,000.0
0
-
70,000.0
0
-
70,000.0
0
-
70,000.0
0
Free cash
flow
6,75,0
00.00
6,75,0
00.00
6,75,0
00.00
6,75,0
00.00
6,75,0
00.00
6,75,0
00.00

FINANCIAL MANAGEMENT 7
Total cash
inflows
6,05,0
00.00
6,05,0
00.00
6,05,0
00.00
6,05,0
00.00
6,05,0
00.00
6,05,0
00.00
Cash
outflows:
Machine
12,00,0
00.00 - - - - - -
Total cash
outflow
-
12,00,00
0.00 - - - - - -
Net cash
flow
-
12,00,00
0.00
6,05,0
00.00
6,05,0
00.00
6,05,0
00.00
6,05,0
00.00
6,05,0
00.00
6,05,0
00.00
Net present
value
14,04,3
30.85
Working note:
Calculation of Cost of equity: following CAPM model
Total cash
inflows
6,05,0
00.00
6,05,0
00.00
6,05,0
00.00
6,05,0
00.00
6,05,0
00.00
6,05,0
00.00
Cash
outflows:
Machine
12,00,0
00.00 - - - - - -
Total cash
outflow
-
12,00,00
0.00 - - - - - -
Net cash
flow
-
12,00,00
0.00
6,05,0
00.00
6,05,0
00.00
6,05,0
00.00
6,05,0
00.00
6,05,0
00.00
6,05,0
00.00
Net present
value
14,04,3
30.85
Working note:
Calculation of Cost of equity: following CAPM model
Paraphrase This Document
Need a fresh take? Get an instant paraphrase of this document with our AI Paraphraser

FINANCIAL MANAGEMENT 8
Ke=Risk free rate of return + Beta (Expected rate of return - risk free
rate of return)
2%+1.2(9%-2%)
10.4
Calculation of growth model: following dividend growth model
P0= D1/(cost of equity-growth rate)
10=.5*105%/(Ke-5%)
Ke-5%=.5*105%/10
5.0525
Conclusion: since the net present value of the cash flows for the company is positive, hence
the stated project should be accepted.
Part 3:
The best present value s the amount of money which is the excess of the net present value of
the cash inflows over the net present values of the cash outflows. This is the cash flow
technique of discounting which is used in the capital budgeting which in turn helps in the
determination of the viability of the project or the investment. This is the amount of the cash
flow which is discounted at the required rate of return. When the net present value is positive,

FINANCIAL MANAGEMENT 9
then it means a good investment whereas when the net present value is negative, then it
means a poor investment. The calculation of the net present value considers the time value of
money and also, helps in the taking of decisions. (Wall street mojo, 2019).
The advantage of the net present value of the fact that it considers the future dollar which is
worth less than what it is today. In each of the periods, the cash flows are discounted by the
capital cost of another period. This also helps us in ascertaining he creation of the value for
the company or he investor and also shows us the amount by which the terms of the dollars
are affected. It also considers and takes into account the cost of capital and the risk which is
inherent while making the projections all about the future. The expected cash flows are for 10
years and which is worth of lesser amount of cash flows projected for the year (E finance
management, 2019).
The use of the other capital budgeting techniques leads to no prediction of the future cash
flows that would entail for the company. There is no use of the discount rates as well (Small
business chron, 2019).
The use of the net present value method gives much more important to the time value of
money. While calculating the ratio, there is a calculation of both the after and before cash
flows over the life or the period of the project. Further, the profitability and the riskiness of
the projects are given a high priority. It further helps in the maximisation of the value of the
company (PHD essay, 2019).
Part 4:
The following table shows the relevant calculations:
Units
12,5
00.00
12,5
00.00
12,5
00.00
12,5
00.00
12,5
00.00
12,5
00.00

FINANCIAL MANAGEMENT 10
SP 90.00 90.00 90.00 90.00 90.00 90.00
Particulars 0 1 2 3 4 5 6
Cash
inflows:
Revenue
11,25,0
00.00
11,25,0
00.00
11,25,0
00.00
11,25,0
00.00
11,25,0
00.00
11,25,0
00.00
Less:
variable
costs
6,25,0
00.00
6,25,0
00.00
6,25,0
00.00
6,25,0
00.00
6,25,0
00.00
6,25,0
00.00
Less:
depreciation
2,00,0
00.00
2,00,0
00.00
2,00,0
00.00
2,00,0
00.00
2,00,0
00.00
2,00,0
00.00
Less:
advertiseme
nt expenses
4,00,0
00.00
4,00,0
00.00
4,00,0
00.00
4,00,0
00.00
4,00,0
00.00
4,00,0
00.00
Less: taxes
@30%
-
30,000.0
0
-
30,000.0
0
-
30,000.0
0
-
30,000.0
0
-
30,000.0
0
-
30,000.0
0
Net profit
-
70,000.0
0
-
70,000.0
0
-
70,000.0
0
-
70,000.0
0
-
70,000.0
0
-
70,000.0
0
Secure Best Marks with AI Grader
Need help grading? Try our AI Grader for instant feedback on your assignments.

FINANCIAL MANAGEMENT 11
Free cash
flow
6,75,0
00.00
6,75,0
00.00
6,75,0
00.00
6,75,0
00.00
6,75,0
00.00
6,75,0
00.00
Total cash
inflows
6,05,0
00.00
6,05,0
00.00
6,05,0
00.00
6,05,0
00.00
6,05,0
00.00
6,05,0
00.00
Cash
outflows:
Machine
12,00,0
00.00 - - - - - -
Total cash
outflow
-
12,00,00
0.00 - - - - - -
Net cash
flow
-
12,00,00
0.00
6,05,0
00.00
6,05,0
00.00
6,05,0
00.00
6,05,0
00.00
6,05,0
00.00
6,05,0
00.00
Net present
value
14,04,3
30.85

FINANCIAL MANAGEMENT 12
Recommendation: the net present value shows the amount of the cash flows that entails to
the company. This occurs over the life or the period of the project. If the net present value
from these cash flows are positive, then it means that there would be certain profit for the
company but if the net present value is negative, then it means that the project would lead to
more cash outflow for the company. Since, the net present value calculated is positive which
is $14,04,330, it is better to accept the project and undertake the new advertising campaign
since the benefits derived or the cash inflows are much more than the cash outflows that are
taking place for the company. Hence, this project should be accepted without a second
thought.
The following tables shows the calculation of cost of equity, following the Capital Asset
Pricing model and the dividend discount model:
Calculation of Cost of equity:
Ke=Risk free rate of return + Beta (Expected rate of return - risk free rate of
return)
2%+1.2*(9%-2%)
10.4
Calculation of growth model:
P0= D1/(cost of equity-growth rate)
10=.5*105%/(Ke-5%)

FINANCIAL MANAGEMENT 13
Ke-5%=.5*105%/10
5.0525
The above table shows the calculation of the cost of equity which stands at 10.4% or 5.25%.
Now, in the question given, the growth rate, if the company goes for the issue of its equity
hares, 5.25% or 10.4%, and the yield from the government bonds comes out to be 5% but if
the company sells its bonds of the government, then it will have to forgo the yield of 5%.
The following is the summary of the 2 options from which one has to be chosen:
Sale of
Australian
bonds
Issue
of
equity
shares
Cost of equity (CAPM) 10.40%
Cost of equity (dividend
growth) 5.25%
Yield 5%
Paraphrase This Document
Need a fresh take? Get an instant paraphrase of this document with our AI Paraphraser

FINANCIAL MANAGEMENT 14
If the company goes for the sale of the Australian bonds, then that would mean an extra .25%
or 5.4% growth in the capital of the company. Hence, the company should finance using the
proceeds from the sale of the Australian bonds.
Part 5:
If the company goes for the increasing the customer collection period from 20 to 40 days,
then that would merely mean granting more days to the debtors to make payment for the sales
made. But this would also mean blocking of the capital or the working capital in the business
operations which would mean more capital would be required to be introduced into the
company. Hence, the increase of these days is not recommended.
Further, for the purposes of financing of the business operations, the Australian bonds should
be sold since the opportunity cost of this sale is just 5% whereas it would be 5.25% or 10.4%,
in case the equity shares are issued by the company.

FINANCIAL MANAGEMENT 15
References:
Apxium.com. (2019). How Can Increased Debtor Days Affect Your Business?. [online]
Available at: https://www.apxium.com/news/how-can-increased-debtor-days-affect-your-
business [Accessed 10 Oct. 2019].
Corporate Finance Institute. (2019). Days Payable Outstanding - Know The Impact of High
or Low DPO. [online] Available at:
https://corporatefinanceinstitute.com/resources/knowledge/accounting/days-payable-
outstanding/ [Accessed 10 Oct. 2019].
eFinanceManagement.com. (2019). Advantages and Disadvantages of Net Present Value
(NPV) | eFM. [online] Available at:
https://efinancemanagement.com/investment-decisions/advantages-and-disadvantages-of-npv
[Accessed 10 Oct. 2019].
Free Essays - PhDessay.com. (2019). The Difference Between NPV and IRR. [online]
Available at: https://phdessay.com/the-advantages-and-disadvantages-of-usinfg-npv-net-
present-value-and-irr-internal-rate-of-return-npv-net-present-value/ [Accessed 10 Oct. 2019].
My Accounting Course. (2019). Average Payment Period Formula | Example | Calculation
Explanation. [online] Available at:
https://www.myaccountingcourse.com/financial-ratios/average-payment-period [Accessed 10
Oct. 2019].
Reddy, S. (2019). Advantages and Disadvantages of NPV (Net Present Value) | Examples.
[online] Wallstreetmojo.com. Available at: https://www.wallstreetmojo.com/advantages-and-
disadvantages-of-npv/ [Accessed 10 Oct. 2019].

FINANCIAL MANAGEMENT 16
Smallbusiness.chron.com. (2019). Advantages & Disadvantages of Net Present Value in
Project Selection. [online] Available at: https://smallbusiness.chron.com/advantages-
disadvantages-net-present-value-project-selection-54753.html [Accessed 10 Oct. 2019].
Smallbusiness.chron.com. (2019). What Effects Does a Longer Accounts Payable Period
Have on the Cash Conversion Cycle of a Firm?. [online] Available at:
https://smallbusiness.chron.com/effects-longer-accounts-payable-period-cash-conversion-
cycle-firm-61630.html [Accessed 10 Oct. 2019].
1 out of 16
Related Documents

Your All-in-One AI-Powered Toolkit for Academic Success.
 +13062052269
info@desklib.com
Available 24*7 on WhatsApp / Email
Unlock your academic potential
© 2024  |  Zucol Services PVT LTD  |  All rights reserved.