Financial Management Report: Ratio Analysis and Investment

Verified

Added on  2021/12/14

|27
|6586
|84
Report
AI Summary
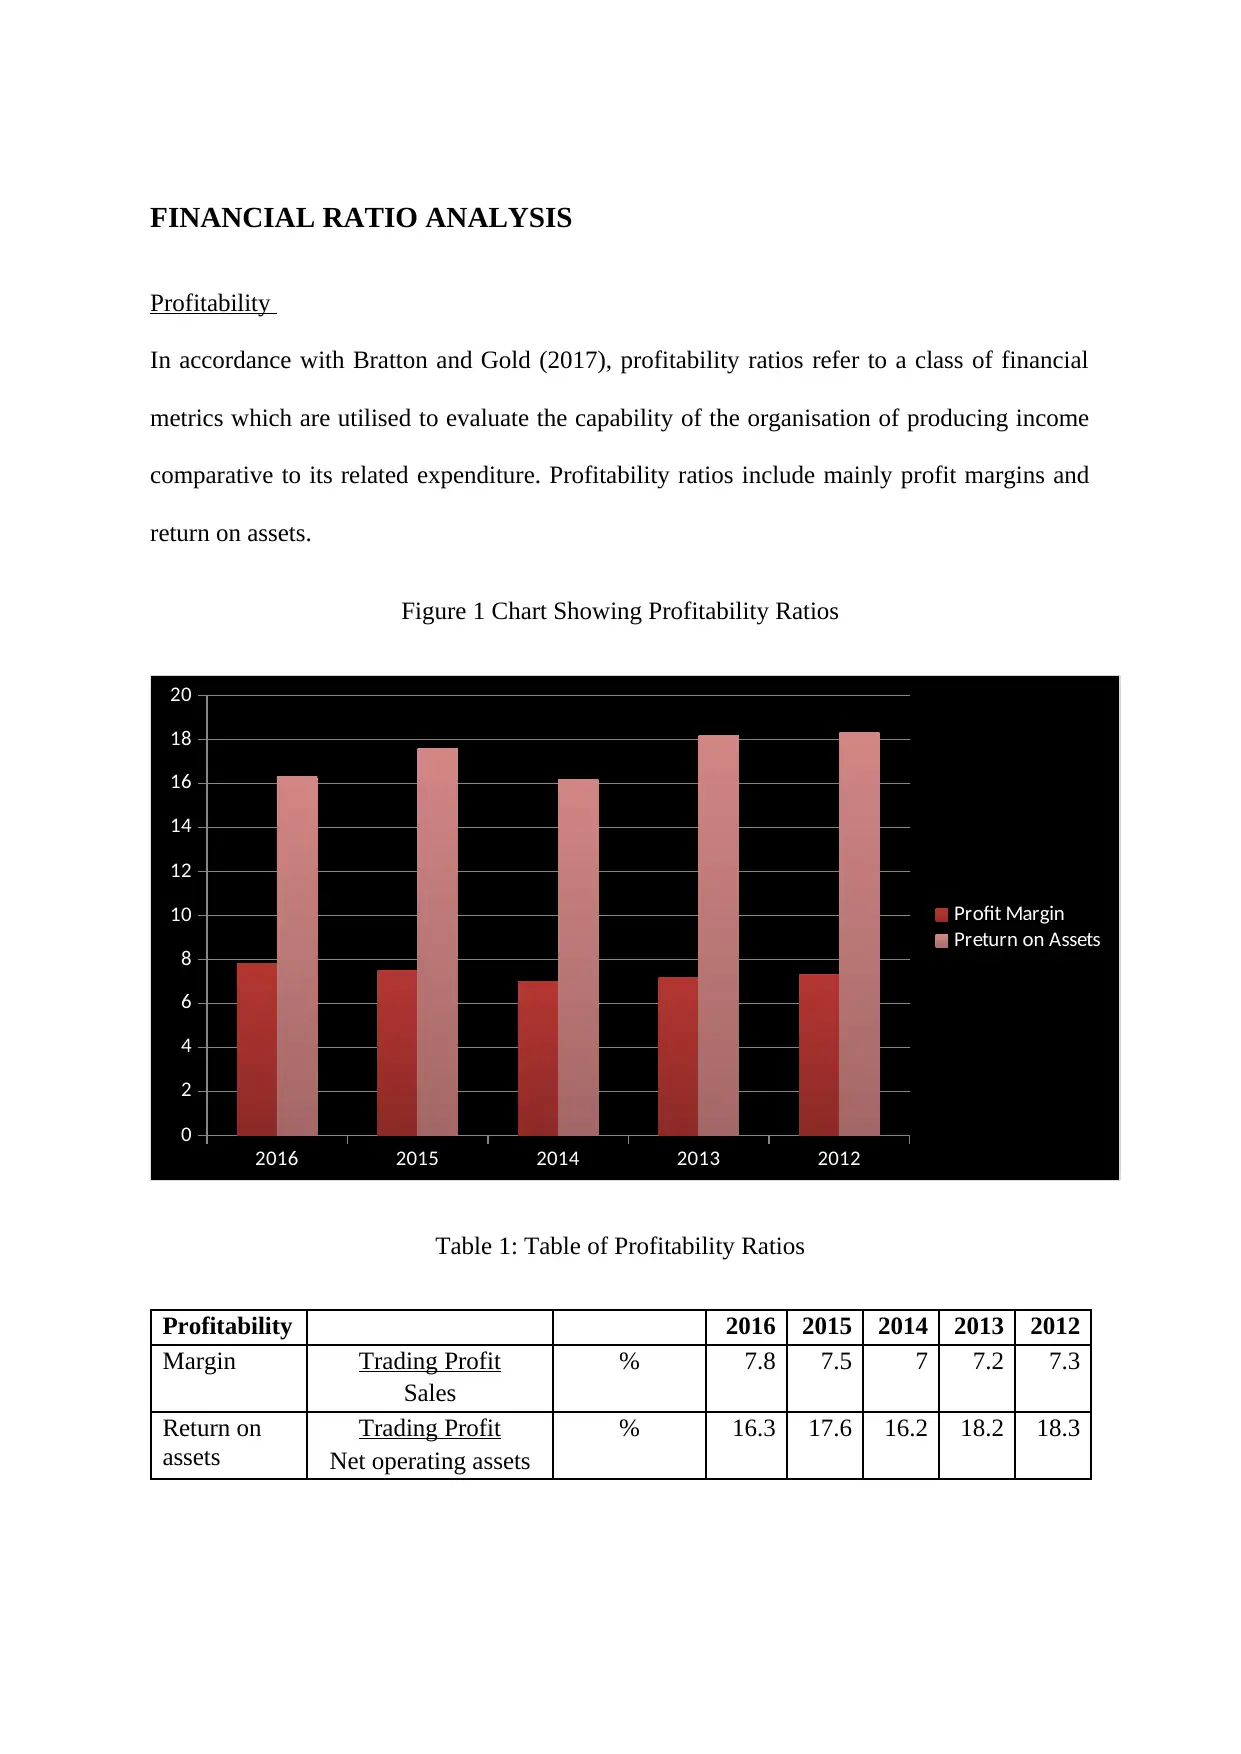
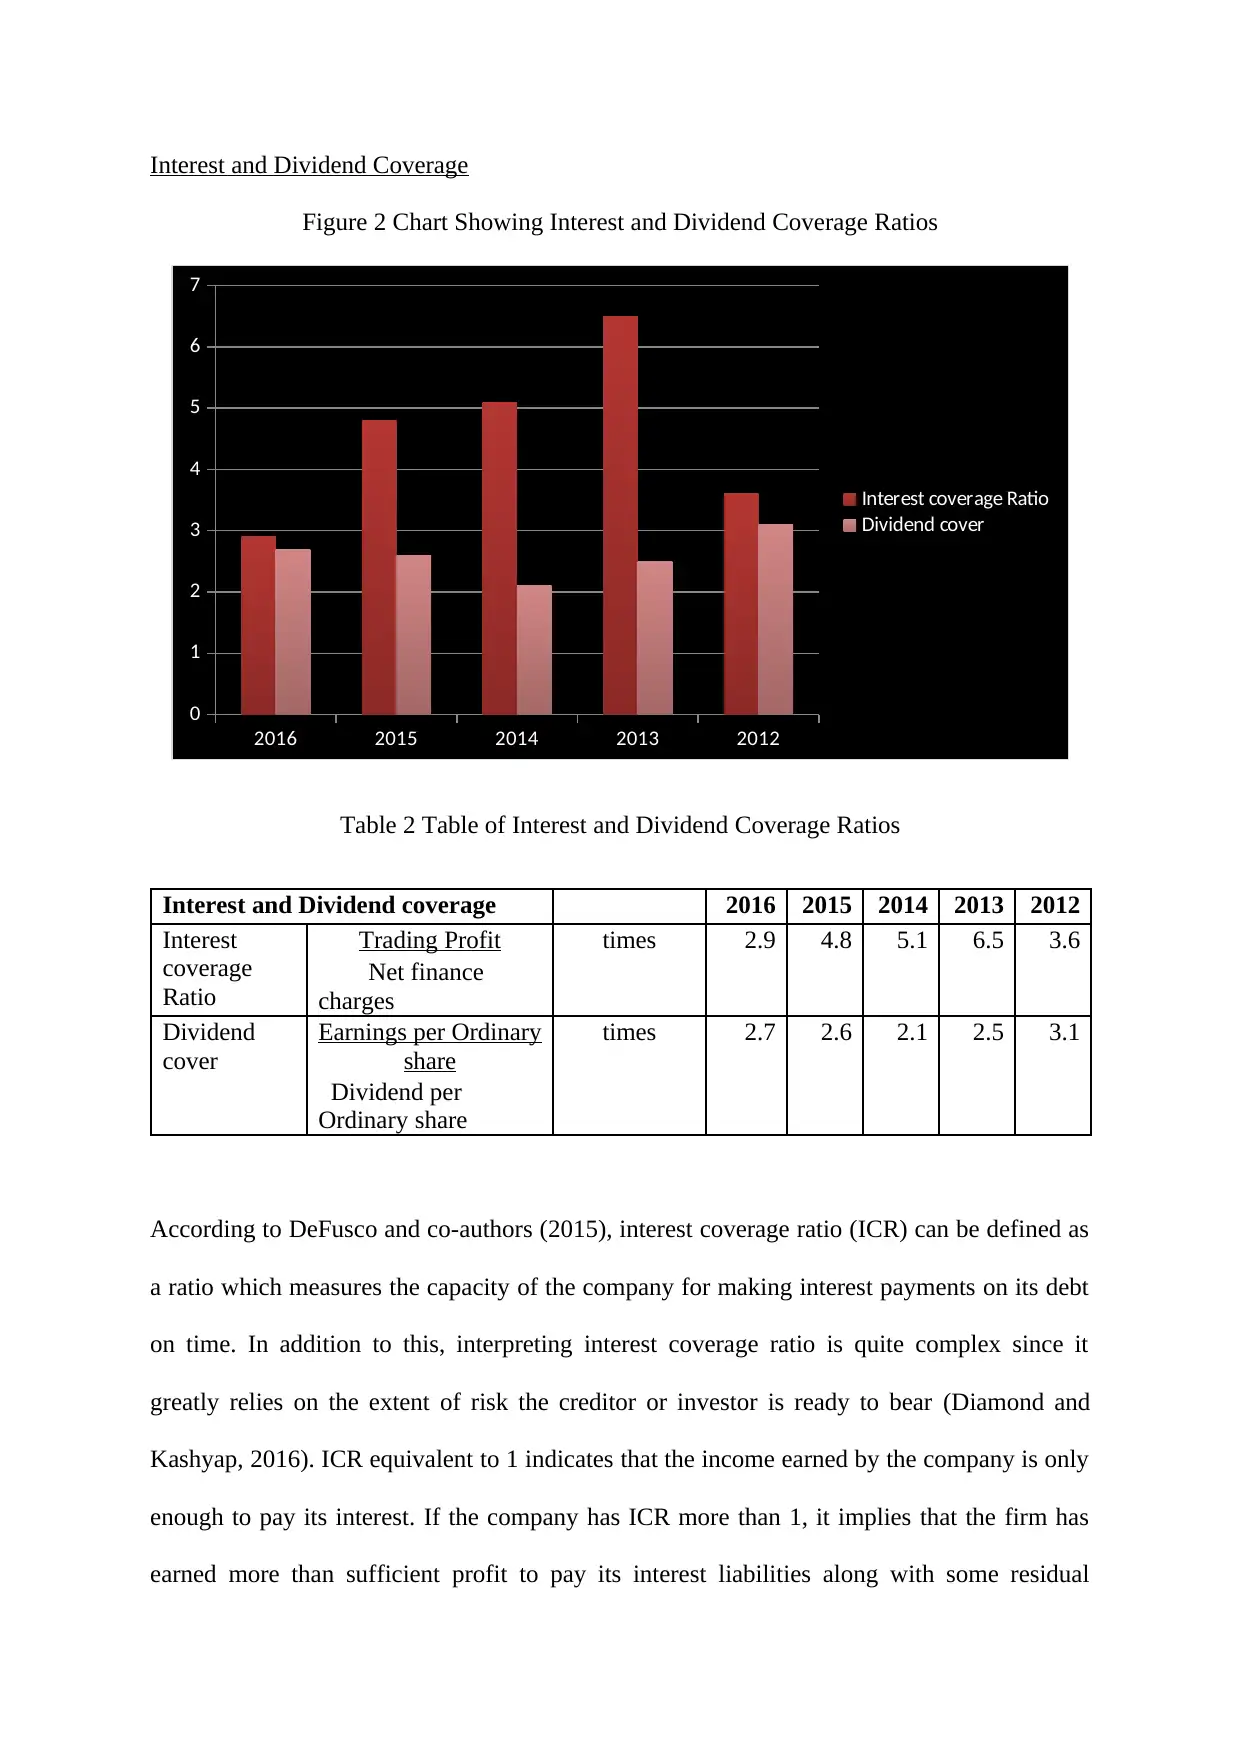
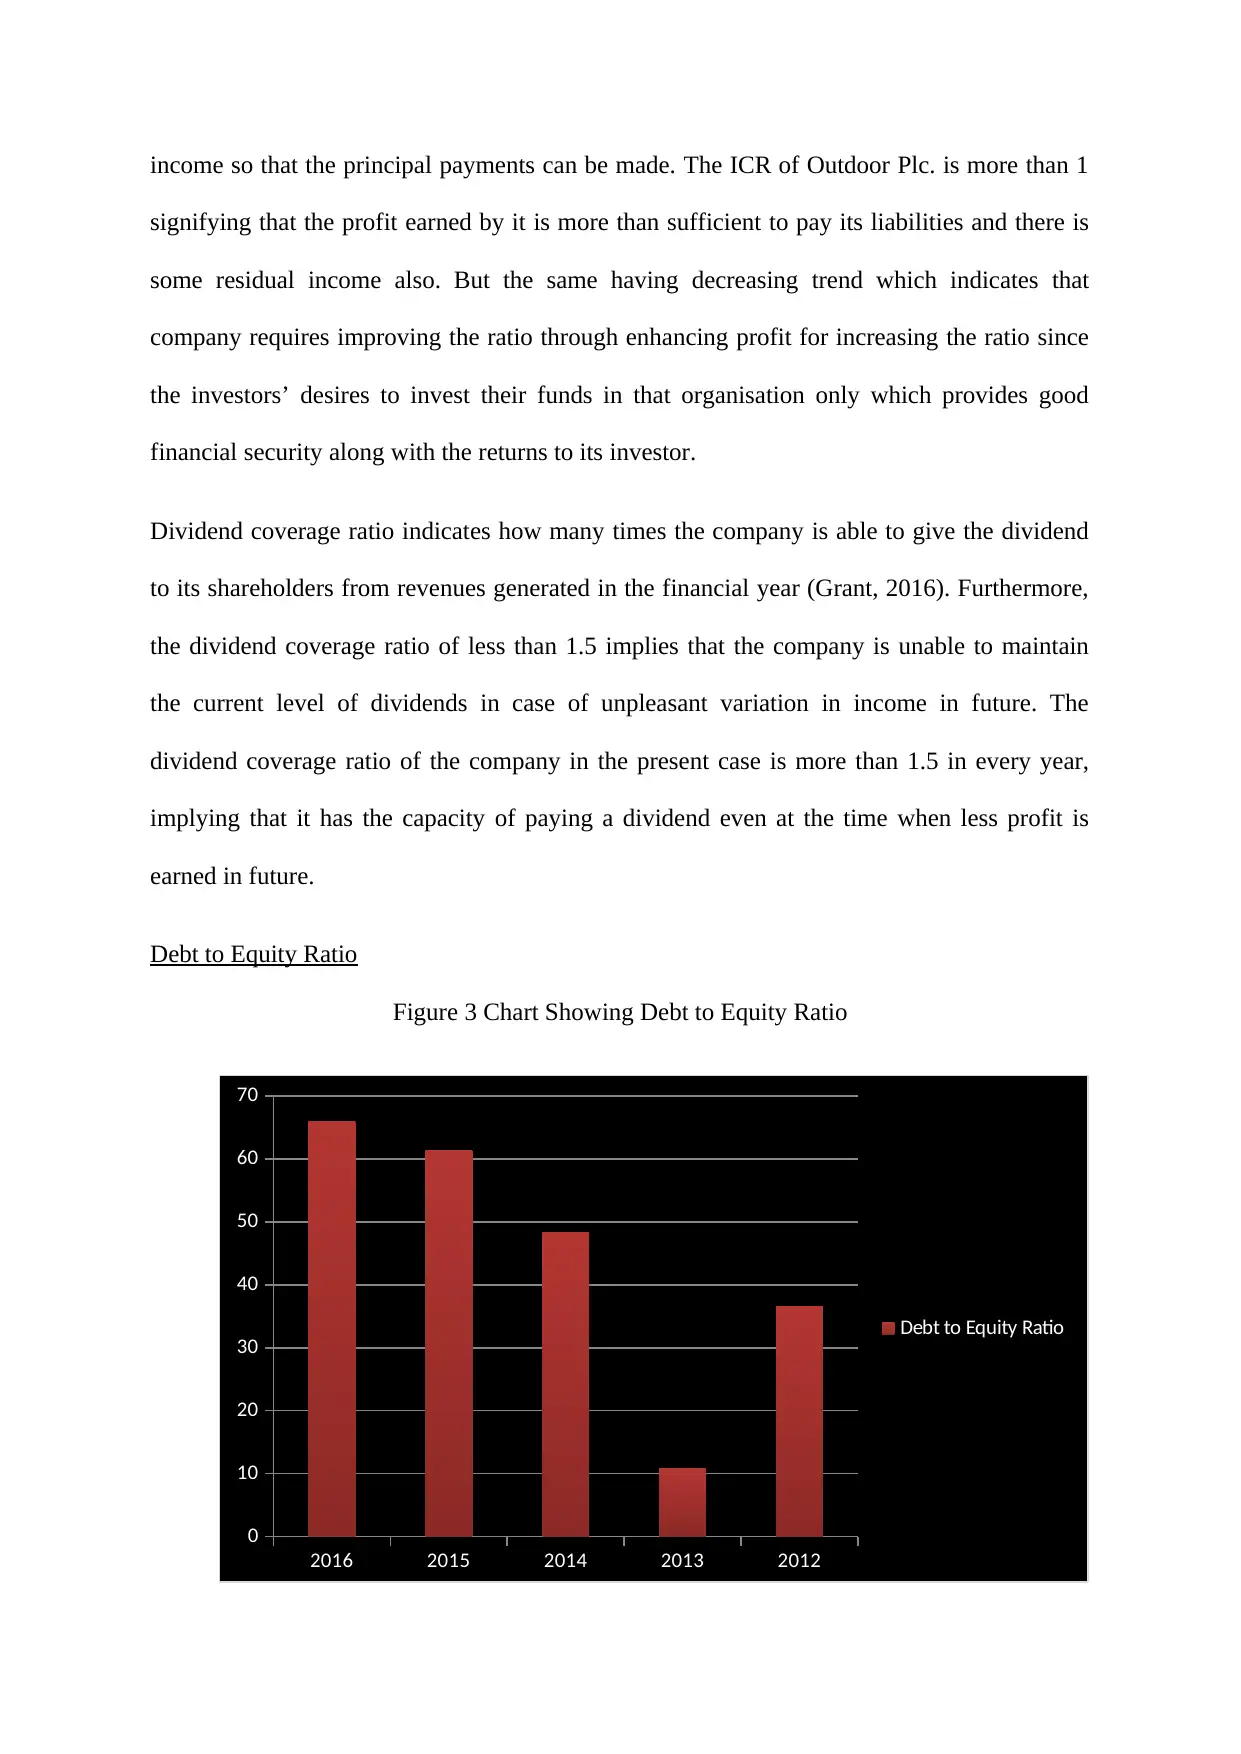
This financial management report presents a comprehensive analysis of Outdoor Plc.'s financial performance, utilizing various financial ratio analysis techniques and investment appraisal methods. The report begins by examining profitability ratios, including margin and return on assets, to assess the company's ability to generate income relative to its expenditures and assets. It then delves into interest and dividend coverage ratios, evaluating the company's capacity to meet its debt obligations and distribute dividends. Further, the report analyzes the debt-to-equity ratio and liquidity ratios to gauge the company's financial stability and short-term solvency. Asset ratios are also evaluated to determine the efficiency of asset utilization. The second part of the report focuses on investment appraisal techniques, specifically calculating the Net Present Value (NPV) and Internal Rate of Return (IRR) for different projects, and then comparing these methods to assess the best investment options. The report concludes with an overview of the main sources of finance, including owned and borrowed capital.
Document Page
FINANCIAL MANAGEMENT
tabler-icon-diamond-filled.svg

Paraphrase This Document

Need a fresh take? Get an instant paraphrase of this document with our AI Paraphraser
Document Page
TABLE OF CONTENTS
Financial Ratio Analysis............................................................................................................5
Profitability............................................................................................................................5
Interest and Dividend Coverage.............................................................................................7
Debt to Equity Ratio...............................................................................................................8
Liquidity Ratios......................................................................................................................9
Assets Ratios........................................................................................................................11
Investment appraisal techniques..............................................................................................13
(a) Calculation of Net Present Value...................................................................................13
(b) Calculation of Internal rate of return of project C..........................................................14
(c) (i) Selection of Net Present Value method as a best investment appraisal technique....14
(c) (ii) Non Discounting Methods of investment appraisals................................................16
(c) (iii) Factors impact on the investment decision..............................................................17
(d) Calculation of optimal investment policy if the project are divisible............................19
MAIN SOURCES OF FINANCE............................................................................................20
Financing through owned capital.........................................................................................20
Financing through the borrowed capital..............................................................................22
References................................................................................................................................24
Document Page
LIST OF TABLES
Table 1: Table of Profitability Ratios.........................................................................................4
Table 2 Table of Interest and Dividend Coverage Ratios..........................................................6
Table 3 Table of Debt to Equity Ratio.......................................................................................8
Table 4 Table of Liquidity Ratios..............................................................................................9
Table 5 Table of Assets Ratios.................................................................................................11
Document Page
LIST OF FIGURES
Figure 1 Chart Showing Profitability Ratios..............................................................................4
Figure 2 Chart Showing Interest and Dividend Coverage Ratios..............................................6
Figure 3 Chart Showing Debt to Equity Ratio...........................................................................7
Figure 4 Chart Showing Liquidity Ratios..................................................................................8
Figure 5 Chart Showing Assets Ratio......................................................................................10
tabler-icon-diamond-filled.svg

Paraphrase This Document

Need a fresh take? Get an instant paraphrase of this document with our AI Paraphraser
Document Page
FINANCIAL RATIO ANALYSIS
Profitability
In accordance with Bratton and Gold (2017), profitability ratios refer to a class of financial
metrics which are utilised to evaluate the capability of the organisation of producing income
comparative to its related expenditure. Profitability ratios include mainly profit margins and
return on assets.
Figure 1 Chart Showing Profitability Ratios
2016 2015 2014 2013 2012
0
2
4
6
8
10
12
14
16
18
20
Profit Margin
Preturn on Assets
Table 1: Table of Profitability Ratios
Profitability 2016 2015 2014 2013 2012
Margin Trading Profit % 7.8 7.5 7 7.2 7.3
Sales
Return on
assets
Trading Profit % 16.3 17.6 16.2 18.2 18.3
Net operating assets
Document Page
In order to evaluate the productivity of the firm at different cost levels, profit margins are
utilised comprising gross margin, operating margin, pre-tax margin as well as net profit
margin. Further, as per study of Clegg, Kornberger and Pitsis (2015), the margin shrinks as
layers of additional costs are considered for example cost of goods sold, operating and non-
operating expenditures along with taxes paid. Thus, in the present case, as the margin
percentage is increasing on a continuous basis, it can be assessed that the appropriate level of
additional cost exists in the company. The profit margin of Outdoor Plc. is boosting which
implies that the company is operating in an efficient manner due to which level of the profit
is increasing.
Profitability is evaluated in relation to costs and expenditures, and it is assessed in
comparison to assets in order to measure the effectiveness of an organisation under deploying
assets to produce sales and ultimately incomes. Further, Brigham and Ehrhardt, (2013),
specifies that the word return under ROA implies net profit that is the amount of income
earned from sales after including all costs, interest as well as expenditures. It is considered
that the increase in assets will lead to an increase in sales which in turn results in enhanced
profits. In the present case also the there is an increase in assets which leads to enhanced sales
and amplified profits. Moreover, ROA of Outdoor Plc of every year is positive which implies
upward profit trend that is the profit of the company keeps on increasing. The fact cannot be
denied that the company is having a positive return on assets, though it is fluctuated and not
sustainable. Thus, the company requires investigating this area in detail in order to apply
assets more effectively.
Document Page
Interest and Dividend Coverage
Figure 2 Chart Showing Interest and Dividend Coverage Ratios
2016 2015 2014 2013 2012
0
1
2
3
4
5
6
7
Interest coverage Ratio
Dividend cover
Table 2 Table of Interest and Dividend Coverage Ratios
Interest and Dividend coverage 2016 2015 2014 2013 2012
Interest
coverage
Ratio
Trading Profit times 2.9 4.8 5.1 6.5 3.6
Net finance
charges
Dividend
cover
Earnings per Ordinary
share
times 2.7 2.6 2.1 2.5 3.1
Dividend per
Ordinary share
According to DeFusco and co-authors (2015), interest coverage ratio (ICR) can be defined as
a ratio which measures the capacity of the company for making interest payments on its debt
on time. In addition to this, interpreting interest coverage ratio is quite complex since it
greatly relies on the extent of risk the creditor or investor is ready to bear (Diamond and
Kashyap, 2016). ICR equivalent to 1 indicates that the income earned by the company is only
enough to pay its interest. If the company has ICR more than 1, it implies that the firm has
earned more than sufficient profit to pay its interest liabilities along with some residual
tabler-icon-diamond-filled.svg

Paraphrase This Document

Need a fresh take? Get an instant paraphrase of this document with our AI Paraphraser
Document Page
income so that the principal payments can be made. The ICR of Outdoor Plc. is more than 1
signifying that the profit earned by it is more than sufficient to pay its liabilities and there is
some residual income also. But the same having decreasing trend which indicates that
company requires improving the ratio through enhancing profit for increasing the ratio since
the investors’ desires to invest their funds in that organisation only which provides good
financial security along with the returns to its investor.
Dividend coverage ratio indicates how many times the company is able to give the dividend
to its shareholders from revenues generated in the financial year (Grant, 2016). Furthermore,
the dividend coverage ratio of less than 1.5 implies that the company is unable to maintain
the current level of dividends in case of unpleasant variation in income in future. The
dividend coverage ratio of the company in the present case is more than 1.5 in every year,
implying that it has the capacity of paying a dividend even at the time when less profit is
earned in future.
Debt to Equity Ratio
Figure 3 Chart Showing Debt to Equity Ratio
2016 2015 2014 2013 2012
0
10
20
30
40
50
60
70
Debt to Equity Ratio
Document Page
Table 3 Table of Debt to Equity Ratio
Debt to Equity Ratio 2016 2015 2014 2013 2012
Net borrowings % 65.9 61.3 48.3 10.8 36.5
Shareholders’ funds
It is stated by Lasserre (2017), that, debt to equity ratio refers to the ratio which contrasts
total debt to total equity of the firm. This ratio shows the percentage of organisation financing
which arrives from creditors and investors. Debt source of finance is more costly in
comparison to equity financing. Moreover, lower debt to equity ratio indicates that the firm is
financially stable and vice-versa. The percentage of debt to equity ratio in the current case is
continuously increasing which implies that the company has financed its operations with
more of debt in comparison to equity. Such type of enhancement is considered riskier. It is
recommended to consider by Outdoor Plc. that unlike equity financing, debt should be
refurbished to the lender. As debt financing also obliges debt servicing or regular payment.
Furthermore, the company with excessive debt will not be able of paying its obligations.
Liquidity Ratios
Liquidity ratios can be defined as a class of financial metrics which is utilised to assess the
capability of the debtor to pay off current debt liabilities, not with increasing external capital.
Document Page
Figure 4 Chart Showing Liquidity Ratios
2016 2015 2014 2013 2012
0
0.2
0.4
0.6
0.8
1
1.2
1.4
1.6
1.8
2
Quick Ratio
Current Ratio
Table 4 Table of Liquidity Ratios
Liquidity
Ratios 2016 2015 2014 2013 2012
Quick ratio Current assets less
stock
% 0.74:1 0.73:1 0.78:1 1.13:1 0.93:
Current
liabilities
Current
ratio
Current assets % 1.34:1 1.30:1 1.42:1 1.79:1 1.75:1
Current liabilities
Quick Ratio
According to McLaney and Atrill (2014), the quick ratio indicates the short-term liability
position of the company as well as evaluates the capability of the firm to pay off its short-
term liabilities with its liquid assets. Along with this, it indicates the amount of cash as well
as other assets which are readily translatable into cash in contrast to short-term liabilities of
tabler-icon-diamond-filled.svg

Paraphrase This Document

Need a fresh take? Get an instant paraphrase of this document with our AI Paraphraser
Document Page
the firm. The ratio with less than 1 implies that the company is unable to its short-term
obligations. Further, the same can be observed in the present case that is the quick ratio of the
company is higher than 1 in the year 2013 only, indicating that it is not able of paying off its
short-term liabilities completely.
Current Ratio
The current ratio is utilised to assess short-term liquidity position of the organisation.
Moreover, with accordance to Ehiedu (2014), the reason behind naming this ratio as current
is, not like other liquidity ratios, it integrates all current assets as well as liabilities. The
current ratio is also referred to as a working capital ratio. Along with this, it also gives a
quantitative connection between current assets and current liabilities of the firm (Pearson
2016). The current ratio of Outdoor Plc. is more than 1 which indicates that the firm is a
desirable situation to pay off its short-term obligations. The same implies that the company
has a sufficient amount to pay its short-term liabilities. The company is suggested to improve
the efficiency of management so that the income can be increased and liabilities can be
decreased.
Assets Ratios
Asset turnover ratio refers to an efficiency ratio which evaluates the capacity of the firm of
producing sales from its assets through contrasting net sales with average total assets.
Document Page
Figure 5 Chart Showing Assets Ratio
2016 2015 2014 2013 2012
0
1
2
3
4
5
6
7
8
9
10
Operating asset turnover
Working capital turnover
Table 5 Table of Assets Ratios
Asset ratios 2016 2015 2014 2013 2012
Operating asset
turnover
Sales times 2.1 2.4 2.3 2.5 2.5
Net operating
assets
Working
capital turnover
Sales times 8.6 8 7 7.4 6.2
Working capital
Operating Asset Turnover
It is a ratio which shows a number of times operating assess is turnover in the year. Sweeting
(2017), asserts that this ratio is also known as operating current assets turnover ratio. The
operating turnover ratio of the present company is constantly decreasing which implies
inefficient utilisation of funds invested in current assets. Furthermore, retaining an
appropriate level of operating assets corresponding to the firm’s turnover is very significant.
Working Capital Turnover
Vernimmen, et al., (2014), asserts that this ratio estimates the efficiency level of the
organisation regarding utilisation of working capital to promote a specified level of sales. It is
chevron_up_icon
1 out of 27
circle_padding
hide_on_mobile
zoom_out_icon
[object Object]