Financial Management and Control: Pro Bio PLC Performance Analysis
VerifiedAdded on 2023/01/17
|21
|4489
|71
Report
AI Summary
This report provides a comprehensive financial analysis of Pro Bio PLC, evaluating its performance through various financial ratios, including profitability, liquidity, gearing, assets utilization, and investor potential ratios. It calculates and analyzes the working capital cycle, comparing the company's efficiency in converting current assets into cash over two years. The report also discusses the limitations of ratio analysis in both cross-sectional and time-series comparisons. Furthermore, it explores different investment appraisal techniques and various traditional budgeting methods. The analysis is based on the provided financial statements and aims to assess the company's financial health and identify areas for improvement. The report is structured into three parts, covering different aspects of financial management and control, and includes tables and graphs to support the analysis.

FINANCIAL
MANAGEMENT AND
CONTROL
MANAGEMENT AND
CONTROL
Paraphrase This Document
Need a fresh take? Get an instant paraphrase of this document with our AI Paraphraser
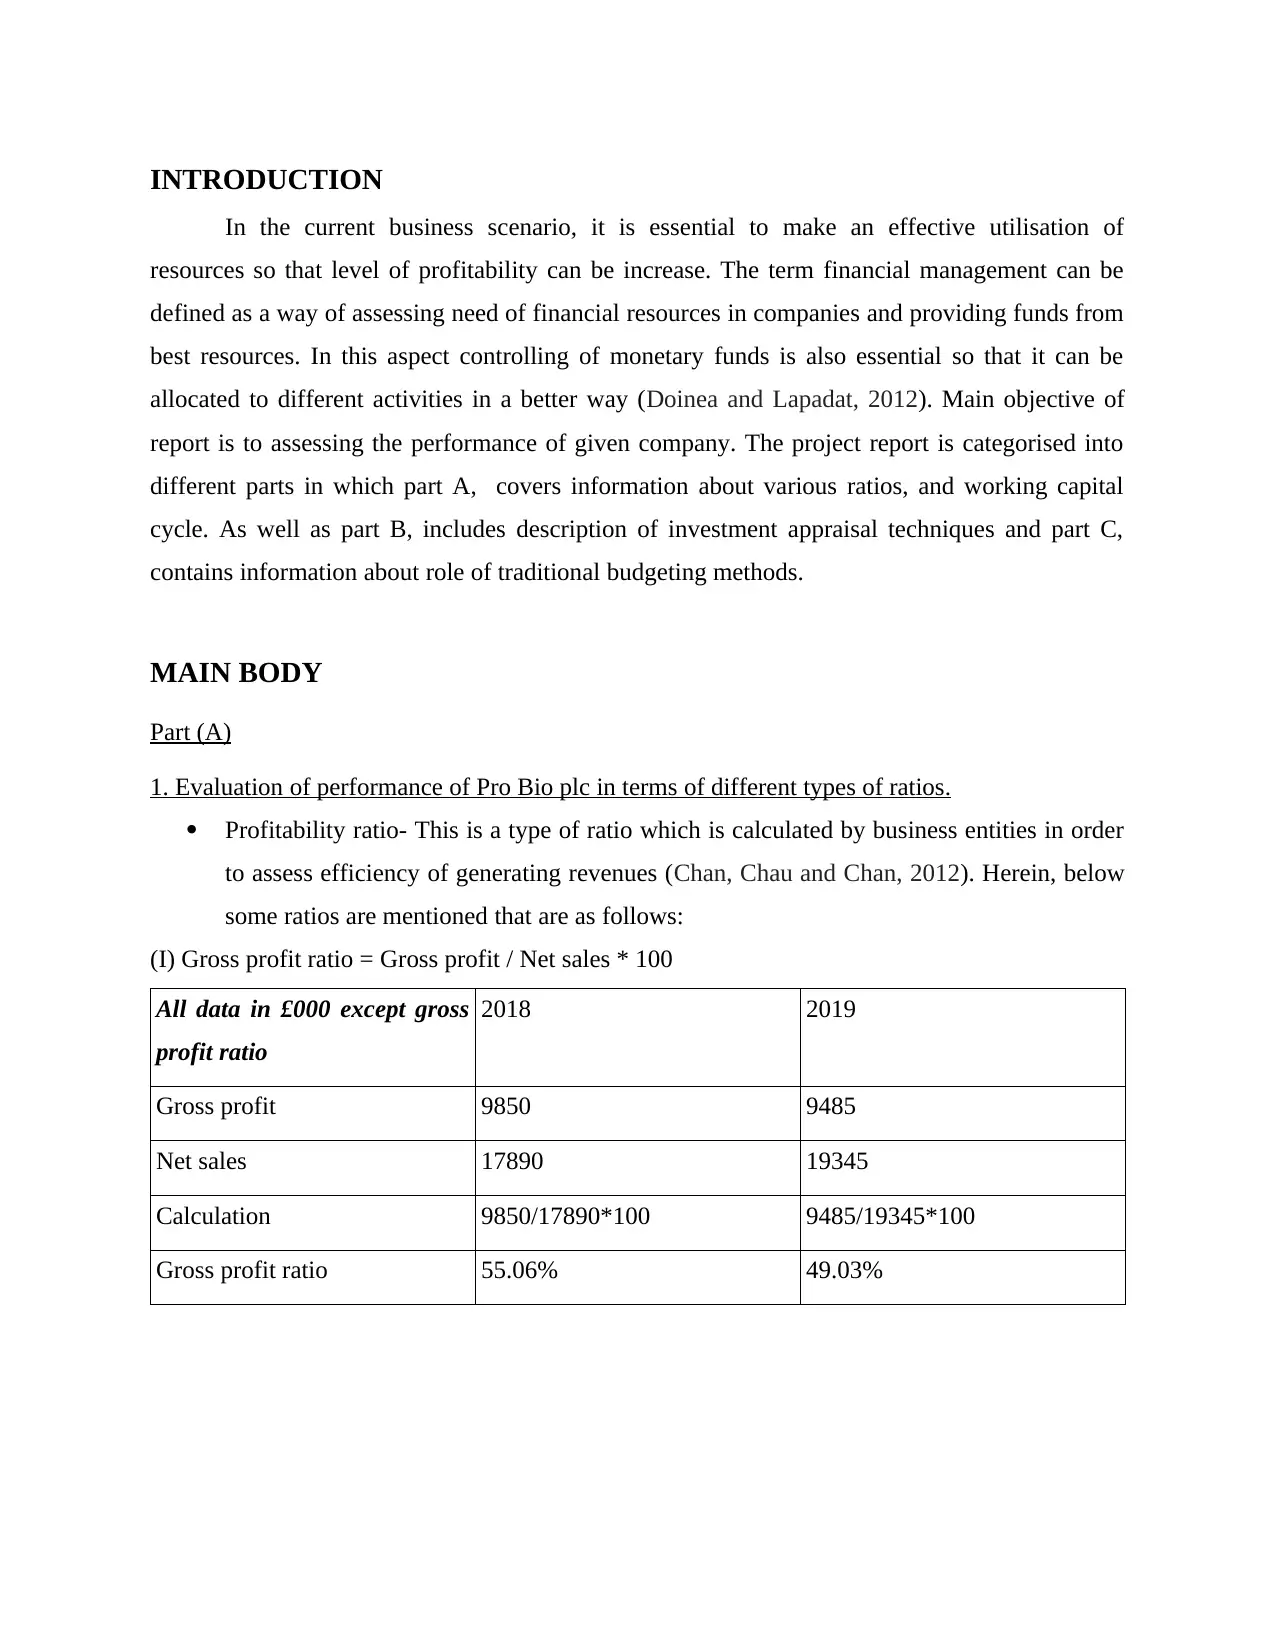
Table of Contents
INTRODUCTION...........................................................................................................................3
MAIN BODY...................................................................................................................................3
Part (A)........................................................................................................................................3
1. Evaluation of performance of Pro Bio plc in terms of different types of ratios......................3
2. Calculation of working capital cycle.....................................................................................10
3. Limitation of ratio analysis for both cross-sectional and time-series comparisons..............12
Part (B) .....................................................................................................................................13
1. Use of different types of investment appraisal techniques....................................................13
Part (C)......................................................................................................................................17
2. Use of various kinds of traditional budgeting methods........................................................17
CONCLUSION..............................................................................................................................18
REFERENCES..............................................................................................................................18
INTRODUCTION
In the current business scenario, it is essential to make an effective utilisation of
resources so that level of profitability can be increase. The term financial management can be
defined as a way of assessing need of financial resources in companies and providing funds from
best resources. In this aspect controlling of monetary funds is also essential so that it can be
allocated to different activities in a better way (Doinea and Lapadat, 2012). Main objective of
report is to assessing the performance of given company. The project report is categorised into
different parts in which part A, covers information about various ratios, and working capital
cycle. As well as part B, includes description of investment appraisal techniques and part C,
contains information about role of traditional budgeting methods.
MAIN BODY
Part (A)
1. Evaluation of performance of Pro Bio plc in terms of different types of ratios.
Profitability ratio- This is a type of ratio which is calculated by business entities in order
to assess efficiency of generating revenues (Chan, Chau and Chan, 2012). Herein, below
some ratios are mentioned that are as follows:
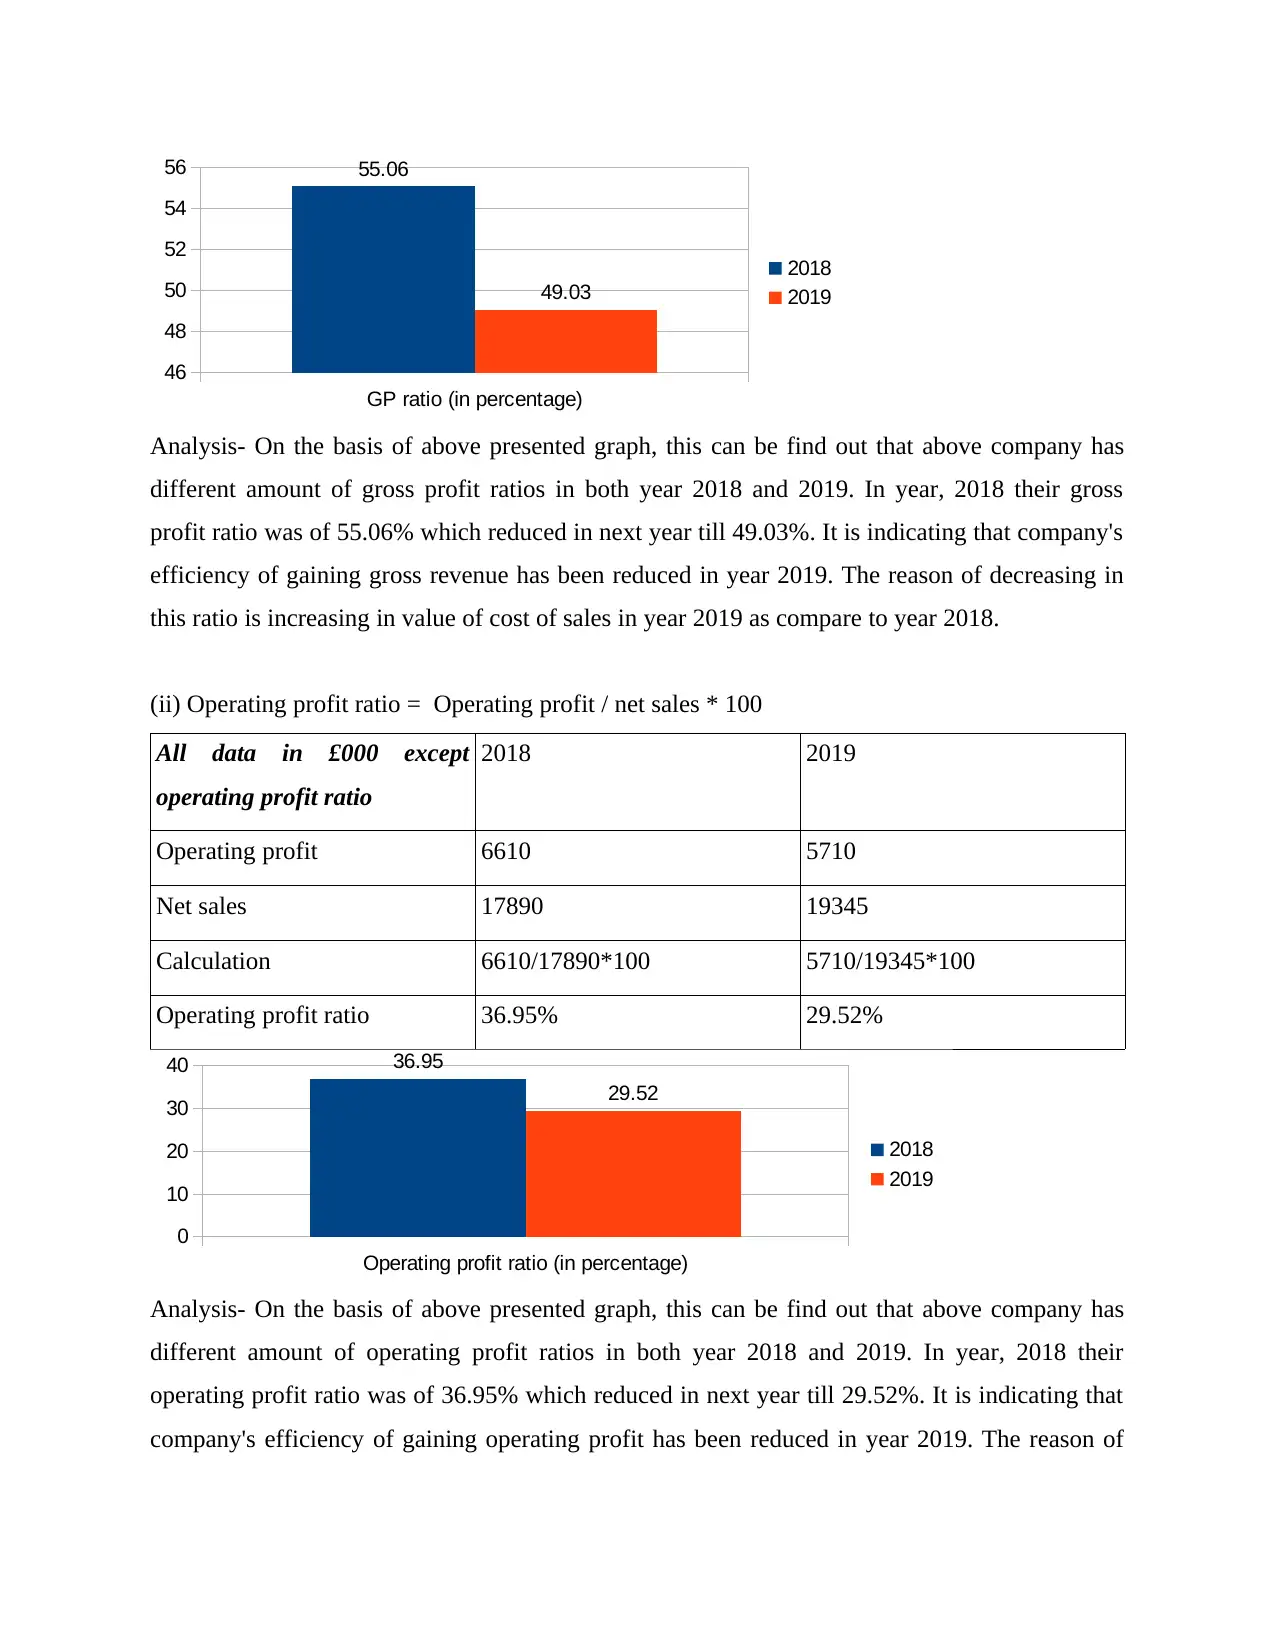
(I) Gross profit ratio = Gross profit / Net sales * 100
All data in £000 except gross
profit ratio
2018 2019
Gross profit 9850 9485
Net sales 17890 19345
Calculation 9850/17890*100 9485/19345*100
Gross profit ratio 55.06% 49.03%
In the current business scenario, it is essential to make an effective utilisation of
resources so that level of profitability can be increase. The term financial management can be
defined as a way of assessing need of financial resources in companies and providing funds from
best resources. In this aspect controlling of monetary funds is also essential so that it can be
allocated to different activities in a better way (Doinea and Lapadat, 2012). Main objective of
report is to assessing the performance of given company. The project report is categorised into
different parts in which part A, covers information about various ratios, and working capital
cycle. As well as part B, includes description of investment appraisal techniques and part C,
contains information about role of traditional budgeting methods.
MAIN BODY
Part (A)
1. Evaluation of performance of Pro Bio plc in terms of different types of ratios.
Profitability ratio- This is a type of ratio which is calculated by business entities in order
to assess efficiency of generating revenues (Chan, Chau and Chan, 2012). Herein, below
some ratios are mentioned that are as follows:
(I) Gross profit ratio = Gross profit / Net sales * 100
All data in £000 except gross
profit ratio
2018 2019
Gross profit 9850 9485
Net sales 17890 19345
Calculation 9850/17890*100 9485/19345*100
Gross profit ratio 55.06% 49.03%
⊘ This is a preview!⊘
Do you want full access?
Subscribe today to unlock all pages.
Trusted by 1+ million students worldwide
GP ratio (in percentage)
46
48
50
52
54
56 55.06
49.03
2018
2019
Analysis- On the basis of above presented graph, this can be find out that above company has
different amount of gross profit ratios in both year 2018 and 2019. In year, 2018 their gross
profit ratio was of 55.06% which reduced in next year till 49.03%. It is indicating that company's
efficiency of gaining gross revenue has been reduced in year 2019. The reason of decreasing in
this ratio is increasing in value of cost of sales in year 2019 as compare to year 2018.
(ii) Operating profit ratio = Operating profit / net sales * 100
All data in £000 except
operating profit ratio
2018 2019
Operating profit 6610 5710
Net sales 17890 19345
Calculation 6610/17890*100 5710/19345*100
Operating profit ratio 36.95% 29.52%
Operating profit ratio (in percentage)
0
10
20
30
40 36.95
29.52
2018
2019
Analysis- On the basis of above presented graph, this can be find out that above company has
different amount of operating profit ratios in both year 2018 and 2019. In year, 2018 their
operating profit ratio was of 36.95% which reduced in next year till 29.52%. It is indicating that
company's efficiency of gaining operating profit has been reduced in year 2019. The reason of
Paraphrase This Document
Need a fresh take? Get an instant paraphrase of this document with our AI Paraphraser
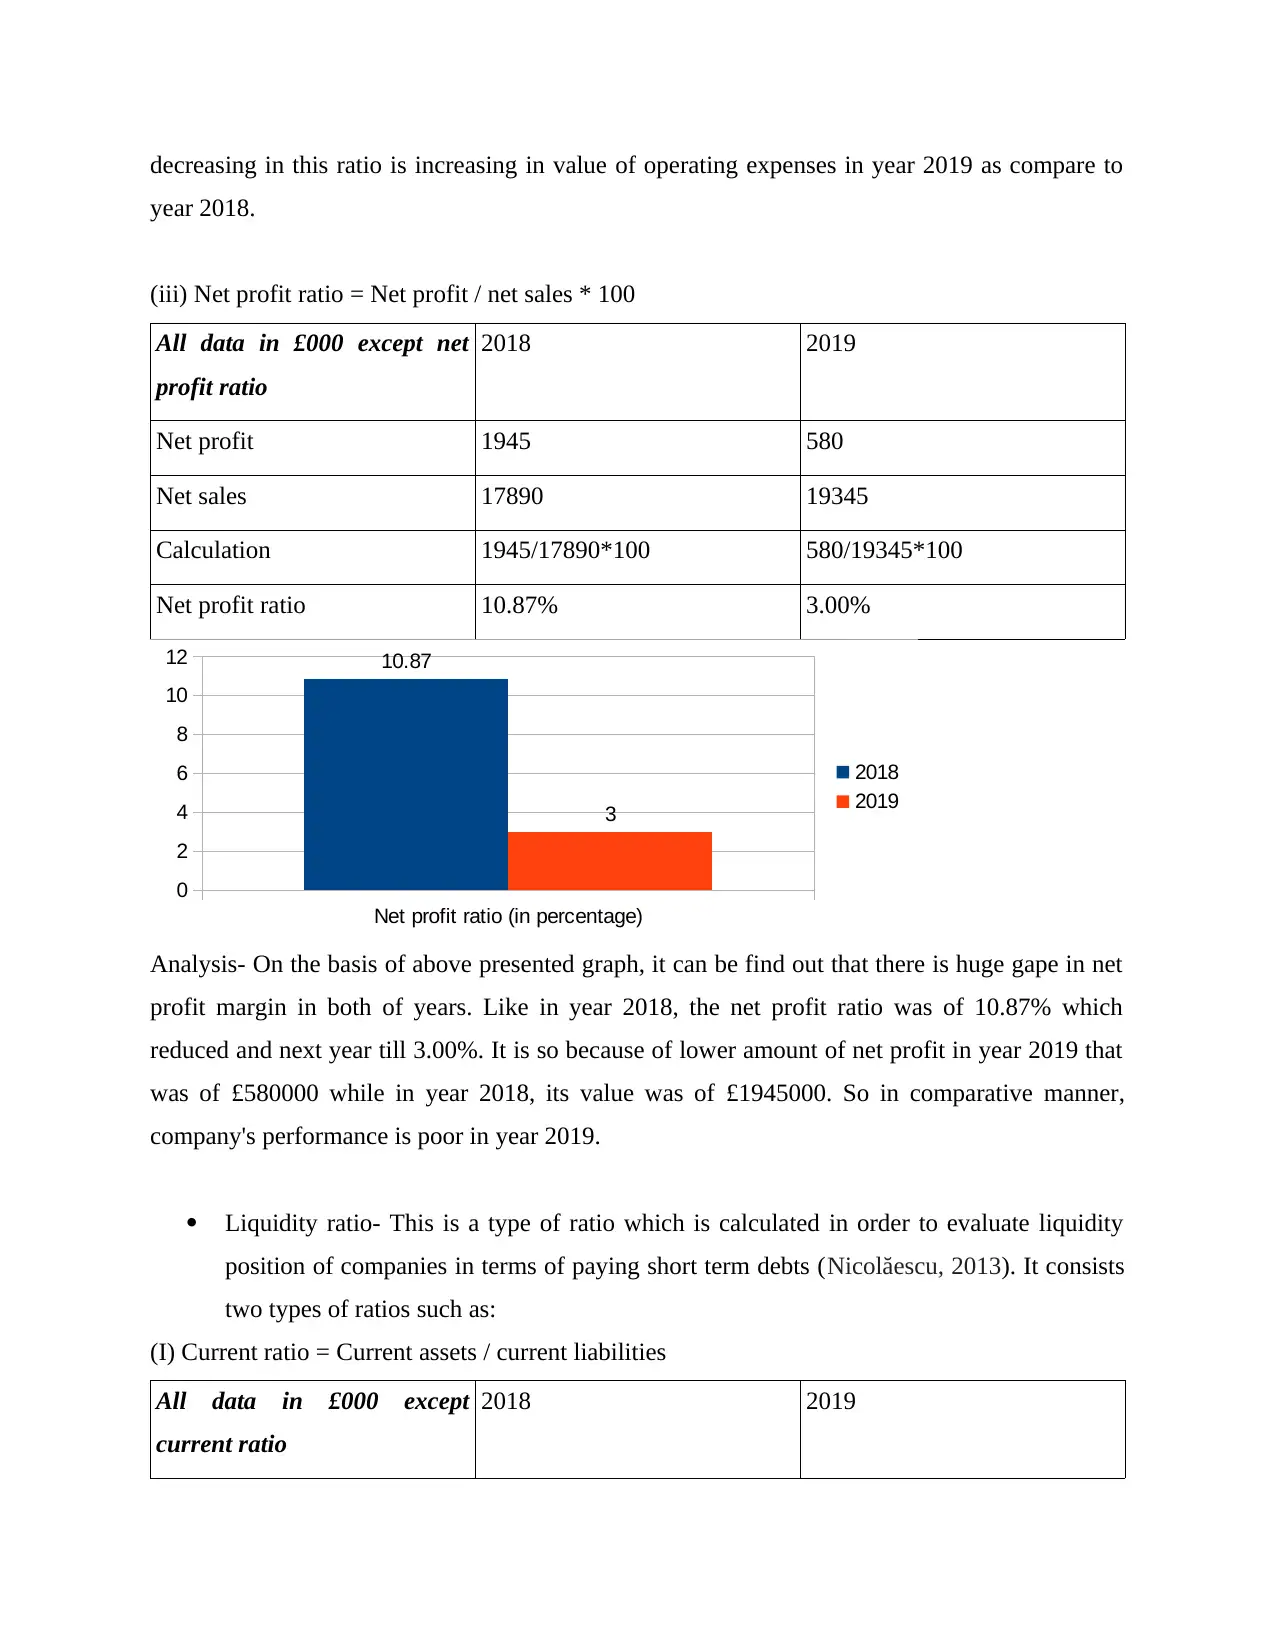
decreasing in this ratio is increasing in value of operating expenses in year 2019 as compare to
year 2018.
(iii) Net profit ratio = Net profit / net sales * 100
All data in £000 except net
profit ratio
2018 2019
Net profit 1945 580
Net sales 17890 19345
Calculation 1945/17890*100 580/19345*100
Net profit ratio 10.87% 3.00%
Net profit ratio (in percentage)
0
2
4
6
8
10
12 10.87
3
2018
2019
Analysis- On the basis of above presented graph, it can be find out that there is huge gape in net
profit margin in both of years. Like in year 2018, the net profit ratio was of 10.87% which
reduced and next year till 3.00%. It is so because of lower amount of net profit in year 2019 that
was of £580000 while in year 2018, its value was of £1945000. So in comparative manner,
company's performance is poor in year 2019.
Liquidity ratio- This is a type of ratio which is calculated in order to evaluate liquidity
position of companies in terms of paying short term debts (Nicolăescu, 2013). It consists
two types of ratios such as:
(I) Current ratio = Current assets / current liabilities
All data in £000 except
current ratio
2018 2019
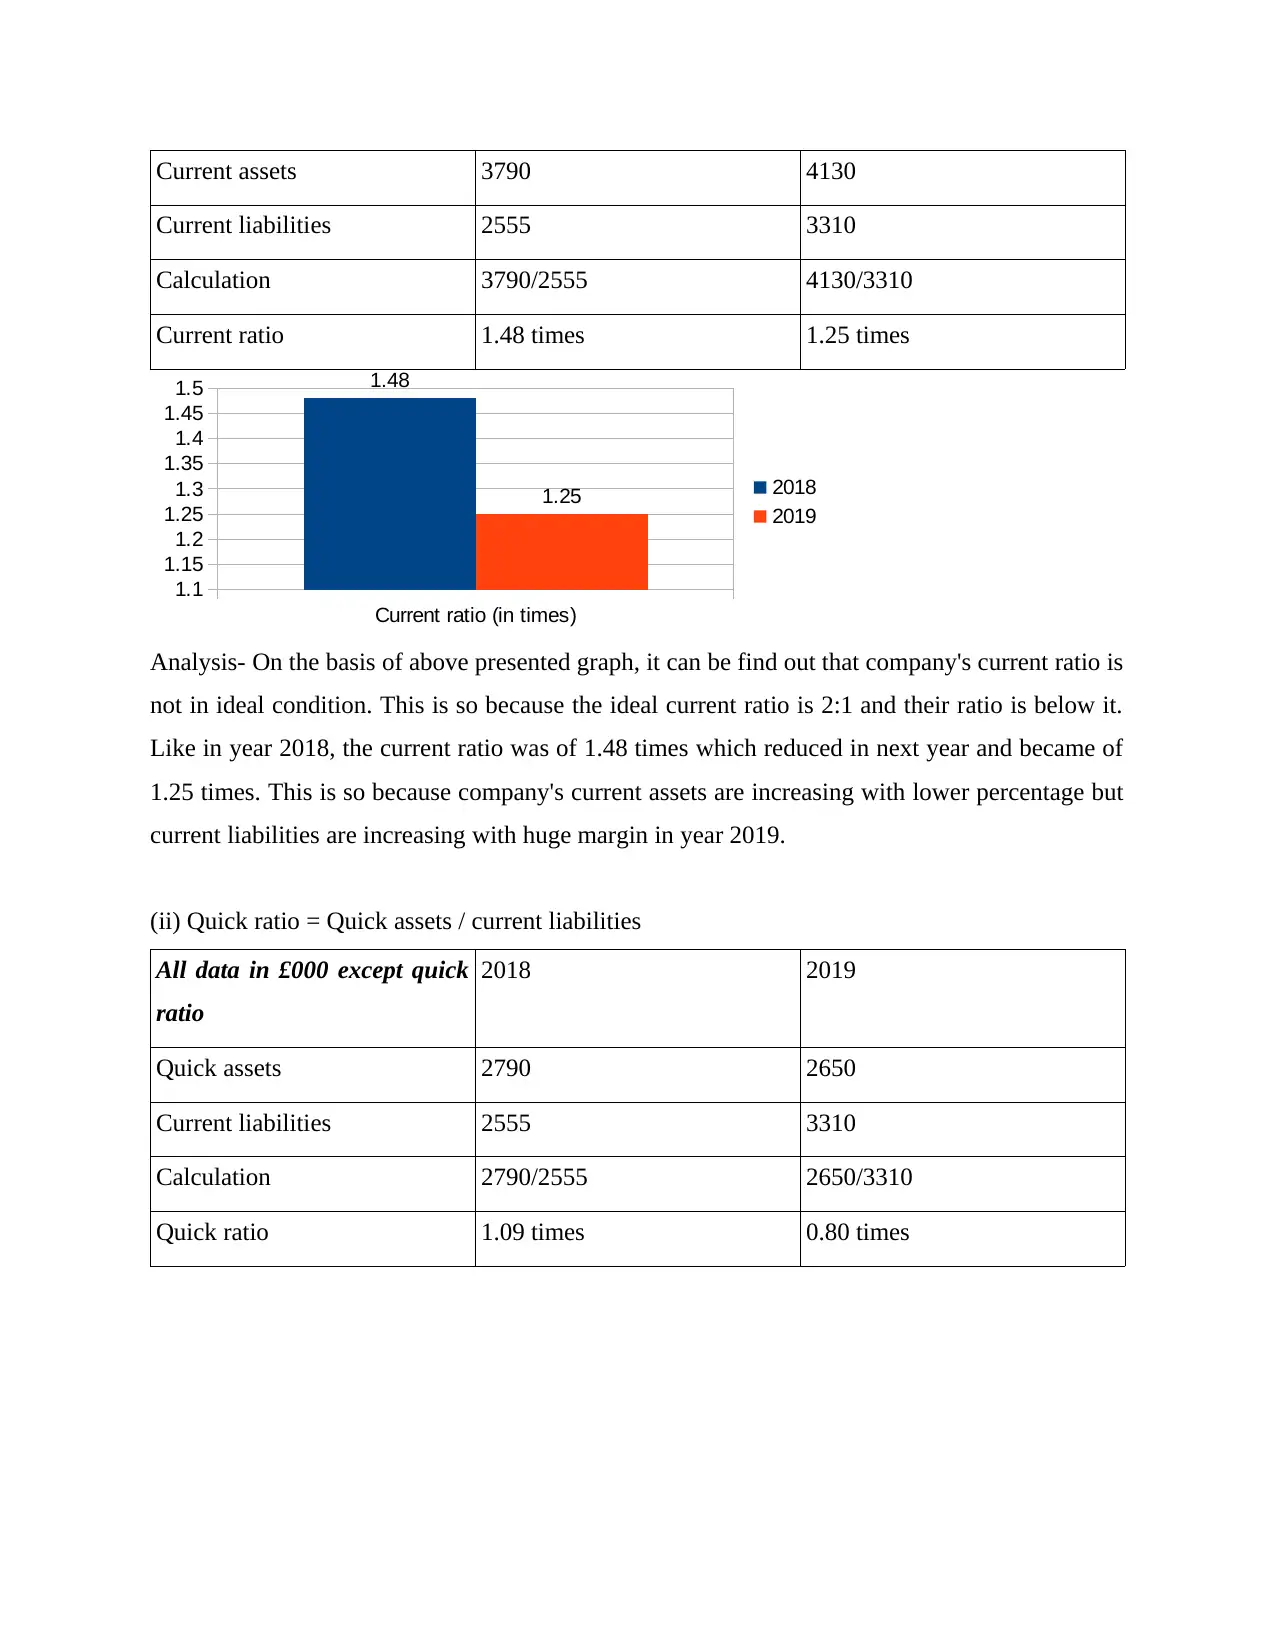
Current assets 3790 4130
Current liabilities 2555 3310
Calculation 3790/2555 4130/3310
Current ratio 1.48 times 1.25 times
Current ratio (in times)
1.1
1.15
1.2
1.25
1.3
1.35
1.4
1.45
1.5 1.48
1.25 2018
2019
Analysis- On the basis of above presented graph, it can be find out that company's current ratio is
not in ideal condition. This is so because the ideal current ratio is 2:1 and their ratio is below it.
Like in year 2018, the current ratio was of 1.48 times which reduced in next year and became of
1.25 times. This is so because company's current assets are increasing with lower percentage but
current liabilities are increasing with huge margin in year 2019.
(ii) Quick ratio = Quick assets / current liabilities
All data in £000 except quick
ratio
2018 2019
Quick assets 2790 2650
Current liabilities 2555 3310
Calculation 2790/2555 2650/3310
Quick ratio 1.09 times 0.80 times
Current liabilities 2555 3310
Calculation 3790/2555 4130/3310
Current ratio 1.48 times 1.25 times
Current ratio (in times)
1.1
1.15
1.2
1.25
1.3
1.35
1.4
1.45
1.5 1.48
1.25 2018
2019
Analysis- On the basis of above presented graph, it can be find out that company's current ratio is
not in ideal condition. This is so because the ideal current ratio is 2:1 and their ratio is below it.
Like in year 2018, the current ratio was of 1.48 times which reduced in next year and became of
1.25 times. This is so because company's current assets are increasing with lower percentage but
current liabilities are increasing with huge margin in year 2019.
(ii) Quick ratio = Quick assets / current liabilities
All data in £000 except quick
ratio
2018 2019
Quick assets 2790 2650
Current liabilities 2555 3310
Calculation 2790/2555 2650/3310
Quick ratio 1.09 times 0.80 times
⊘ This is a preview!⊘
Do you want full access?
Subscribe today to unlock all pages.
Trusted by 1+ million students worldwide
Quick ratio (in times)
0
0.2
0.4
0.6
0.8
1
1.2 1.09
0.8
2018
2019
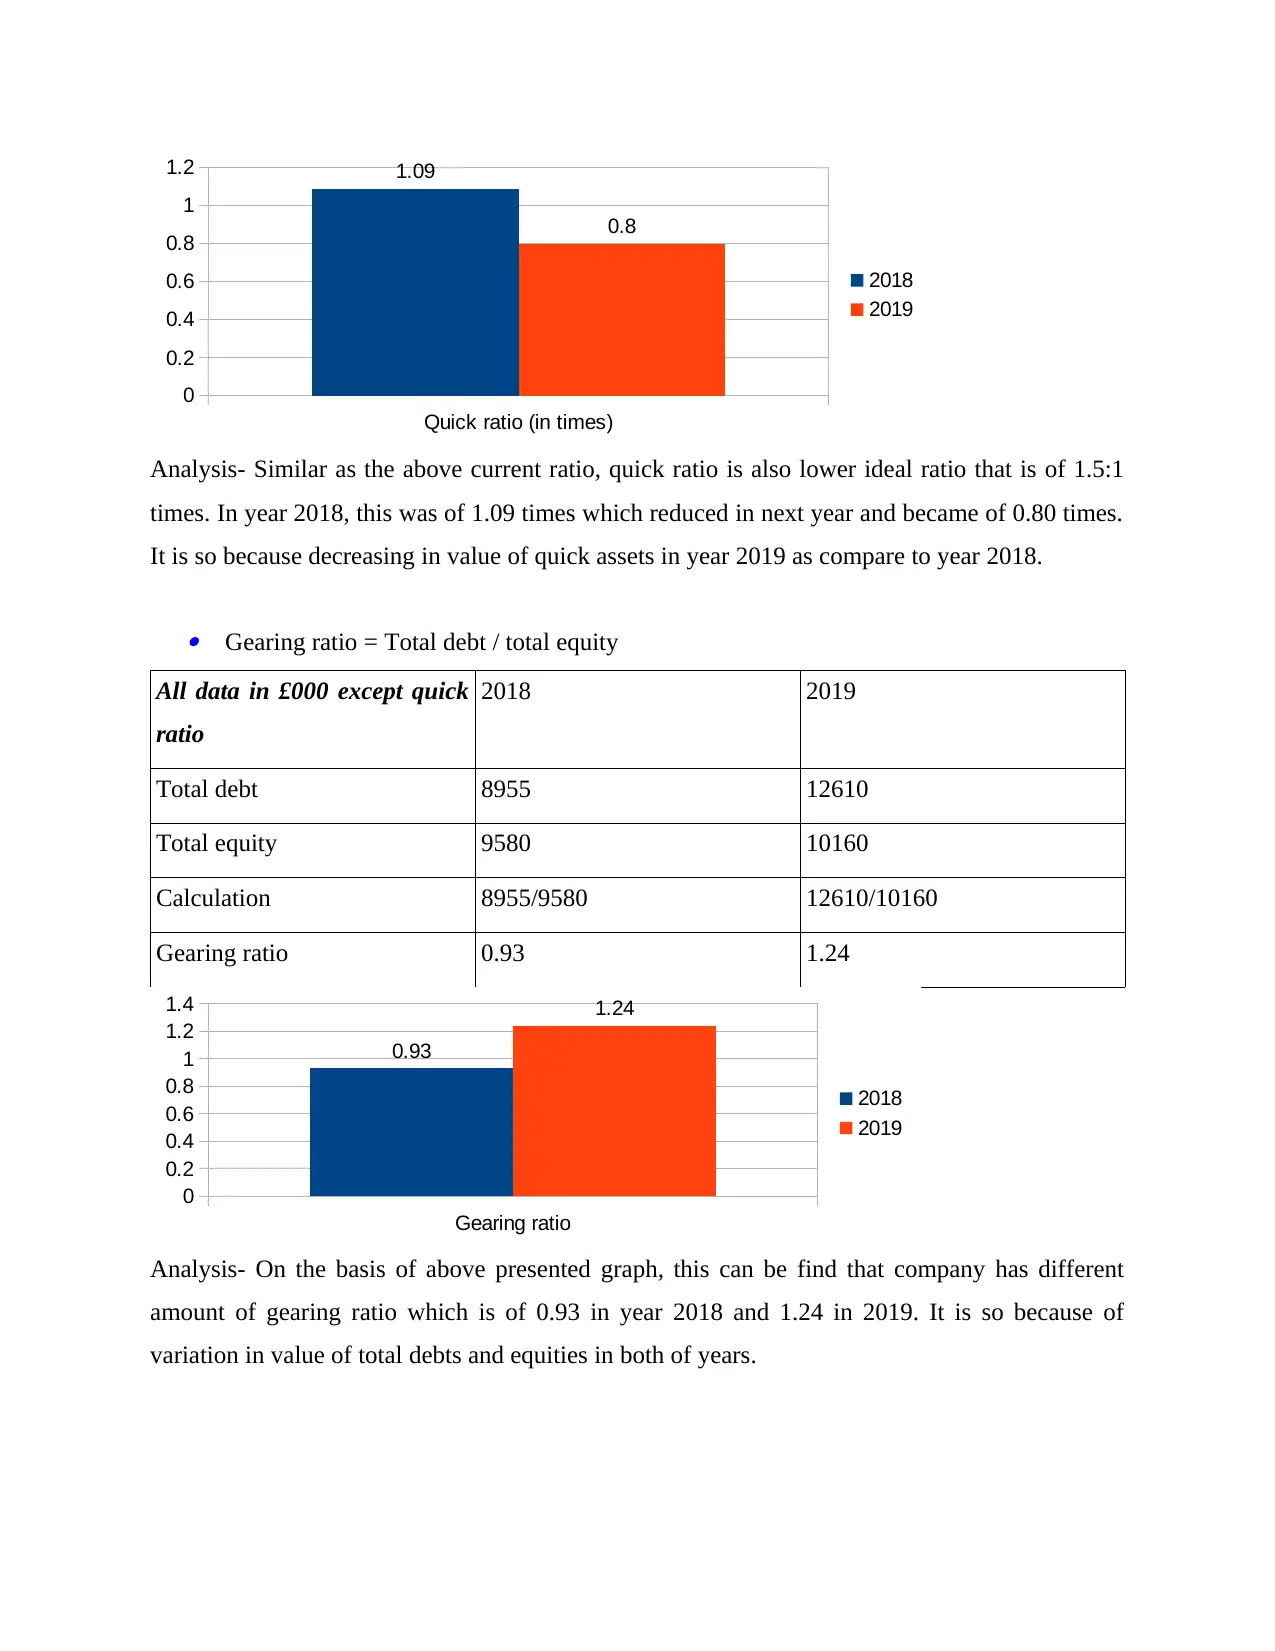
Analysis- Similar as the above current ratio, quick ratio is also lower ideal ratio that is of 1.5:1
times. In year 2018, this was of 1.09 times which reduced in next year and became of 0.80 times.
It is so because decreasing in value of quick assets in year 2019 as compare to year 2018.
Gearing ratio = Total debt / total equity
All data in £000 except quick
ratio
2018 2019
Total debt 8955 12610
Total equity 9580 10160
Calculation 8955/9580 12610/10160
Gearing ratio 0.93 1.24
Gearing ratio
0
0.2
0.4
0.6
0.8
1
1.2
1.4
0.93
1.24
2018
2019
Analysis- On the basis of above presented graph, this can be find that company has different
amount of gearing ratio which is of 0.93 in year 2018 and 1.24 in 2019. It is so because of
variation in value of total debts and equities in both of years.
0
0.2
0.4
0.6
0.8
1
1.2 1.09
0.8
2018
2019
Analysis- Similar as the above current ratio, quick ratio is also lower ideal ratio that is of 1.5:1
times. In year 2018, this was of 1.09 times which reduced in next year and became of 0.80 times.
It is so because decreasing in value of quick assets in year 2019 as compare to year 2018.
Gearing ratio = Total debt / total equity
All data in £000 except quick
ratio
2018 2019
Total debt 8955 12610
Total equity 9580 10160
Calculation 8955/9580 12610/10160
Gearing ratio 0.93 1.24
Gearing ratio
0
0.2
0.4
0.6
0.8
1
1.2
1.4
0.93
1.24
2018
2019
Analysis- On the basis of above presented graph, this can be find that company has different
amount of gearing ratio which is of 0.93 in year 2018 and 1.24 in 2019. It is so because of
variation in value of total debts and equities in both of years.
Paraphrase This Document
Need a fresh take? Get an instant paraphrase of this document with our AI Paraphraser
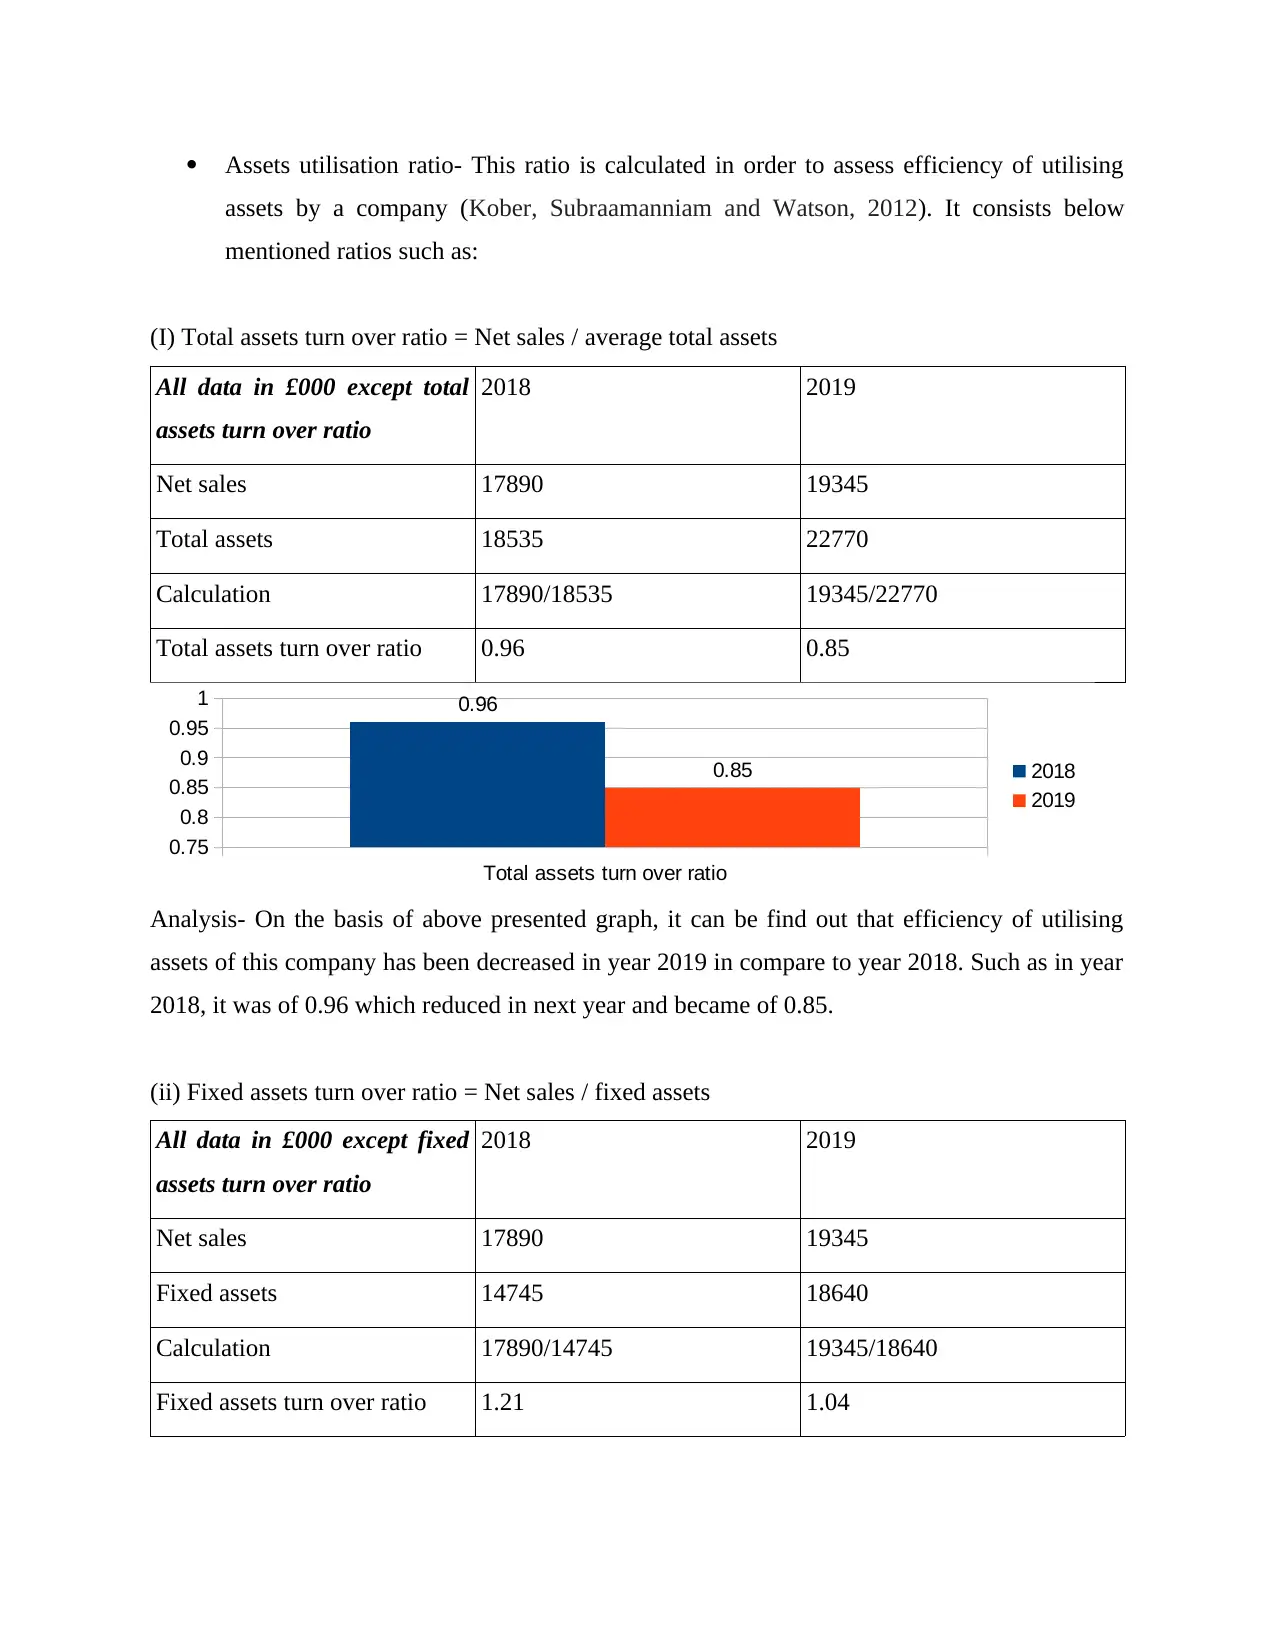
Assets utilisation ratio- This ratio is calculated in order to assess efficiency of utilising
assets by a company (Kober, Subraamanniam and Watson, 2012). It consists below
mentioned ratios such as:
(I) Total assets turn over ratio = Net sales / average total assets
All data in £000 except total
assets turn over ratio
2018 2019
Net sales 17890 19345
Total assets 18535 22770
Calculation 17890/18535 19345/22770
Total assets turn over ratio 0.96 0.85
Total assets turn over ratio
0.75
0.8
0.85
0.9
0.95
1 0.96
0.85 2018
2019
Analysis- On the basis of above presented graph, it can be find out that efficiency of utilising
assets of this company has been decreased in year 2019 in compare to year 2018. Such as in year
2018, it was of 0.96 which reduced in next year and became of 0.85.
(ii) Fixed assets turn over ratio = Net sales / fixed assets
All data in £000 except fixed
assets turn over ratio
2018 2019
Net sales 17890 19345
Fixed assets 14745 18640
Calculation 17890/14745 19345/18640
Fixed assets turn over ratio 1.21 1.04
Fixed assets turn over ratio
0.95
1
1.05
1.1
1.15
1.2
1.25 1.21
1.04 2018
2019
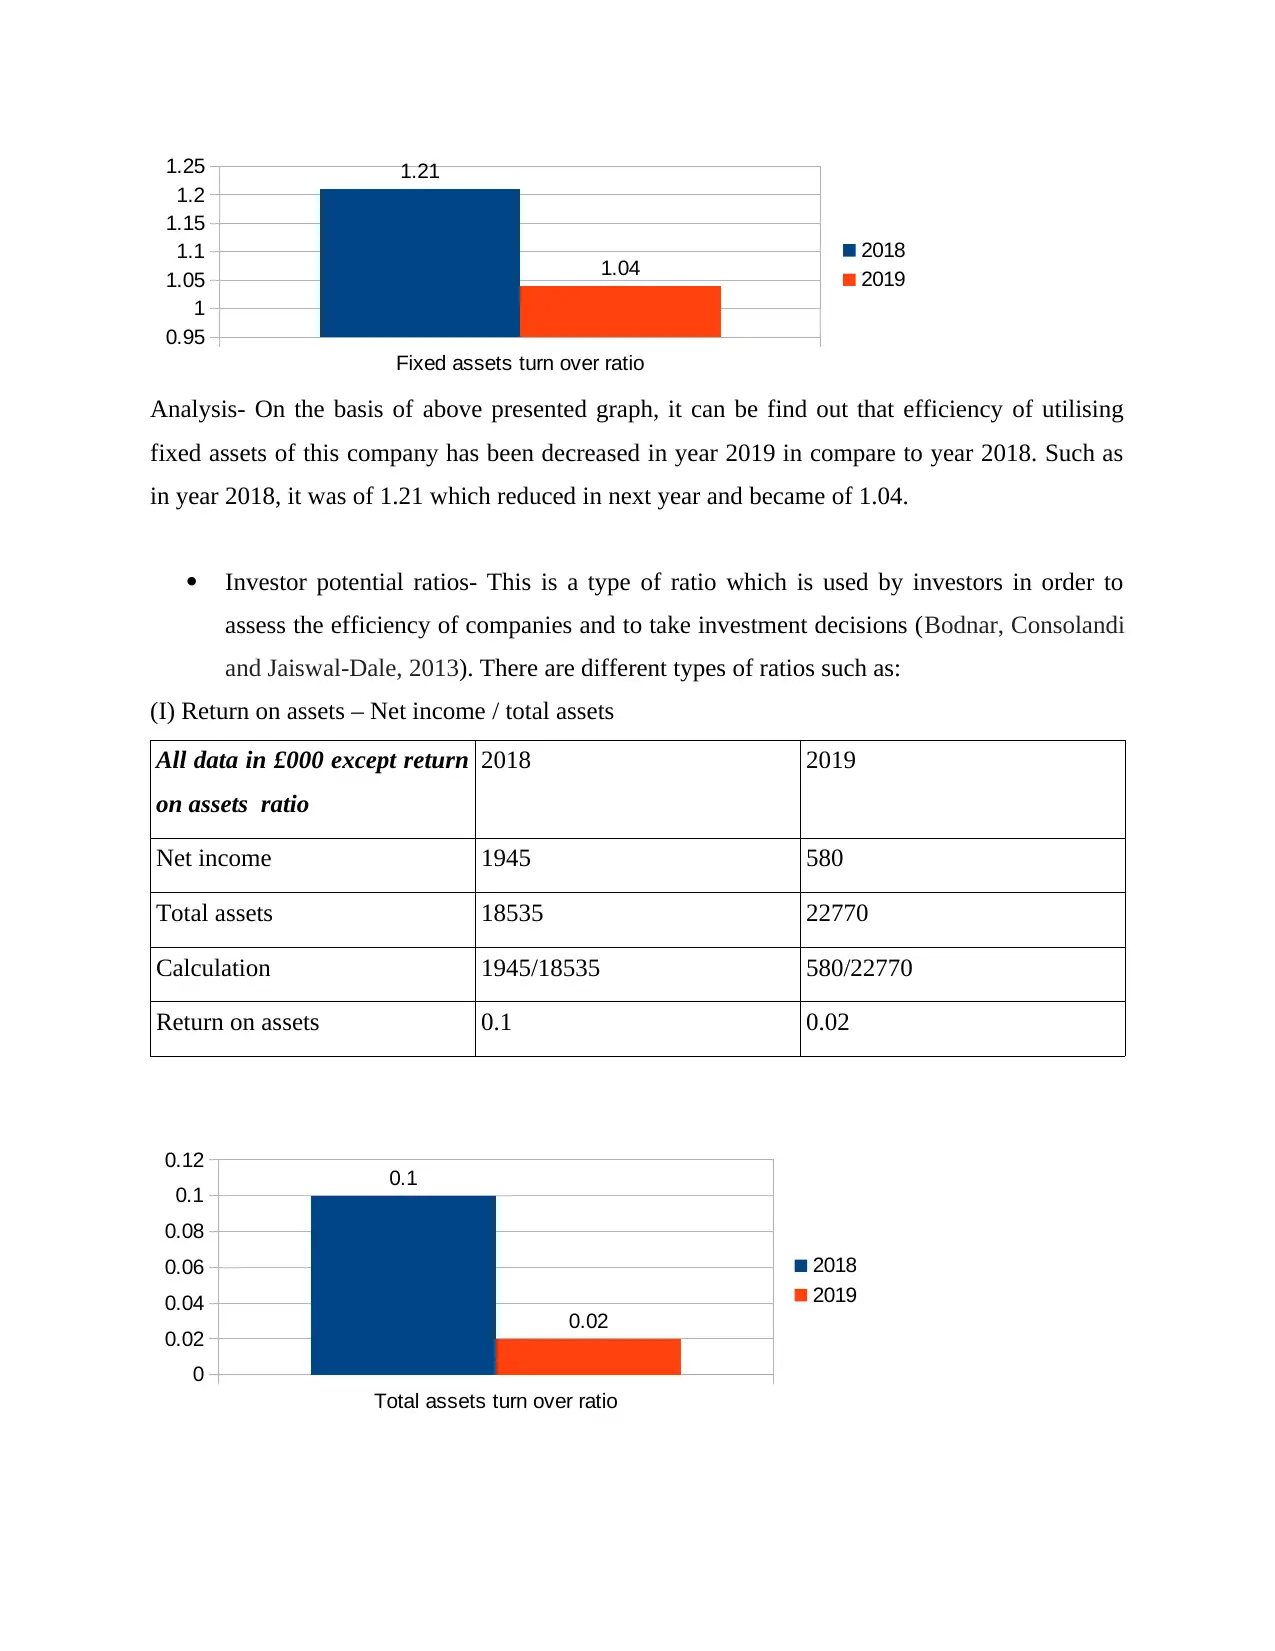
Analysis- On the basis of above presented graph, it can be find out that efficiency of utilising
fixed assets of this company has been decreased in year 2019 in compare to year 2018. Such as
in year 2018, it was of 1.21 which reduced in next year and became of 1.04.
Investor potential ratios- This is a type of ratio which is used by investors in order to
assess the efficiency of companies and to take investment decisions (Bodnar, Consolandi
and Jaiswal‐Dale, 2013). There are different types of ratios such as:
(I) Return on assets – Net income / total assets
All data in £000 except return
on assets ratio
2018 2019
Net income 1945 580
Total assets 18535 22770
Calculation 1945/18535 580/22770
Return on assets 0.1 0.02
Total assets turn over ratio
0
0.02
0.04
0.06
0.08
0.1
0.12 0.1
0.02
2018
2019
0.95
1
1.05
1.1
1.15
1.2
1.25 1.21
1.04 2018
2019
Analysis- On the basis of above presented graph, it can be find out that efficiency of utilising
fixed assets of this company has been decreased in year 2019 in compare to year 2018. Such as
in year 2018, it was of 1.21 which reduced in next year and became of 1.04.
Investor potential ratios- This is a type of ratio which is used by investors in order to
assess the efficiency of companies and to take investment decisions (Bodnar, Consolandi
and Jaiswal‐Dale, 2013). There are different types of ratios such as:
(I) Return on assets – Net income / total assets
All data in £000 except return
on assets ratio
2018 2019
Net income 1945 580
Total assets 18535 22770
Calculation 1945/18535 580/22770
Return on assets 0.1 0.02
Total assets turn over ratio
0
0.02
0.04
0.06
0.08
0.1
0.12 0.1
0.02
2018
2019
⊘ This is a preview!⊘
Do you want full access?
Subscribe today to unlock all pages.
Trusted by 1+ million students worldwide
Analysis- On the basis of above presented graph, this can be find out that efficiency of this
company in order to generate return has been reduced in year 2019. Though, in both of years
company failed to gain higher return. Such as in year 2018, it was of 0.1 which decreased in next
year till 0.02.
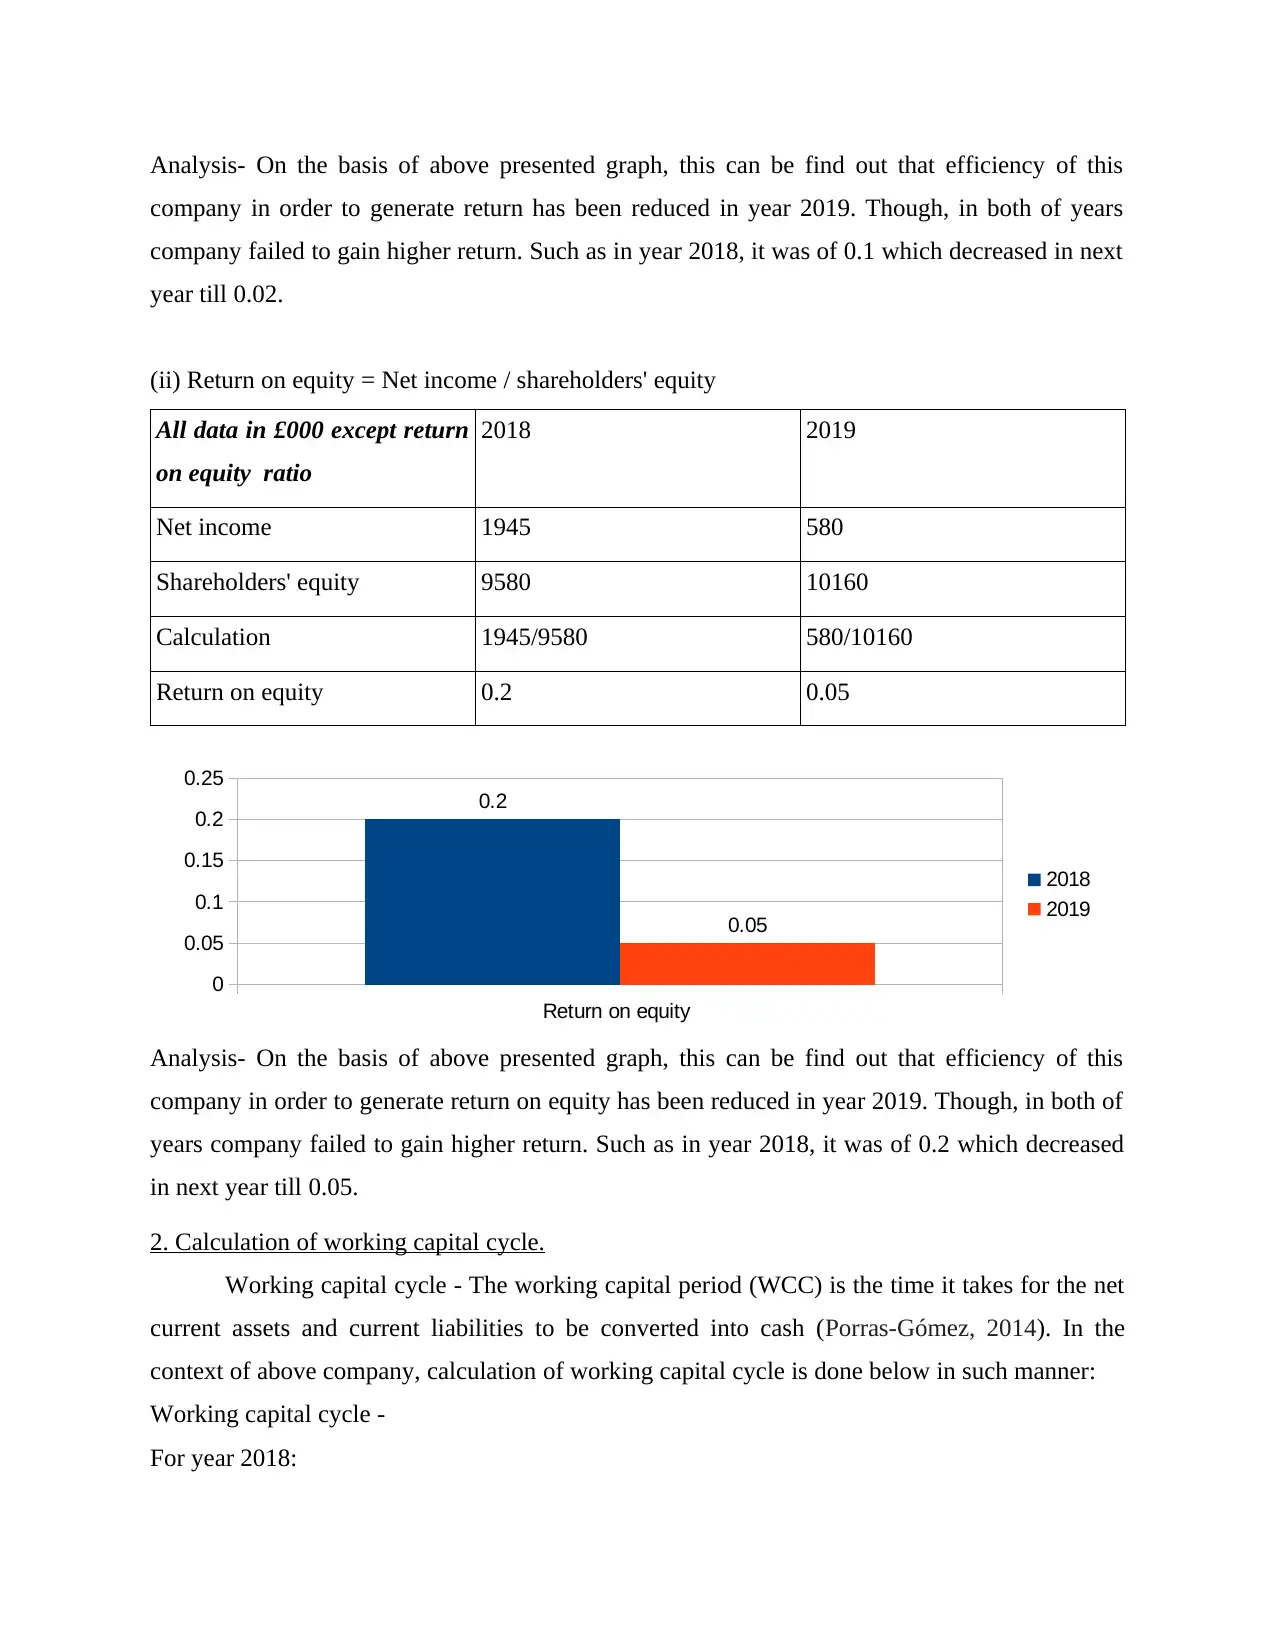
(ii) Return on equity = Net income / shareholders' equity
All data in £000 except return
on equity ratio
2018 2019
Net income 1945 580
Shareholders' equity 9580 10160
Calculation 1945/9580 580/10160
Return on equity 0.2 0.05
Analysis- On the basis of above presented graph, this can be find out that efficiency of this
company in order to generate return on equity has been reduced in year 2019. Though, in both of
years company failed to gain higher return. Such as in year 2018, it was of 0.2 which decreased
in next year till 0.05.
2. Calculation of working capital cycle.
Working capital cycle - The working capital period (WCC) is the time it takes for the net
current assets and current liabilities to be converted into cash (Porras-Gómez, 2014). In the
context of above company, calculation of working capital cycle is done below in such manner:
Working capital cycle -
For year 2018:
Return on equity
0
0.05
0.1
0.15
0.2
0.25
0.2
0.05
2018
2019
company in order to generate return has been reduced in year 2019. Though, in both of years
company failed to gain higher return. Such as in year 2018, it was of 0.1 which decreased in next
year till 0.02.
(ii) Return on equity = Net income / shareholders' equity
All data in £000 except return
on equity ratio
2018 2019
Net income 1945 580
Shareholders' equity 9580 10160
Calculation 1945/9580 580/10160
Return on equity 0.2 0.05
Analysis- On the basis of above presented graph, this can be find out that efficiency of this
company in order to generate return on equity has been reduced in year 2019. Though, in both of
years company failed to gain higher return. Such as in year 2018, it was of 0.2 which decreased
in next year till 0.05.
2. Calculation of working capital cycle.
Working capital cycle - The working capital period (WCC) is the time it takes for the net
current assets and current liabilities to be converted into cash (Porras-Gómez, 2014). In the
context of above company, calculation of working capital cycle is done below in such manner:
Working capital cycle -
For year 2018:
Return on equity
0
0.05
0.1
0.15
0.2
0.25
0.2
0.05
2018
2019
Paraphrase This Document
Need a fresh take? Get an instant paraphrase of this document with our AI Paraphraser
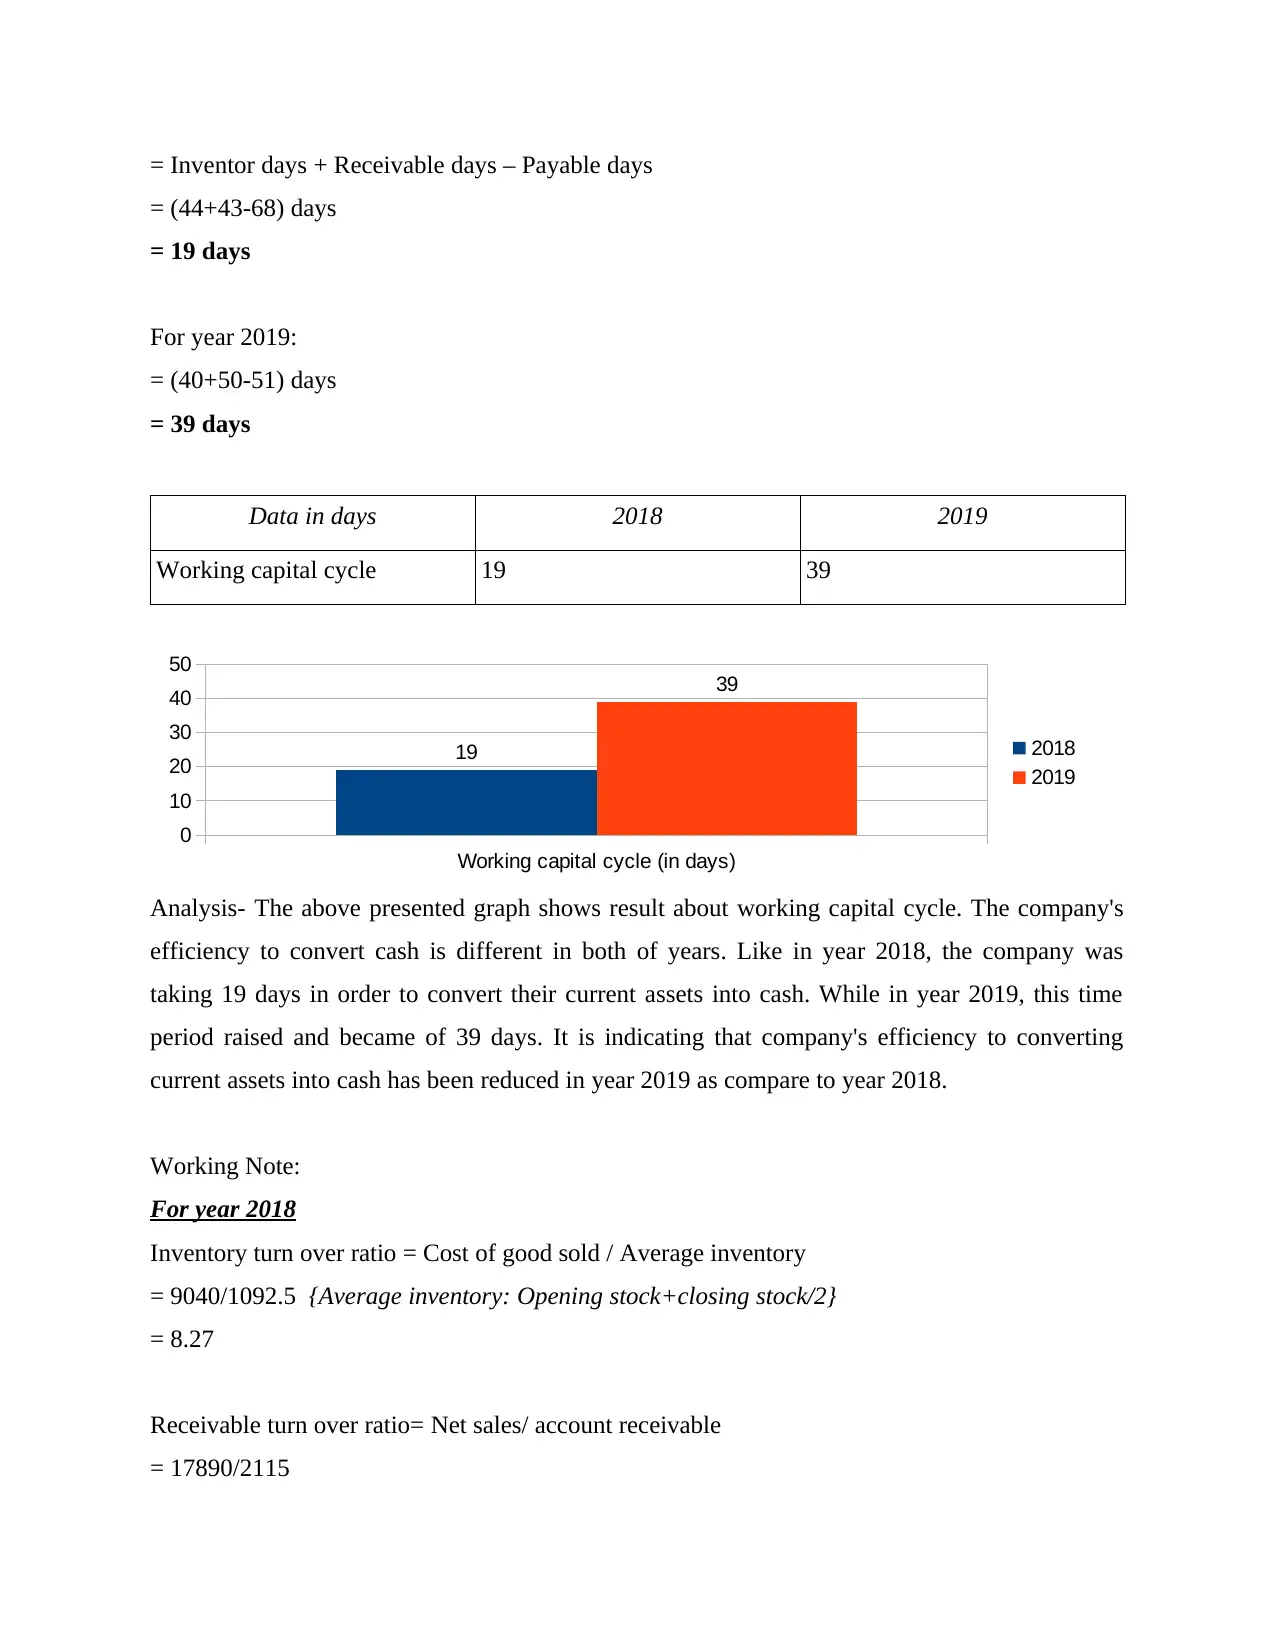
= Inventor days + Receivable days – Payable days
= (44+43-68) days
= 19 days
For year 2019:
= (40+50-51) days
= 39 days
Data in days 2018 2019
Working capital cycle 19 39
Working capital cycle (in days)
0
10
20
30
40
50
19
39
2018
2019
Analysis- The above presented graph shows result about working capital cycle. The company's
efficiency to convert cash is different in both of years. Like in year 2018, the company was
taking 19 days in order to convert their current assets into cash. While in year 2019, this time
period raised and became of 39 days. It is indicating that company's efficiency to converting
current assets into cash has been reduced in year 2019 as compare to year 2018.
Working Note:
For year 2018
Inventory turn over ratio = Cost of good sold / Average inventory
= 9040/1092.5 {Average inventory: Opening stock+closing stock/2}
= 8.27
Receivable turn over ratio= Net sales/ account receivable
= 17890/2115
= 8.45
Payable turn over ratio = Total purchase/ accounts payables
= 8855/ 1655 {total purchase: cost of goods sold+closing stock-opening stock}
= 5.35
Inventory days = 365 days / Inventory turn over ratio
= 365 / 8.27
= 44.13 or 44 days
Receivable days = 365 days / receivable turn over ratio
= 365/8.45
= 43.19 or 43 days
Payable days = 365 days/ payable turn over ratio
= 365/5.35
= 68.22 or 68 days
For year 2019
Inventory turn over ratio = Cost of good sold / Average inventory
= 11340/1240 {Average inventory: Opening stock+closing stock/2}
= 9.14
Receivable turn over ratio= Net sales/ account receivable
= 19345/2650
= 7.3
Payable turn over ratio = Total purchase/ accounts payables
= 11820/ 1655 {total purchase: cost of goods sold+closing stock-opening stock}
= 7.14
Inventory days = 365 days / Inventory turn over ratio
= 365 / 9.14
Payable turn over ratio = Total purchase/ accounts payables
= 8855/ 1655 {total purchase: cost of goods sold+closing stock-opening stock}
= 5.35
Inventory days = 365 days / Inventory turn over ratio
= 365 / 8.27
= 44.13 or 44 days
Receivable days = 365 days / receivable turn over ratio
= 365/8.45
= 43.19 or 43 days
Payable days = 365 days/ payable turn over ratio
= 365/5.35
= 68.22 or 68 days
For year 2019
Inventory turn over ratio = Cost of good sold / Average inventory
= 11340/1240 {Average inventory: Opening stock+closing stock/2}
= 9.14
Receivable turn over ratio= Net sales/ account receivable
= 19345/2650
= 7.3
Payable turn over ratio = Total purchase/ accounts payables
= 11820/ 1655 {total purchase: cost of goods sold+closing stock-opening stock}
= 7.14
Inventory days = 365 days / Inventory turn over ratio
= 365 / 9.14
⊘ This is a preview!⊘
Do you want full access?
Subscribe today to unlock all pages.
Trusted by 1+ million students worldwide
1 out of 21
Related Documents


Your All-in-One AI-Powered Toolkit for Academic Success.
+13062052269
info@desklib.com
Available 24*7 on WhatsApp / Email
![[object Object]](/_next/static/media/star-bottom.7253800d.svg)
Unlock your academic potential
Copyright © 2020–2026 A2Z Services. All Rights Reserved. Developed and managed by ZUCOL.