Financial Management Report: Portfolio, CAPM, and SML Evaluation
VerifiedAdded on 2023/06/05
|15
|2903
|68
Report
AI Summary
This report delves into the core principles of financial management, focusing on portfolio management, capital market theory, and security market analysis. It begins by differentiating between the Capital Market Line (CML) and the Security Market Line (SML) through graphical illustrations, emphasizing the efficient frontier and the relationship between risk and return. The report then highlights the significance of minimum variance portfolios in optimizing investment strategies and minimizing risk. Finally, it evaluates the Capital Asset Pricing Model (CAPM) equation, demonstrating how investors can assess expected returns and make informed investment decisions. The report also explores the assumptions underlying CAPM and offers a comprehensive understanding of investment strategies and market dynamics.

Running head: FINANCIAL MANAGEMENT
Financial Management
Name of the Student:
Name of the University:
Author’s Note:
Financial Management
Name of the Student:
Name of the University:
Author’s Note:
Paraphrase This Document
Need a fresh take? Get an instant paraphrase of this document with our AI Paraphraser

1FINANCIAL MANAGEMENT
Table of Contents
Introduction:....................................................................................................................................2
Differences between capital market line (CML) and security market line (SML) with the help of
graphical illustration:.......................................................................................................................2
Importance of minimum variance portfolios:..................................................................................8
Evaluation of CAPM equation:.....................................................................................................10
Conclusion:....................................................................................................................................11
References:....................................................................................................................................12
2FINANCIAL MANAGEMENT
Introduction:
. The report is prepared for demonstrating different aspect of the corporate financial
management with particular emphasis on portfolio management, capital market theory and
security market analysis. The objective studying investment management and portfolio analysis
is to gain an understanding in the field of investment for understanding the concept of sound
investment decision making. Investors relies on the concept of capital market line, capital asset
pricing model, minimum variance portfolios and security market line to have an understanding of
the portfolios of stocks and making feasible investment. In the first section, the graphical
illustrations of the difference between security market and capital market line has been
demonstrated. The second part of report emphasises on the importance of minimum variance
portfolios that helps in explaining the relationship between risk and return. The last section of
report deals with the evaluation of the equation of Capital asset pricing model (CAPM) that helps
investors in finding the optimum portfolio.
Differences between capital market line (CML) and security market line (SML) with the
help of graphical illustration:
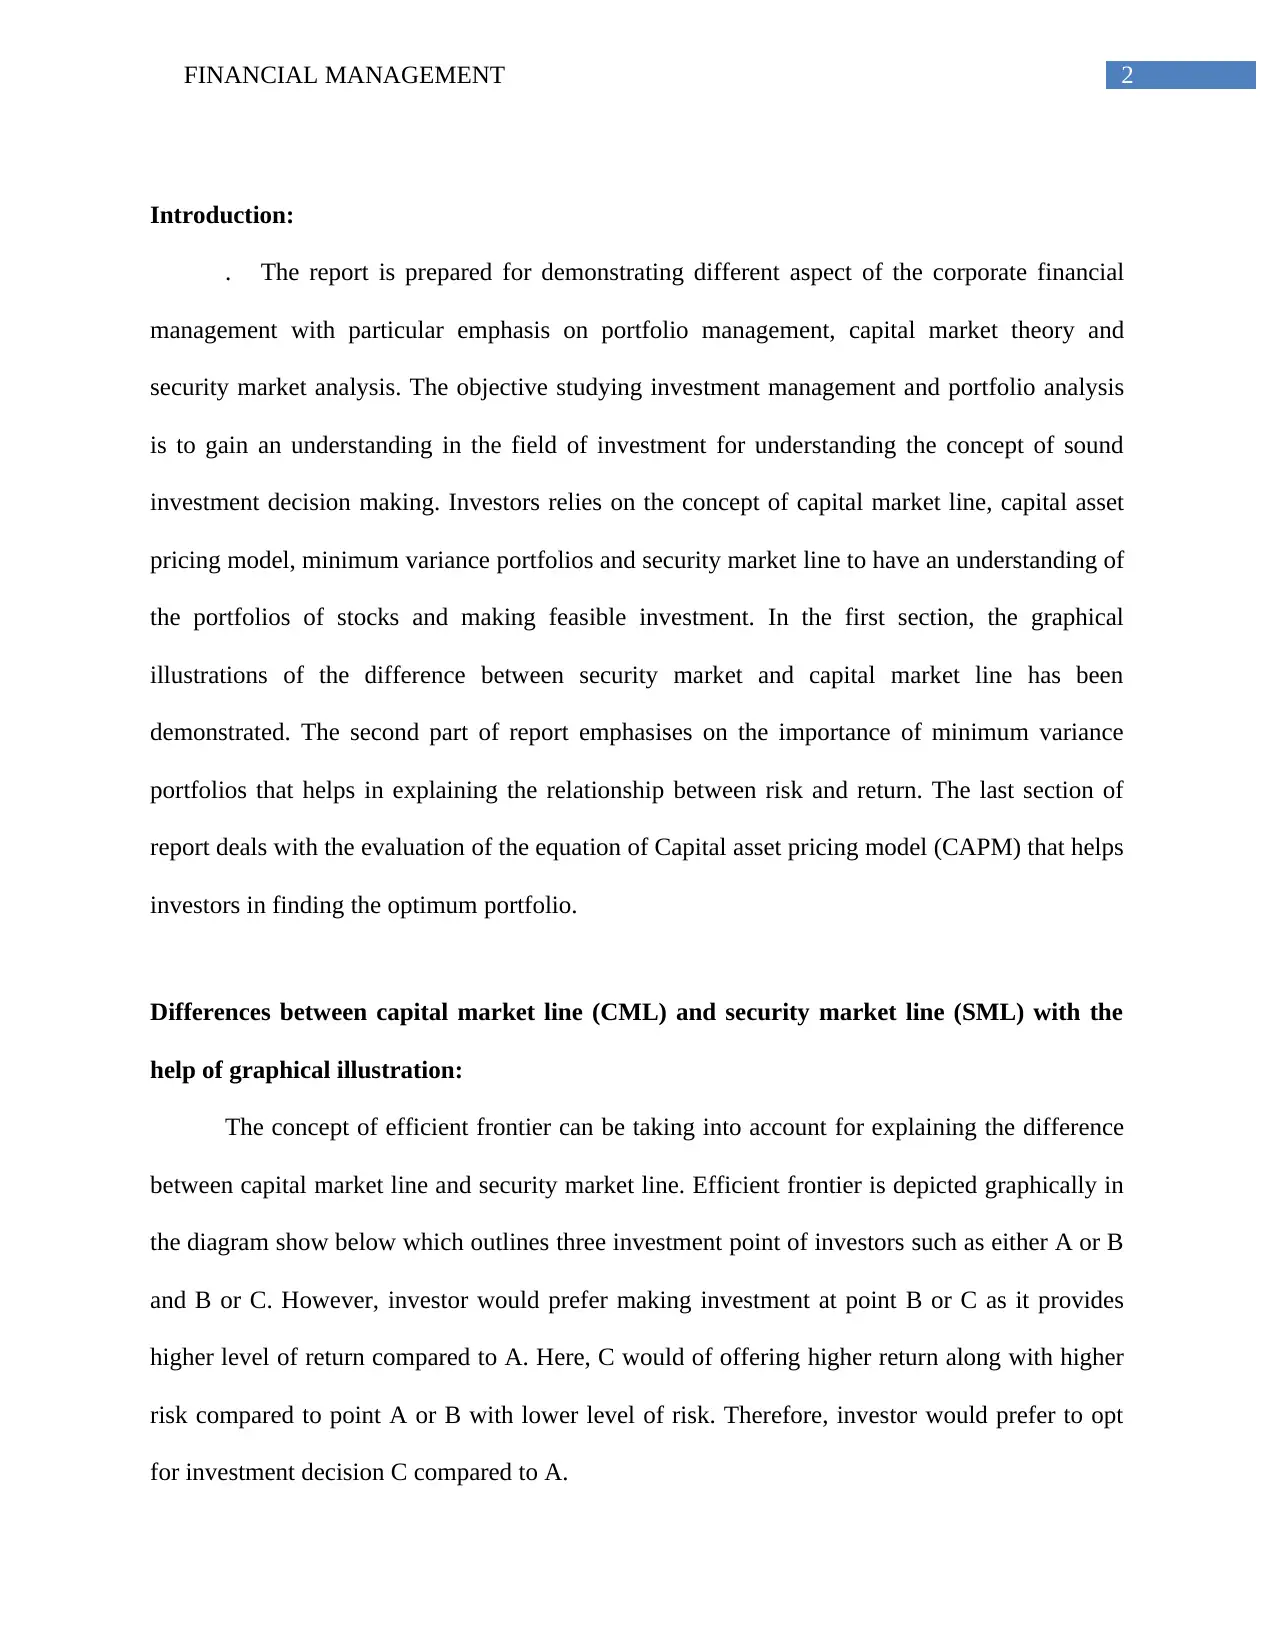
The concept of efficient frontier can be taking into account for explaining the difference
between capital market line and security market line. Efficient frontier is depicted graphically in
the diagram show below which outlines three investment point of investors such as either A or B
and B or C. However, investor would prefer making investment at point B or C as it provides
higher level of return compared to A. Here, C would of offering higher return along with higher
risk compared to point A or B with lower level of risk. Therefore, investor would prefer to opt
for investment decision C compared to A.
Introduction:
. The report is prepared for demonstrating different aspect of the corporate financial
management with particular emphasis on portfolio management, capital market theory and
security market analysis. The objective studying investment management and portfolio analysis
is to gain an understanding in the field of investment for understanding the concept of sound
investment decision making. Investors relies on the concept of capital market line, capital asset
pricing model, minimum variance portfolios and security market line to have an understanding of
the portfolios of stocks and making feasible investment. In the first section, the graphical
illustrations of the difference between security market and capital market line has been
demonstrated. The second part of report emphasises on the importance of minimum variance
portfolios that helps in explaining the relationship between risk and return. The last section of
report deals with the evaluation of the equation of Capital asset pricing model (CAPM) that helps
investors in finding the optimum portfolio.
Differences between capital market line (CML) and security market line (SML) with the
help of graphical illustration:
The concept of efficient frontier can be taking into account for explaining the difference
between capital market line and security market line. Efficient frontier is depicted graphically in
the diagram show below which outlines three investment point of investors such as either A or B
and B or C. However, investor would prefer making investment at point B or C as it provides
higher level of return compared to A. Here, C would of offering higher return along with higher
risk compared to point A or B with lower level of risk. Therefore, investor would prefer to opt
for investment decision C compared to A.
⊘ This is a preview!⊘
Do you want full access?
Subscribe today to unlock all pages.
Trusted by 1+ million students worldwide
3FINANCIAL MANAGEMENT
Graph 1: Efficient frontier curve
(Source: Christensen et al. 2016)
Graph 2: Graph depicting Capital market line
(Source: Yang et al. 2015)
Graph 1: Efficient frontier curve
(Source: Christensen et al. 2016)
Graph 2: Graph depicting Capital market line
(Source: Yang et al. 2015)
Paraphrase This Document
Need a fresh take? Get an instant paraphrase of this document with our AI Paraphraser
4FINANCIAL MANAGEMENT
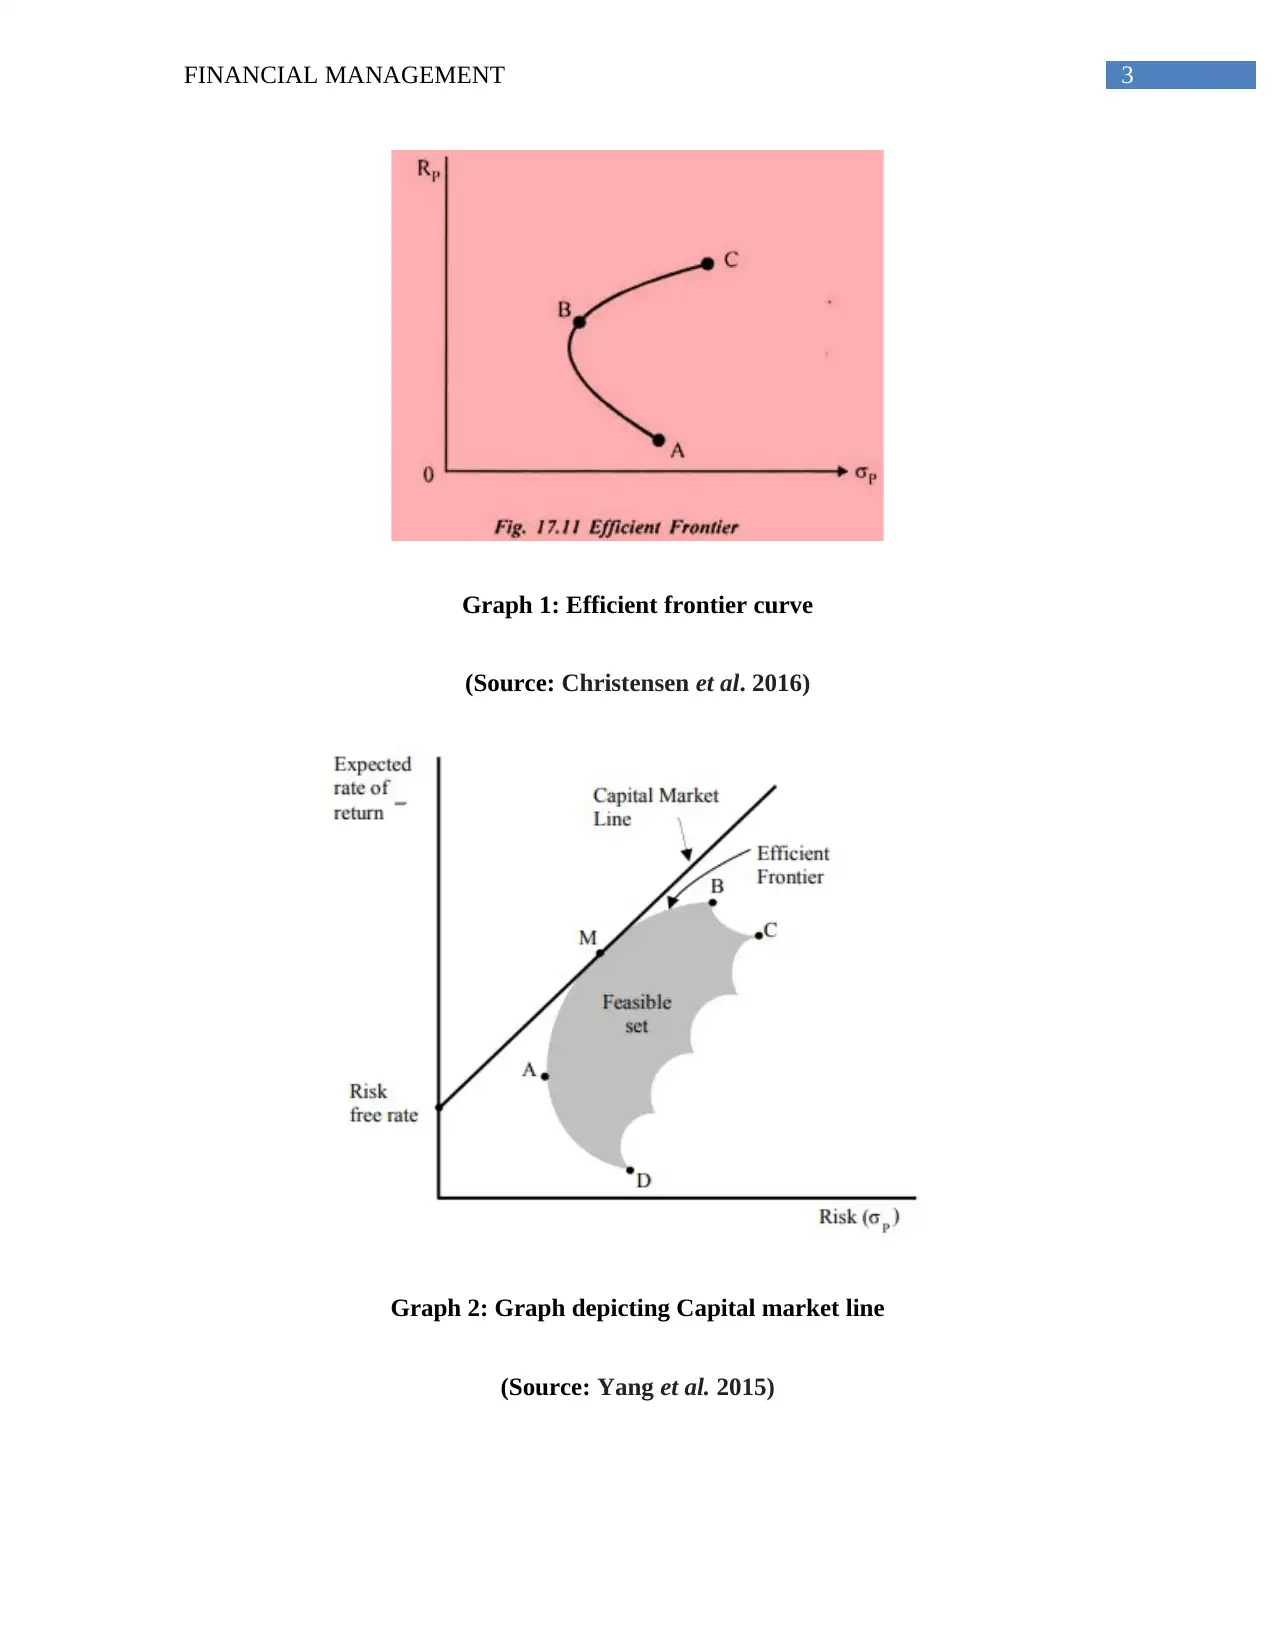
The above graph presents the efficient and feasible set of portfolios and the optimal set of
investment portfolio would be the one lying between A and B on the assumption of risk aversion
and non satiation. All the portfolios within the feasible set are not the optimal investment made
by investors. The optimum portfolio is prepared by the combination of risk free and risky stocks.
The efficient frontier becomes a tangent line if the risk free assets is introduced into the whole
set of assets. That particular line containing the combination of risky and risk free assets is
known as capital market line which is indicated by point M. Such line depicts a linear
relationship between the efficient portfolios combination with their standard deviation and
required rate of return. The risk price is represented by the portfolio on capital market line in the
form of slope and the return that is in excess of risk free rate (Becker et al. 2015). Such return
generated by portfolio would be in the proportion of standard deviation of portfolio which is
generated by market.
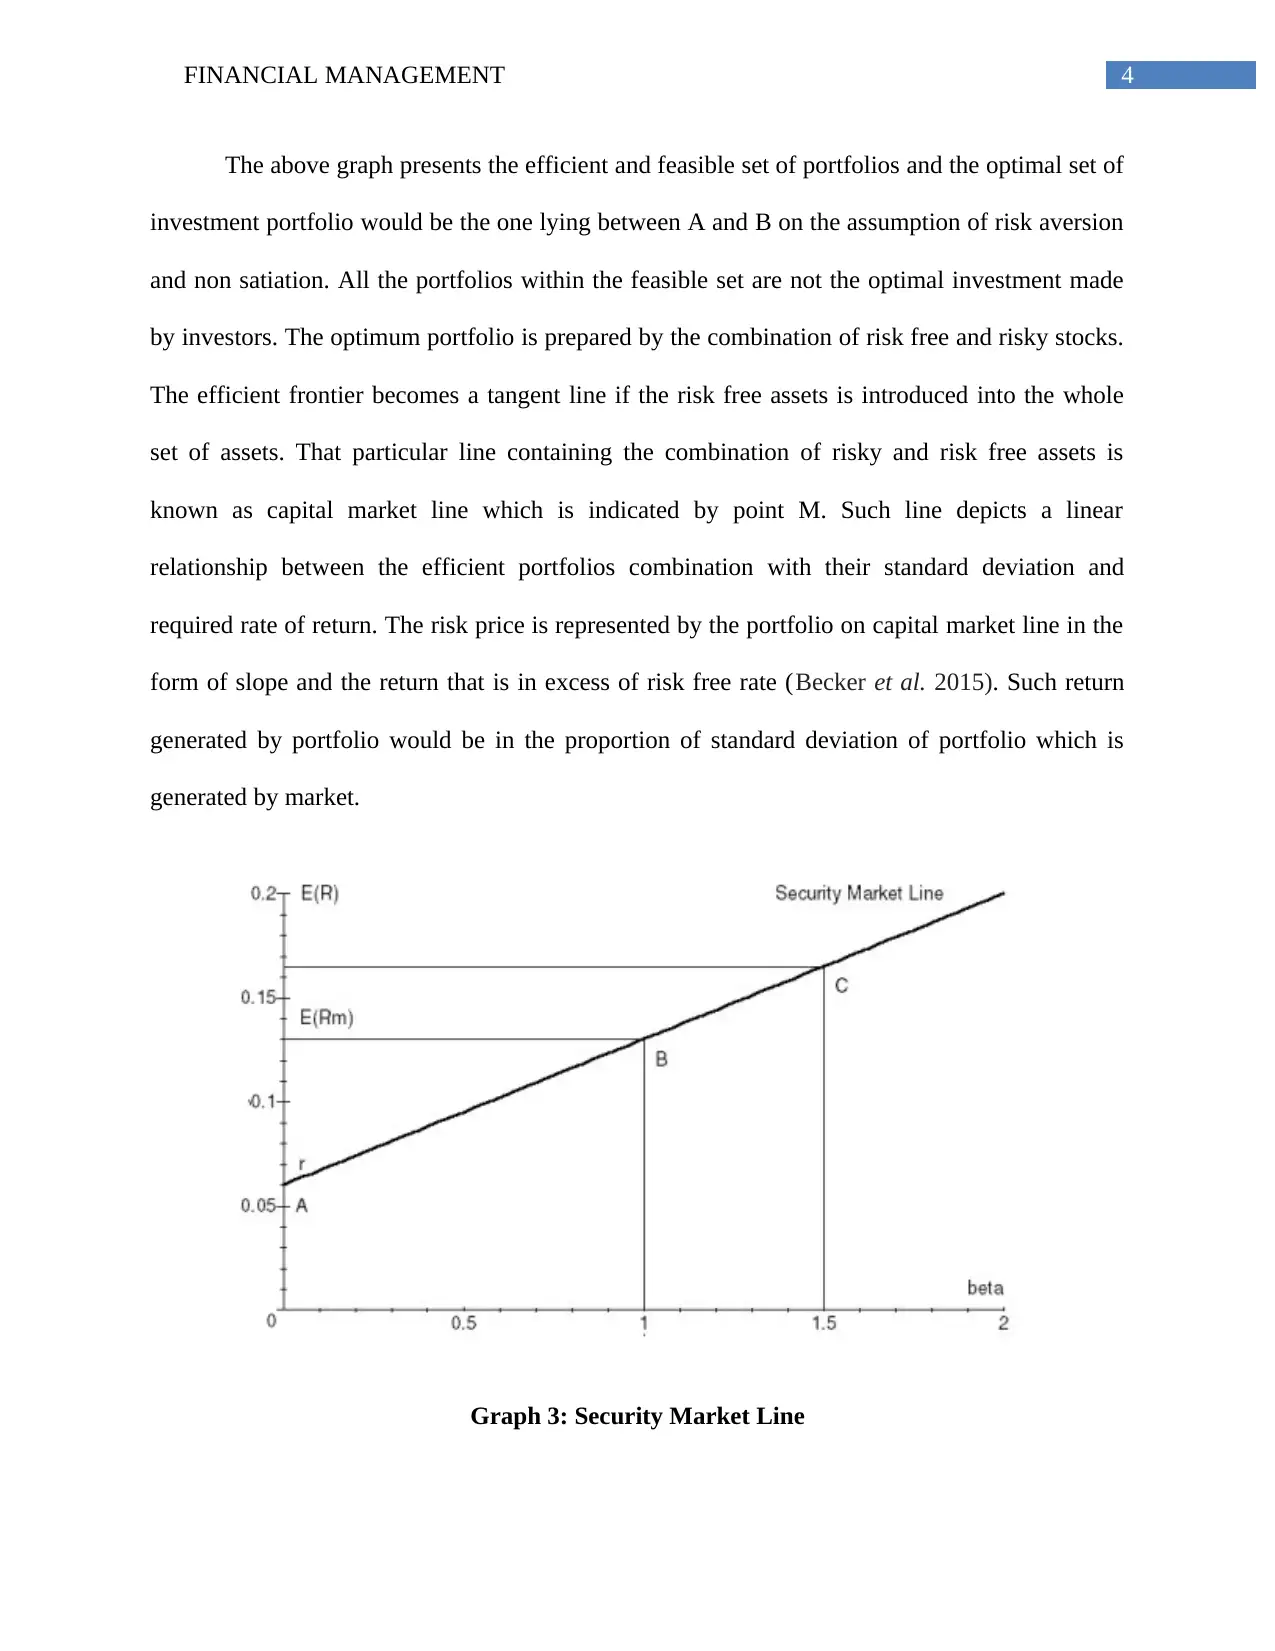
Graph 3: Security Market Line
The above graph presents the efficient and feasible set of portfolios and the optimal set of
investment portfolio would be the one lying between A and B on the assumption of risk aversion
and non satiation. All the portfolios within the feasible set are not the optimal investment made
by investors. The optimum portfolio is prepared by the combination of risk free and risky stocks.
The efficient frontier becomes a tangent line if the risk free assets is introduced into the whole
set of assets. That particular line containing the combination of risky and risk free assets is
known as capital market line which is indicated by point M. Such line depicts a linear
relationship between the efficient portfolios combination with their standard deviation and
required rate of return. The risk price is represented by the portfolio on capital market line in the
form of slope and the return that is in excess of risk free rate (Becker et al. 2015). Such return
generated by portfolio would be in the proportion of standard deviation of portfolio which is
generated by market.
Graph 3: Security Market Line
5FINANCIAL MANAGEMENT
(Source: Bodnar et al. 2018)
It has been found that the capital market line does not represent the risk associated with
the inefficient portfolio and there is failure on its part to make the identification of relationship
between risk and return. The characteristic of risk and return of various securities is represented
by Security market line by making the assumption of having liner relationship between return
and risk. There is gauging of individual securities on part of security market line irrespective of
whether the portfolios are efficient or not. Furthermore, the expected return on the security is
ascertained by such line which is provided by value beta. Such value helps in capturing the
overall systematic risk associated with the given security. However, there is possibility to make
the diversification of unsystematic risks associated with the security whereas the systematic risks
represented by value of beta cannot be diversified. The specific security market line helps in
providing description of each security risk and the difference in securities are attributed to
difference in value of their beta that is a reflection of different level of market risk.
⊘ This is a preview!⊘
Do you want full access?
Subscribe today to unlock all pages.
Trusted by 1+ million students worldwide
6FINANCIAL MANAGEMENT
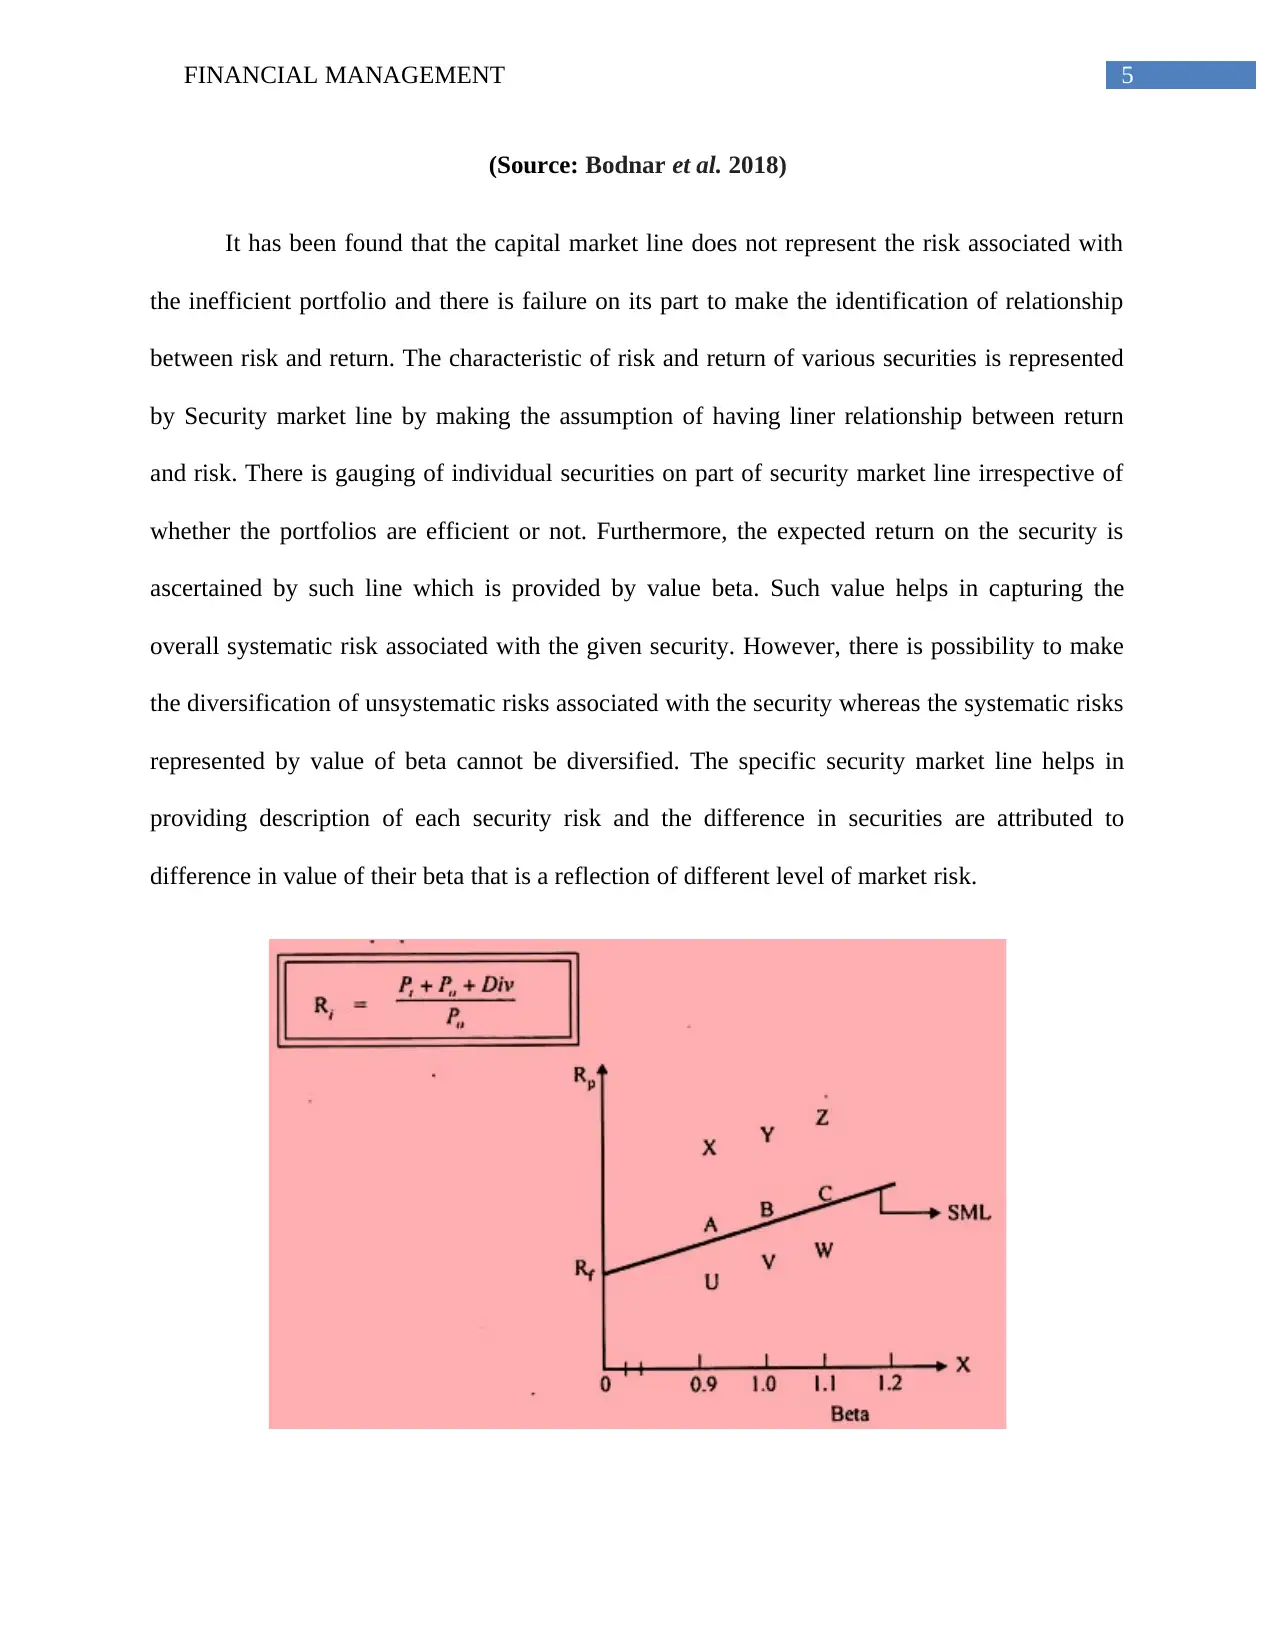
Graph 4: Evaluation of stock using SML
(Source: Kim and Kim 2016)
The overpricing and underpricing of stocks can be evaluated with the help of application
of security market line. Buying the under prices stocks is the efficient decision made by investors
and they intend to make investment in such stocks. The under priced securities are those which
are above the line SML and therefore points X, Y and Z represents three underpriced stocks. On
other hand, over priced stocks are those lying below the SML and it is represented by the points
U, V and W on above graph. The difference between these stocks is because of difference in the
level of return provided to investors whereas the level of risks remaining same.
The formula depicted in the above diagram can be used for validation of underpriced
stocks that is X, Y and Z. The formula contains three variables that is P1, P0 and the amount of
dividend. The current price is represented by P1 and the purchase price represented by P0 and the
amount of dividend is represented by Div. Therefore, the optimal level of stocks is the one that is
lying on security market line indicated by the points A, B and C. Such stocks are neither
underpriced nor over priced and they depict the appropriate combination of return and risks.
Portfolio of beta is simple weighted average of betas of different securities. Therefore, the
relationship between beta and expected return of stocks gives the security market line. The
coefficient beta is the undiversified systematic risks that are indicated by security prices that
depend upon the market force.
Paraphrase This Document
Need a fresh take? Get an instant paraphrase of this document with our AI Paraphraser
7FINANCIAL MANAGEMENT
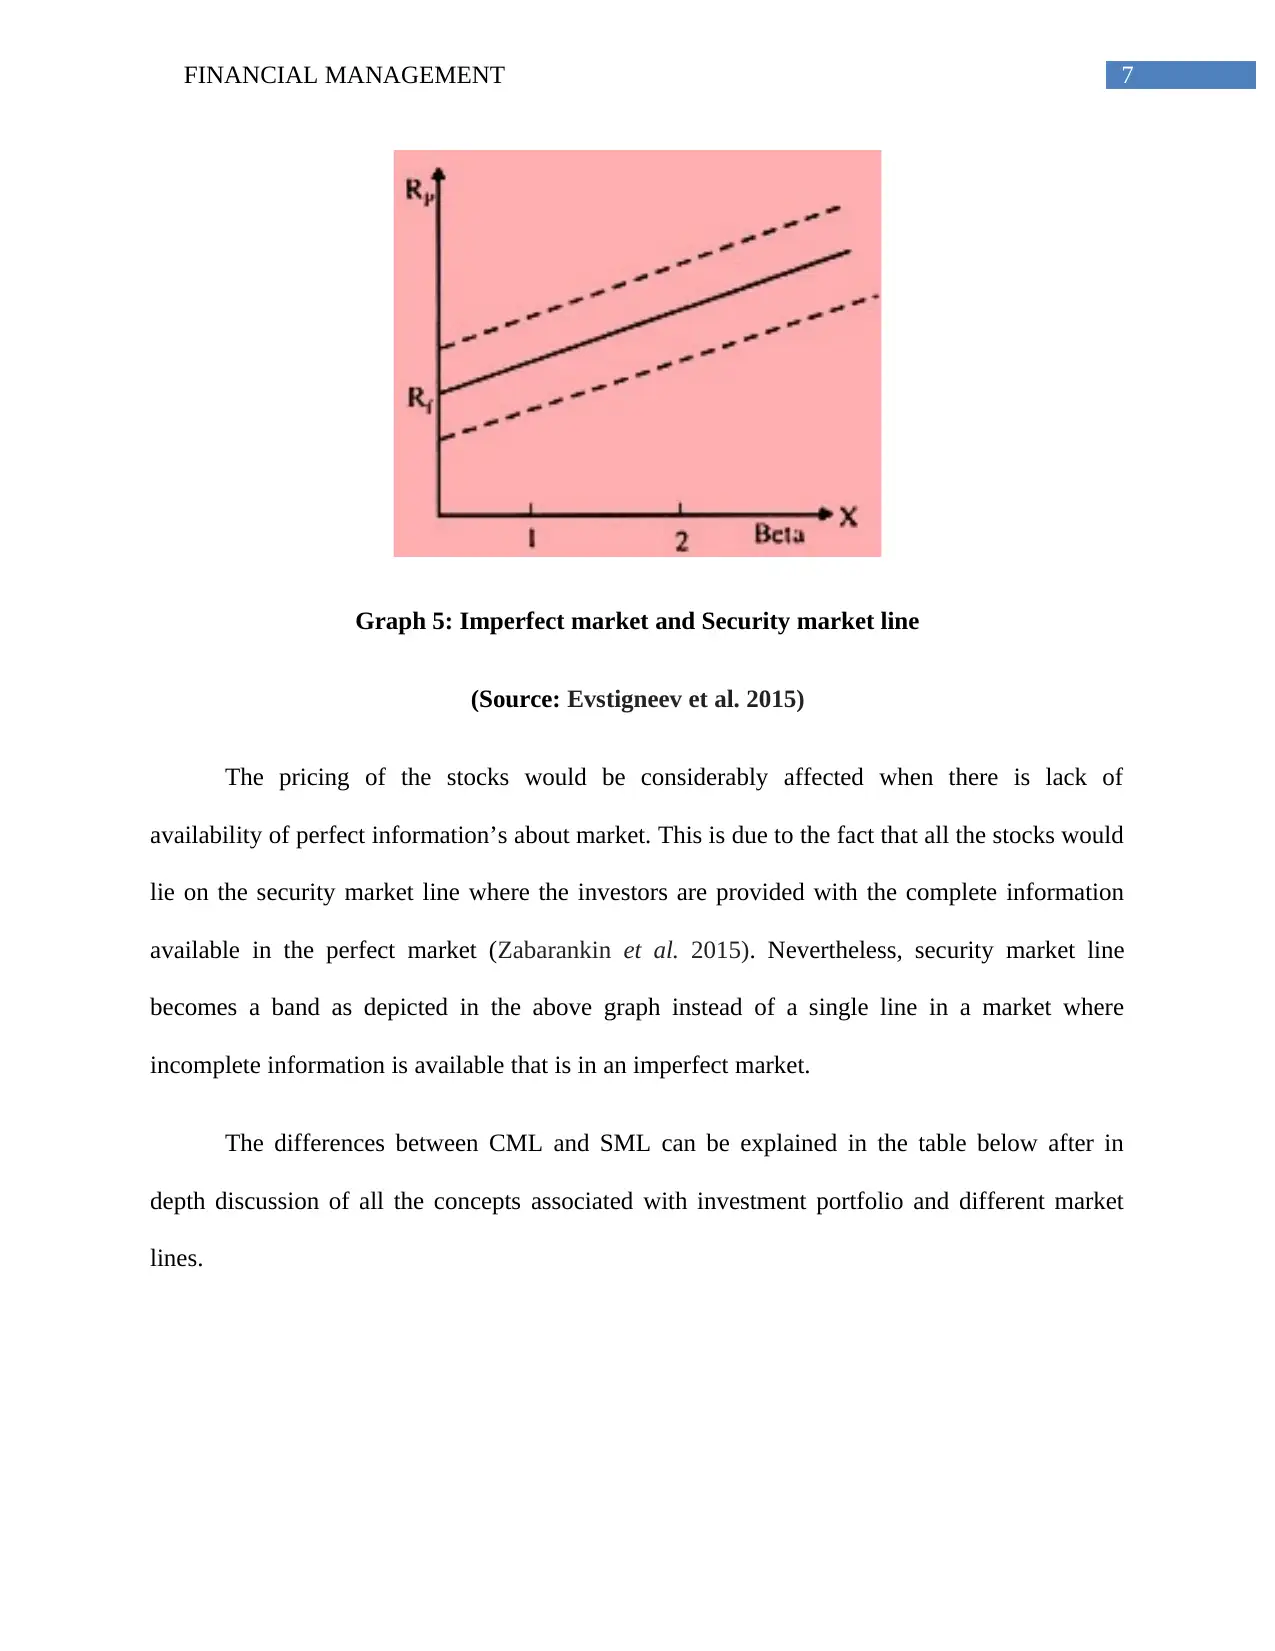
Graph 5: Imperfect market and Security market line
(Source: Evstigneev et al. 2015)
The pricing of the stocks would be considerably affected when there is lack of
availability of perfect information’s about market. This is due to the fact that all the stocks would
lie on the security market line where the investors are provided with the complete information
available in the perfect market (Zabarankin et al. 2015). Nevertheless, security market line
becomes a band as depicted in the above graph instead of a single line in a market where
incomplete information is available that is in an imperfect market.
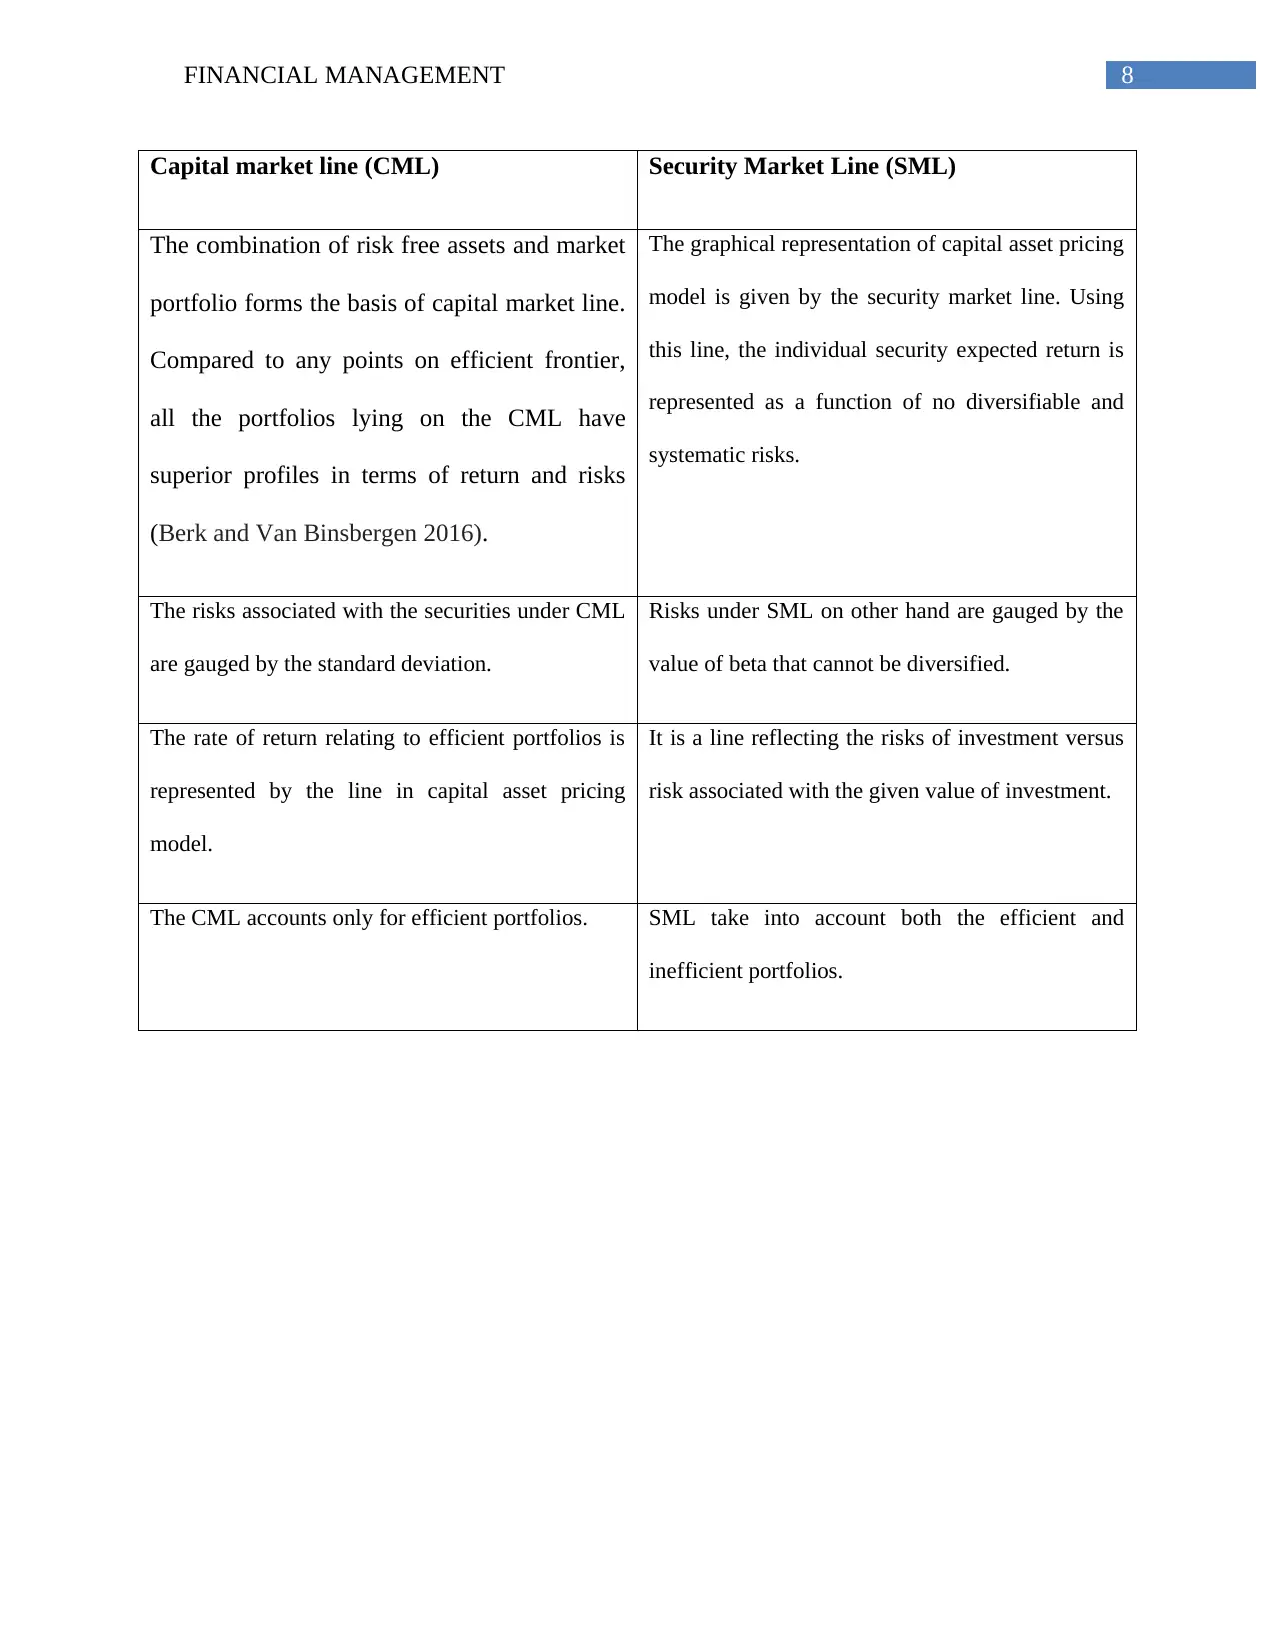
The differences between CML and SML can be explained in the table below after in
depth discussion of all the concepts associated with investment portfolio and different market
lines.
Graph 5: Imperfect market and Security market line
(Source: Evstigneev et al. 2015)
The pricing of the stocks would be considerably affected when there is lack of
availability of perfect information’s about market. This is due to the fact that all the stocks would
lie on the security market line where the investors are provided with the complete information
available in the perfect market (Zabarankin et al. 2015). Nevertheless, security market line
becomes a band as depicted in the above graph instead of a single line in a market where
incomplete information is available that is in an imperfect market.
The differences between CML and SML can be explained in the table below after in
depth discussion of all the concepts associated with investment portfolio and different market
lines.
8FINANCIAL MANAGEMENT
Capital market line (CML) Security Market Line (SML)
The combination of risk free assets and market
portfolio forms the basis of capital market line.
Compared to any points on efficient frontier,
all the portfolios lying on the CML have
superior profiles in terms of return and risks
(Berk and Van Binsbergen 2016).
The graphical representation of capital asset pricing
model is given by the security market line. Using
this line, the individual security expected return is
represented as a function of no diversifiable and
systematic risks.
The risks associated with the securities under CML
are gauged by the standard deviation.
Risks under SML on other hand are gauged by the
value of beta that cannot be diversified.
The rate of return relating to efficient portfolios is
represented by the line in capital asset pricing
model.
It is a line reflecting the risks of investment versus
risk associated with the given value of investment.
The CML accounts only for efficient portfolios. SML take into account both the efficient and
inefficient portfolios.
⊘ This is a preview!⊘
Do you want full access?
Subscribe today to unlock all pages.
Trusted by 1+ million students worldwide
9FINANCIAL MANAGEMENT
Importance of minimum variance portfolios:
The optimization of minimum variance portfolios relies on the modern portfolio theory
which takes into account the formation of portfolio by considering the risk and expected returns
of individual stocks. Such interrelationship between the return and risk is explained by the
correlation and using the concept of correlation, investor has the possibility of bettering the
simplistic portfolios. Such method makes use of indifference curve for choosing the most
desirable portfolios. According to this approach of modern portfolio, the mar jet risk for
investors is high if the investment volatility is higher (Yang et al. 2015). Therefore, investors to
make a movement up or down in terms of investment return if they seek to minimize the risks
associated with their investment. However, efficient portfolios are those providing higher return
for the same level of risks associated with inefficient portfolios.
Minimum variance portfolios estimations:
The portfolios having minimum variance are the one that lies on the efficient portfolios
where the risk parameter can be modified according to the market and investors preferences.
Method of econometrics can be used to make estimations from time to time.
Offering higher return:
It has been found that stocks generate average returns if they have lower fluctuations to
market and such return is in excess of the expected return offered by the stocks. Over the past
forty years, the low volatility premium has been documented. Such low volatility premium can
be implemented optimally using the concept of minimum variance portfolio (Varga et al. 2016).
Diversification leading to lower risks:
Minimum variance portfolio incorporates the assets that are risky on individual basis and
when they are combined for forming the portfolio would generate lower level of risks for the
Paraphrase This Document
Need a fresh take? Get an instant paraphrase of this document with our AI Paraphraser
10FINANCIAL MANAGEMENT
expected return. Using such portfolio would help investors to hedge their investment by
offsetting the level of risks (Mackaya and Haque 2016).
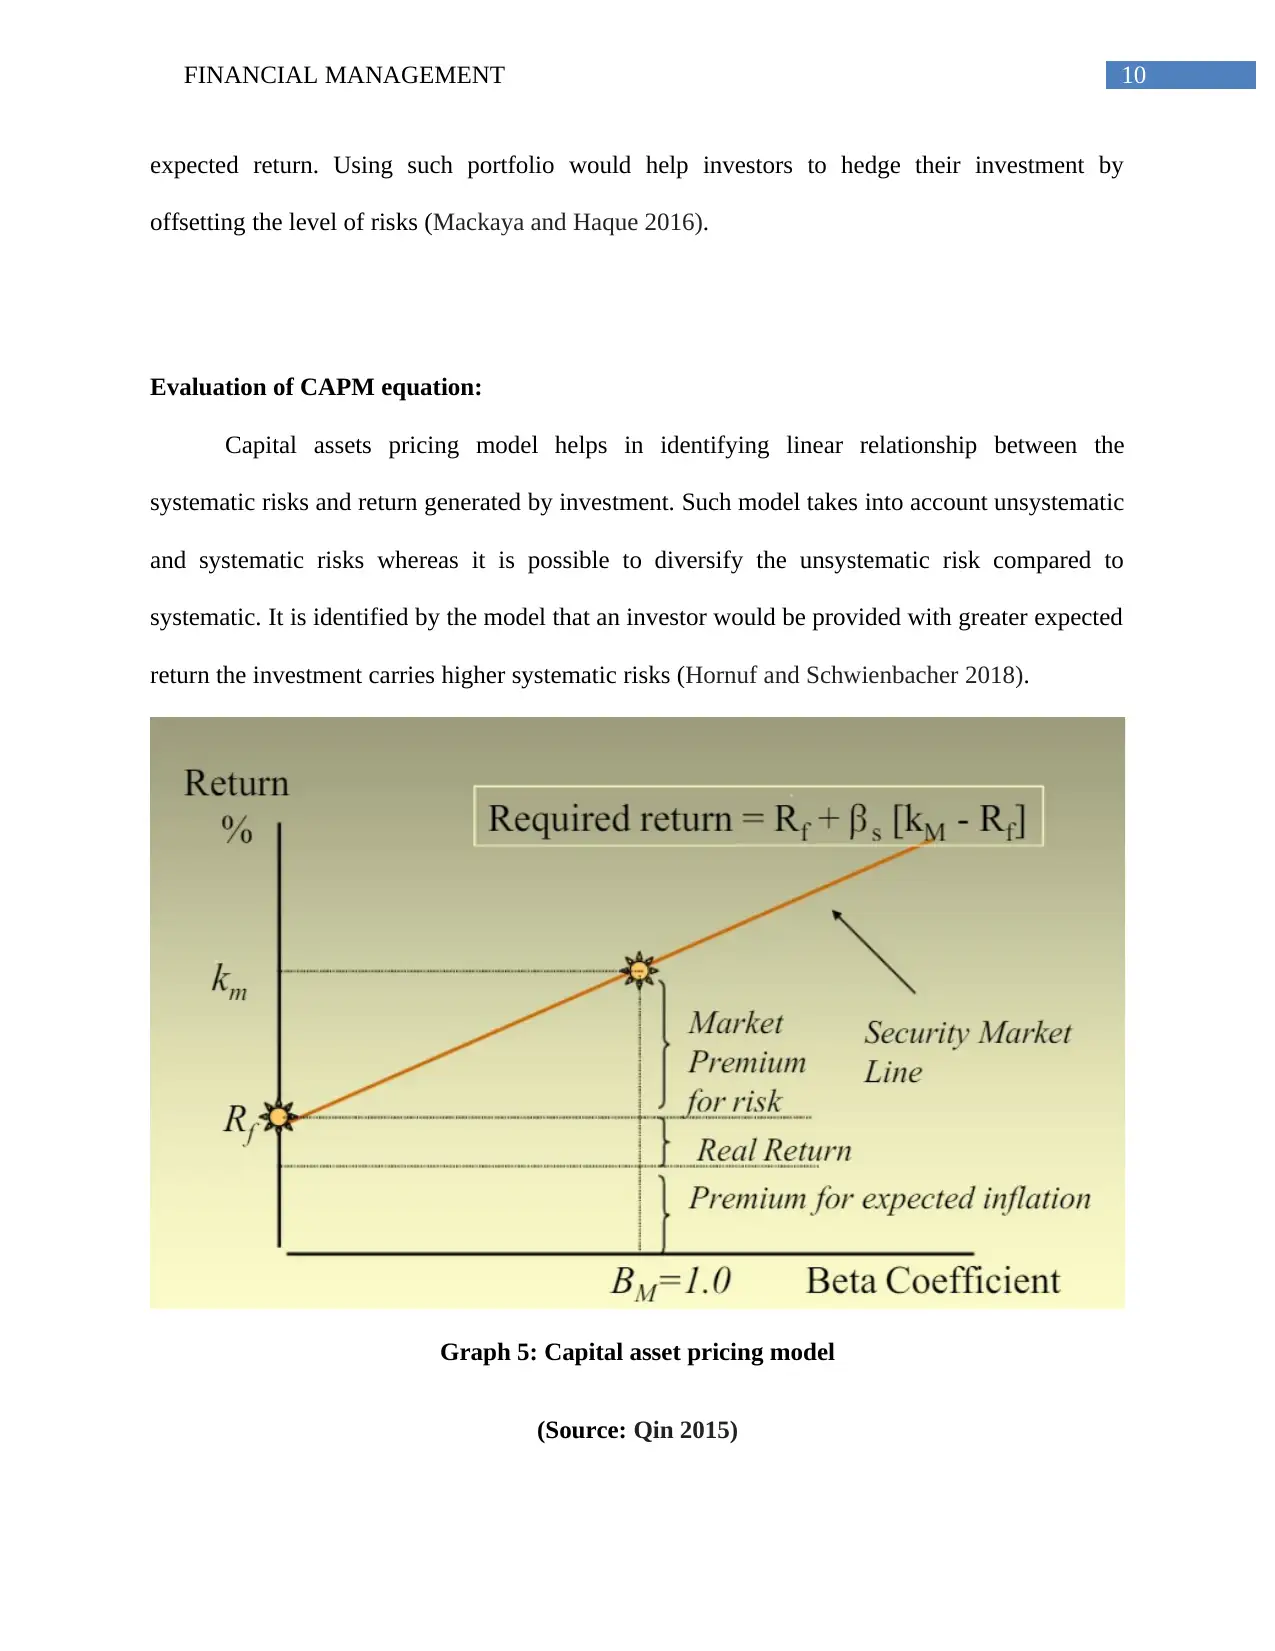
Evaluation of CAPM equation:
Capital assets pricing model helps in identifying linear relationship between the
systematic risks and return generated by investment. Such model takes into account unsystematic
and systematic risks whereas it is possible to diversify the unsystematic risk compared to
systematic. It is identified by the model that an investor would be provided with greater expected
return the investment carries higher systematic risks (Hornuf and Schwienbacher 2018).
Graph 5: Capital asset pricing model
(Source: Qin 2015)
expected return. Using such portfolio would help investors to hedge their investment by
offsetting the level of risks (Mackaya and Haque 2016).
Evaluation of CAPM equation:
Capital assets pricing model helps in identifying linear relationship between the
systematic risks and return generated by investment. Such model takes into account unsystematic
and systematic risks whereas it is possible to diversify the unsystematic risk compared to
systematic. It is identified by the model that an investor would be provided with greater expected
return the investment carries higher systematic risks (Hornuf and Schwienbacher 2018).
Graph 5: Capital asset pricing model
(Source: Qin 2015)
11FINANCIAL MANAGEMENT
Investors can measure the expected return generated from their investment using the
above graph. In addition to this, they can also compute the weighted average cost of capital
linked to their investment. The technique of capital budgeting employs the concept of weighted
average rate of return that is used as discounting rate (Pedersen and Peskir 2017).
The equation explaining the risk and return using the model of CAPM is depicted in the
above diagram. Rf is the risk free rate of return offered by the risk free assets, βs is the coefficient
beta that measures the unsystematic risk associated with the individual security and kM measures
the expected return generated by market (Christensen et al. 2016). Some of the assumptions of
CAPM are identified below:
The market can be influenced by individual investor and they act as price taker (Liu
2016).
There is one period expectation on part of investors concerning future.
Investors can borrow money and lend at the risk free rate.
All the information is instantly and freely available to investors.
The cost of transactions and taxes are not relevant.
However, such assumptions seem not to be realistic. Nevertheless, investors could rely on
the model for making better investment decision. The literature in financial management
provides the alternative to the CAPM such as Gordon growth model, Fama French model and
dividend discount model that helps in enhancement of investment decision by required rate of
return computation (Björk et al. 2014). Despite this, many investors prefer CAMP over all these
models because of several advantages in terms of discount rate, cost of equity and
diversification.
⊘ This is a preview!⊘
Do you want full access?
Subscribe today to unlock all pages.
Trusted by 1+ million students worldwide
1 out of 15
Related Documents


Your All-in-One AI-Powered Toolkit for Academic Success.
+13062052269
info@desklib.com
Available 24*7 on WhatsApp / Email
![[object Object]](/_next/static/media/star-bottom.7253800d.svg)
Unlock your academic potential
Copyright © 2020–2026 A2Z Services. All Rights Reserved. Developed and managed by ZUCOL.