Financial Resources Management: Investment Appraisal Methods
VerifiedAdded on 2023/06/10
|17
|2862
|56
Report
AI Summary
This report provides a detailed analysis of managing financial resources, covering various aspects such as break-even point calculations, margin of safety, and target profit analysis. It delves into the limitations of cost volume profit analysis and explores different investment appraisal methods, including payback period, accounting rate of return, net present value, and internal rate of return. The report includes calculations, comments on each calculation, and an evaluation of the benefits and limitations of each investment appraisal method. It also examines the cost of capital, efficient market hypothesis, and present value of cash flows, providing a comprehensive overview of financial resource management and investment decision-making. Access this and more solved assignments on Desklib, your go-to platform for study resources.

Managing Financial
Resources
Resources
Paraphrase This Document
Need a fresh take? Get an instant paraphrase of this document with our AI Paraphraser
Table of Contents
PART 1............................................................................................................................................4
1...................................................................................................................................................4
2...................................................................................................................................................4
3...................................................................................................................................................4
4...................................................................................................................................................4
5...................................................................................................................................................4
6...................................................................................................................................................4
7...................................................................................................................................................4
8...................................................................................................................................................4
Q9................................................................................................................................................4
Q10..............................................................................................................................................5
Q11..............................................................................................................................................5
Q12..............................................................................................................................................5
Q13..............................................................................................................................................5
Q.14.............................................................................................................................................5
Q.15.............................................................................................................................................6
Q.16.............................................................................................................................................6
Q.17.............................................................................................................................................6
Q.18.............................................................................................................................................6
Q.19.............................................................................................................................................7
Q.20.............................................................................................................................................7
Q.21.............................................................................................................................................7
Q.22.............................................................................................................................................7
Q.23.............................................................................................................................................7
Q.24.............................................................................................................................................8
Q.25.............................................................................................................................................8
PART 2............................................................................................................................................8
Question 2........................................................................................................................................8
1...................................................................................................................................................8
(a) Calculation of Break-even point in revenue (£) and in quantity (in units)............................8
(b) Calculation of margin of safety..............................................................................................9
(C) Calculation of units of vehicles to be sold for a target profit of £200000...........................10
2.................................................................................................................................................11
Limitation of Cost Volume Profit Analysis...............................................................................11
QUESTION 3................................................................................................................................11
Payback period...........................................................................................................................12
Accounting rate of return...........................................................................................................12
Net present value.......................................................................................................................13
Internal rate of return.................................................................................................................14
Providing the comment on each calculation..............................................................................14
Evaluating benefits and limitations of using each of the investment appraisal methods..........15
REFERENCES................................................................................................................................1
⊘ This is a preview!⊘
Do you want full access?
Subscribe today to unlock all pages.
Trusted by 1+ million students worldwide
PART 1
1
Balance sheet
2
Balance sheet
3
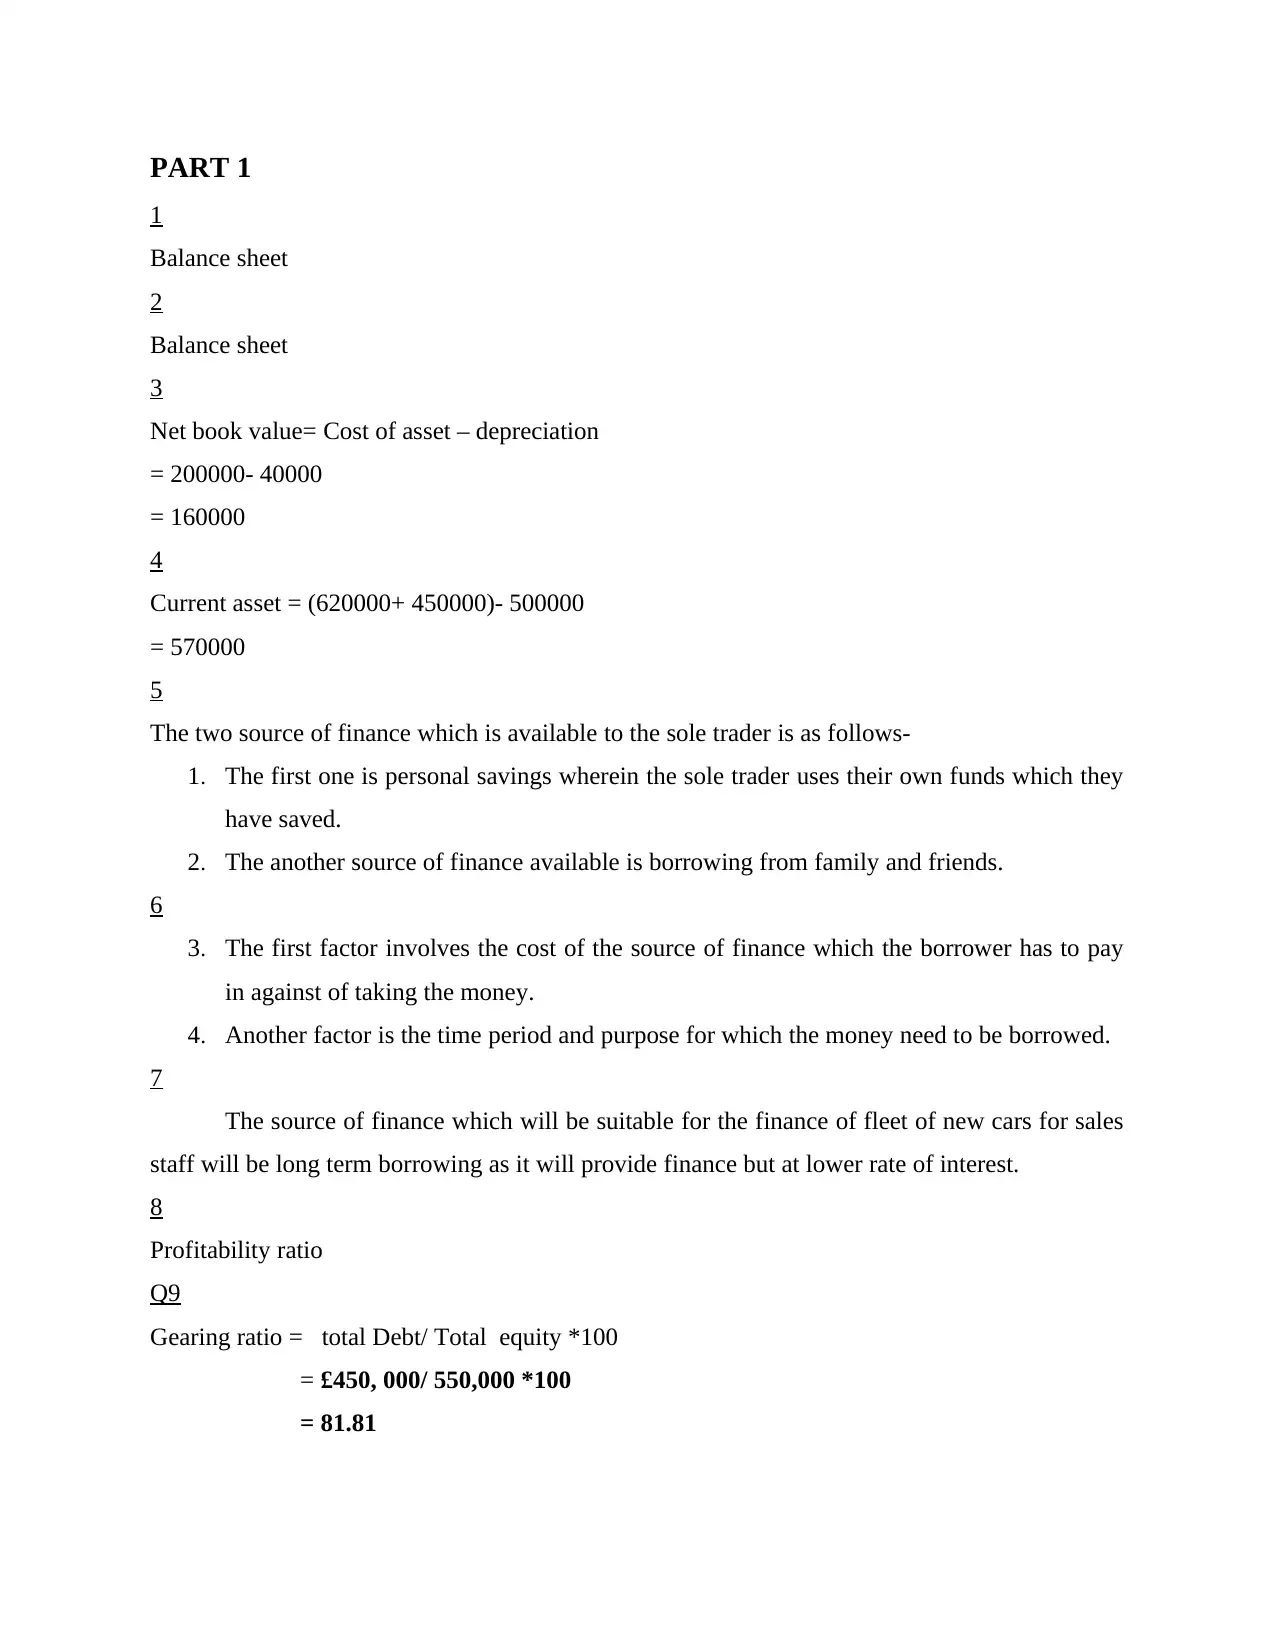
Net book value= Cost of asset – depreciation
= 200000- 40000
= 160000
4
Current asset = (620000+ 450000)- 500000
= 570000
5
The two source of finance which is available to the sole trader is as follows-
1. The first one is personal savings wherein the sole trader uses their own funds which they
have saved.
2. The another source of finance available is borrowing from family and friends.
6
3. The first factor involves the cost of the source of finance which the borrower has to pay
in against of taking the money.
4. Another factor is the time period and purpose for which the money need to be borrowed.
7
The source of finance which will be suitable for the finance of fleet of new cars for sales
staff will be long term borrowing as it will provide finance but at lower rate of interest.
8
Profitability ratio
Q9
Gearing ratio = total Debt/ Total equity *100
= £450, 000/ 550,000 *100
= 81.81
1
Balance sheet
2
Balance sheet
3
Net book value= Cost of asset – depreciation
= 200000- 40000
= 160000
4
Current asset = (620000+ 450000)- 500000
= 570000
5
The two source of finance which is available to the sole trader is as follows-
1. The first one is personal savings wherein the sole trader uses their own funds which they
have saved.
2. The another source of finance available is borrowing from family and friends.
6
3. The first factor involves the cost of the source of finance which the borrower has to pay
in against of taking the money.
4. Another factor is the time period and purpose for which the money need to be borrowed.
7
The source of finance which will be suitable for the finance of fleet of new cars for sales
staff will be long term borrowing as it will provide finance but at lower rate of interest.
8
Profitability ratio
Q9
Gearing ratio = total Debt/ Total equity *100
= £450, 000/ 550,000 *100
= 81.81
Paraphrase This Document
Need a fresh take? Get an instant paraphrase of this document with our AI Paraphraser
Q10
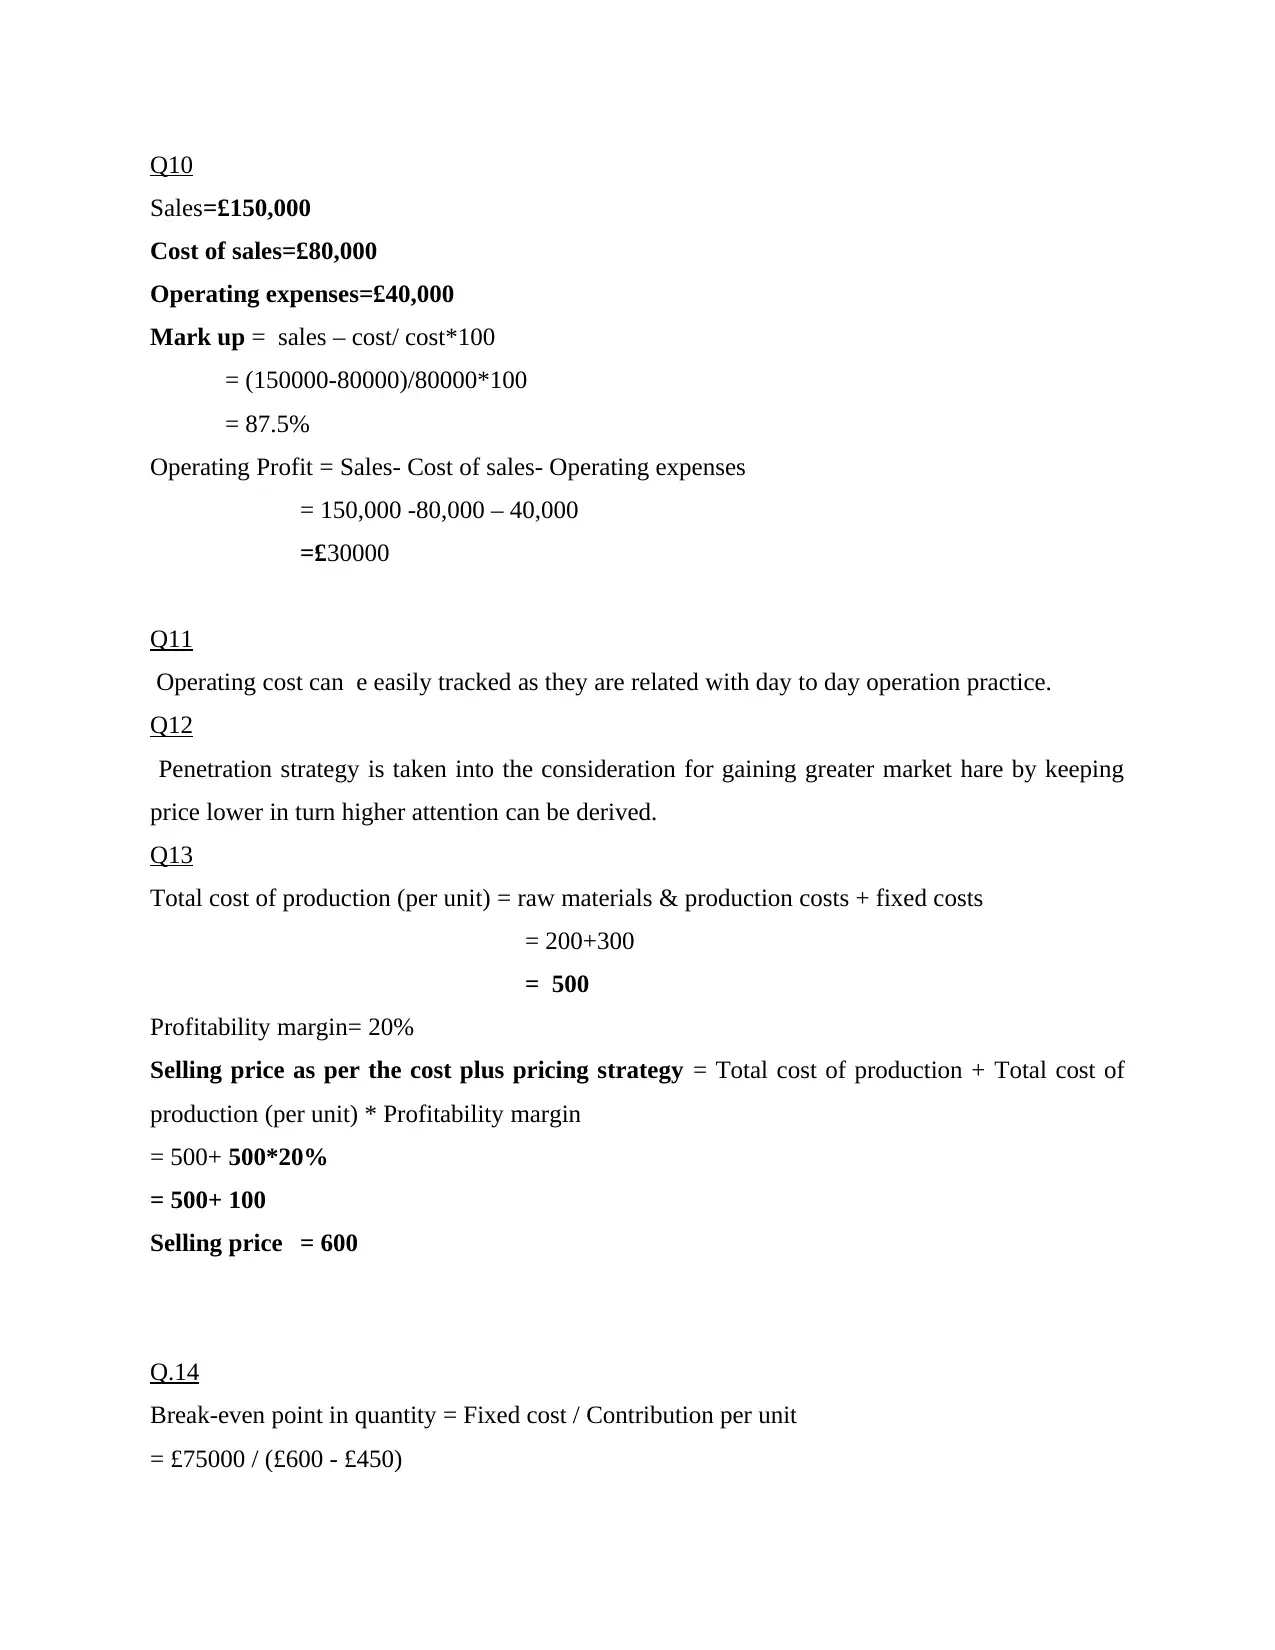
Sales=£150,000
Cost of sales=£80,000
Operating expenses=£40,000
Mark up = sales – cost/ cost*100
= (150000-80000)/80000*100
= 87.5%
Operating Profit = Sales- Cost of sales- Operating expenses
= 150,000 -80,000 – 40,000
=£30000
Q11
Operating cost can e easily tracked as they are related with day to day operation practice.
Q12
Penetration strategy is taken into the consideration for gaining greater market hare by keeping
price lower in turn higher attention can be derived.
Q13
Total cost of production (per unit) = raw materials & production costs + fixed costs
= 200+300
= 500
Profitability margin= 20%
Selling price as per the cost plus pricing strategy = Total cost of production + Total cost of
production (per unit) * Profitability margin
= 500+ 500*20%
= 500+ 100
Selling price = 600
Q.14
Break-even point in quantity = Fixed cost / Contribution per unit
= £75000 / (£600 - £450)
= £75000 / £150
= 500 units
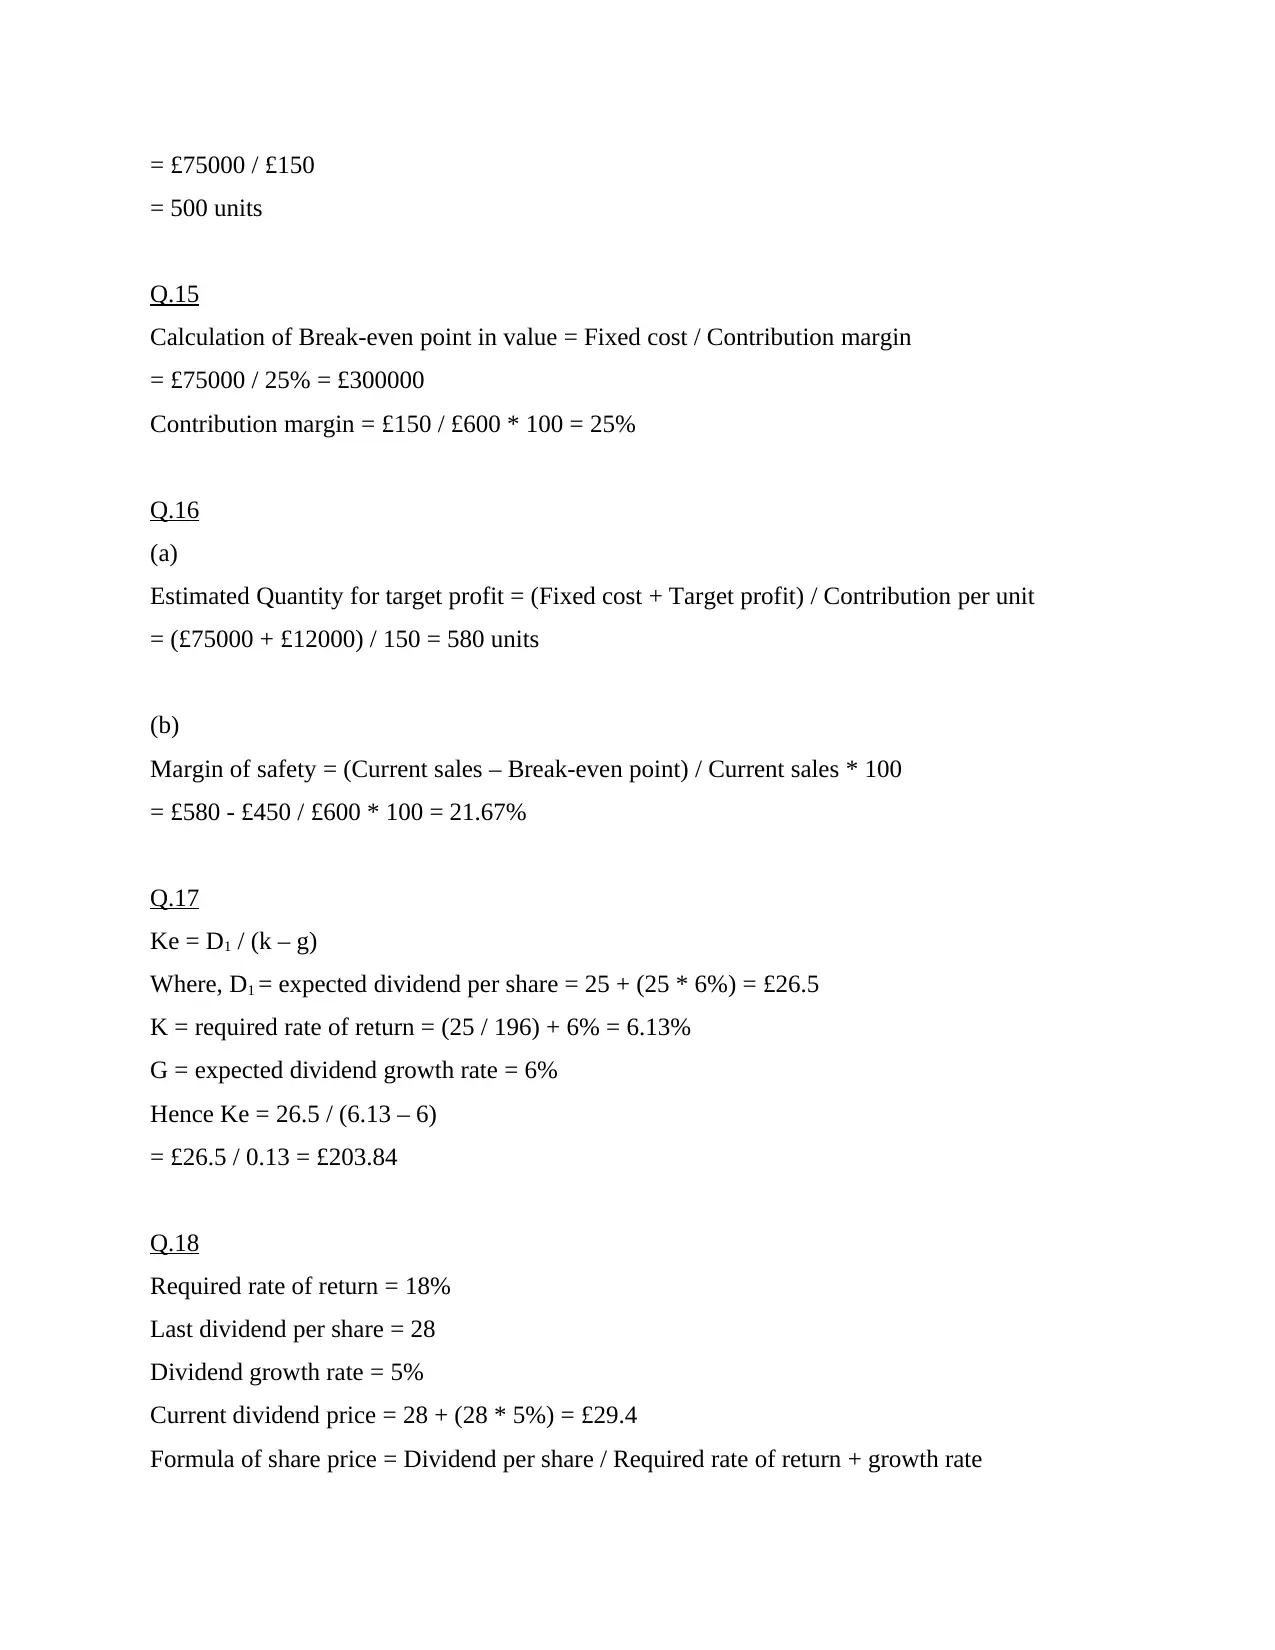
Q.15
Calculation of Break-even point in value = Fixed cost / Contribution margin
= £75000 / 25% = £300000
Contribution margin = £150 / £600 * 100 = 25%
Q.16
(a)
Estimated Quantity for target profit = (Fixed cost + Target profit) / Contribution per unit
= (£75000 + £12000) / 150 = 580 units
(b)
Margin of safety = (Current sales – Break-even point) / Current sales * 100
= £580 - £450 / £600 * 100 = 21.67%
Q.17
Ke = D1 / (k – g)
Where, D1 = expected dividend per share = 25 + (25 * 6%) = £26.5
K = required rate of return = (25 / 196) + 6% = 6.13%
G = expected dividend growth rate = 6%
Hence Ke = 26.5 / (6.13 – 6)
= £26.5 / 0.13 = £203.84
Q.18
Required rate of return = 18%
Last dividend per share = 28
Dividend growth rate = 5%
Current dividend price = 28 + (28 * 5%) = £29.4
Formula of share price = Dividend per share / Required rate of return + growth rate
= 500 units
Q.15
Calculation of Break-even point in value = Fixed cost / Contribution margin
= £75000 / 25% = £300000
Contribution margin = £150 / £600 * 100 = 25%
Q.16
(a)
Estimated Quantity for target profit = (Fixed cost + Target profit) / Contribution per unit
= (£75000 + £12000) / 150 = 580 units
(b)
Margin of safety = (Current sales – Break-even point) / Current sales * 100
= £580 - £450 / £600 * 100 = 21.67%
Q.17
Ke = D1 / (k – g)
Where, D1 = expected dividend per share = 25 + (25 * 6%) = £26.5
K = required rate of return = (25 / 196) + 6% = 6.13%
G = expected dividend growth rate = 6%
Hence Ke = 26.5 / (6.13 – 6)
= £26.5 / 0.13 = £203.84
Q.18
Required rate of return = 18%
Last dividend per share = 28
Dividend growth rate = 5%
Current dividend price = 28 + (28 * 5%) = £29.4
Formula of share price = Dividend per share / Required rate of return + growth rate
⊘ This is a preview!⊘
Do you want full access?
Subscribe today to unlock all pages.
Trusted by 1+ million students worldwide
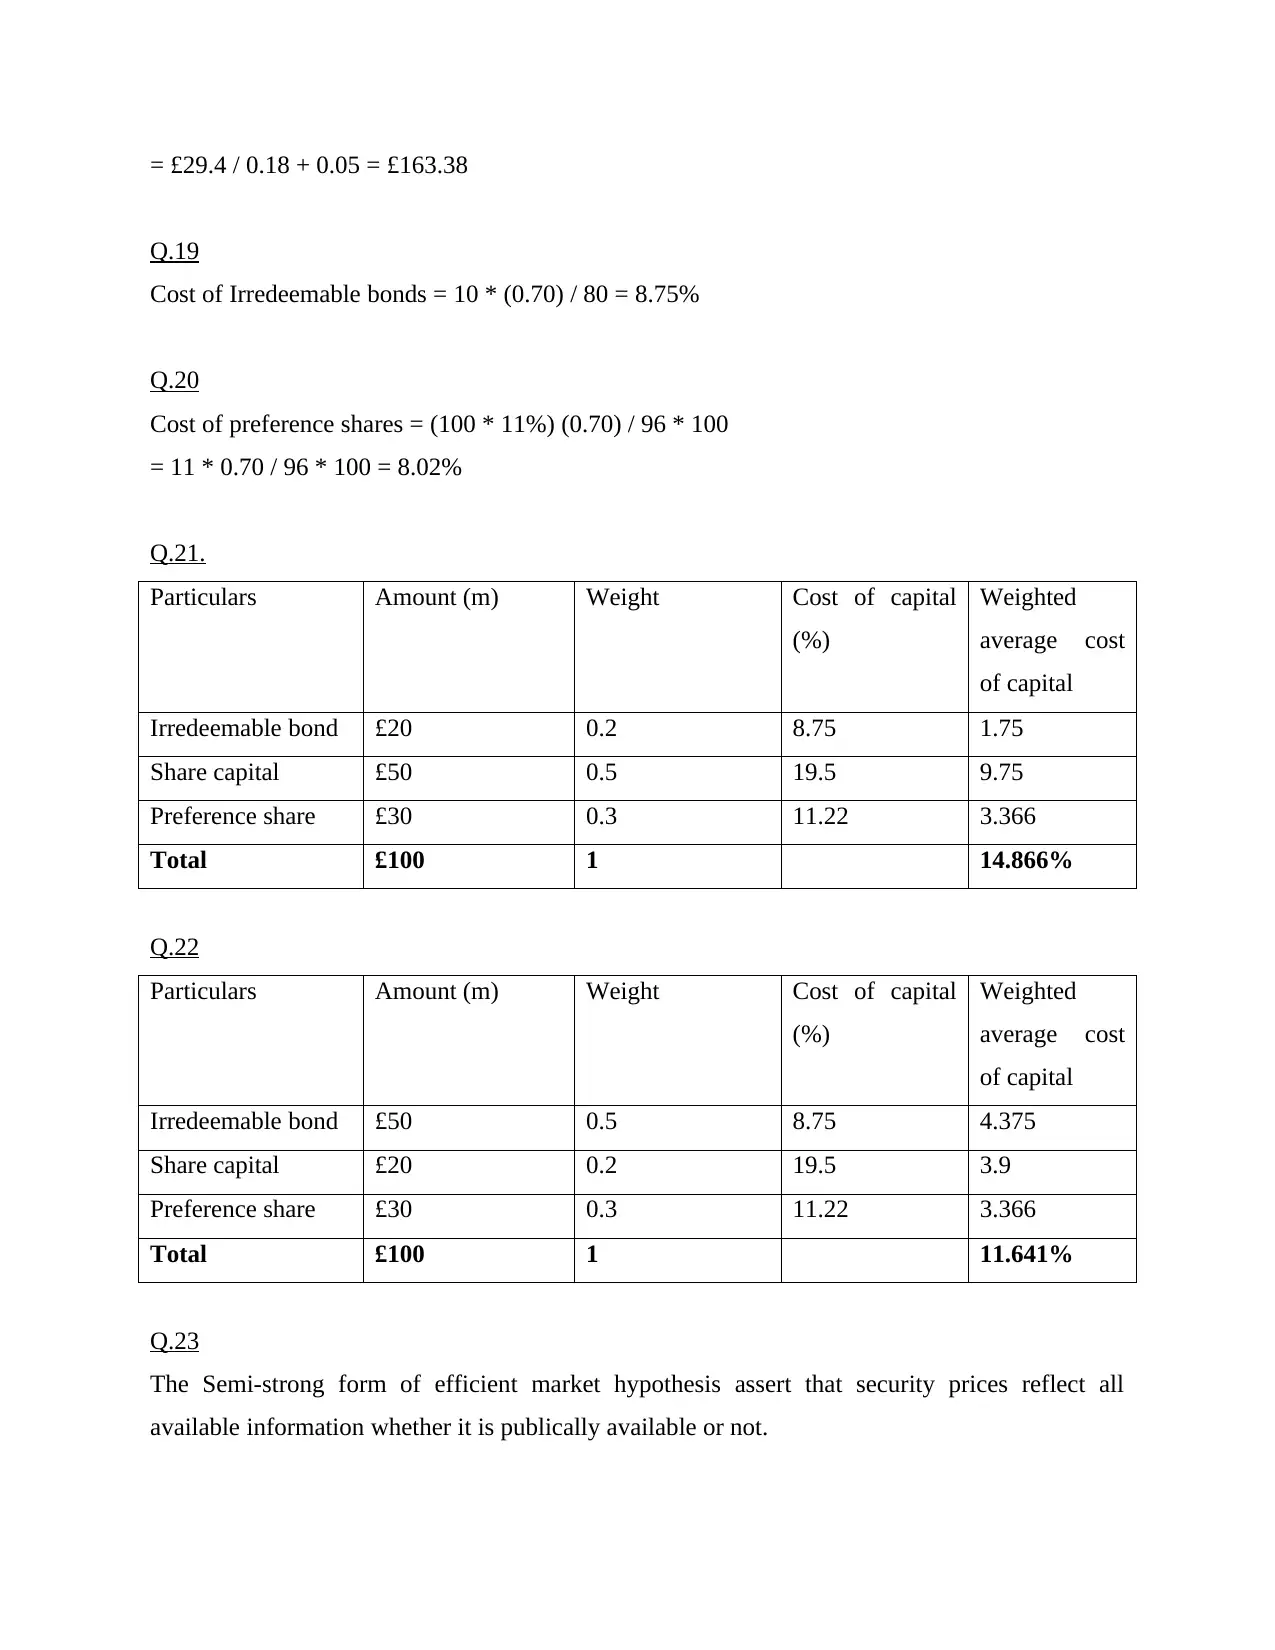
= £29.4 / 0.18 + 0.05 = £163.38
Q.19
Cost of Irredeemable bonds = 10 * (0.70) / 80 = 8.75%
Q.20
Cost of preference shares = (100 * 11%) (0.70) / 96 * 100
= 11 * 0.70 / 96 * 100 = 8.02%
Q.21.
Particulars Amount (m) Weight Cost of capital
(%)
Weighted
average cost
of capital
Irredeemable bond £20 0.2 8.75 1.75
Share capital £50 0.5 19.5 9.75
Preference share £30 0.3 11.22 3.366
Total £100 1 14.866%
Q.22
Particulars Amount (m) Weight Cost of capital
(%)
Weighted
average cost
of capital
Irredeemable bond £50 0.5 8.75 4.375
Share capital £20 0.2 19.5 3.9
Preference share £30 0.3 11.22 3.366
Total £100 1 11.641%
Q.23
The Semi-strong form of efficient market hypothesis assert that security prices reflect all
available information whether it is publically available or not.
Paraphrase This Document
Need a fresh take? Get an instant paraphrase of this document with our AI Paraphraser
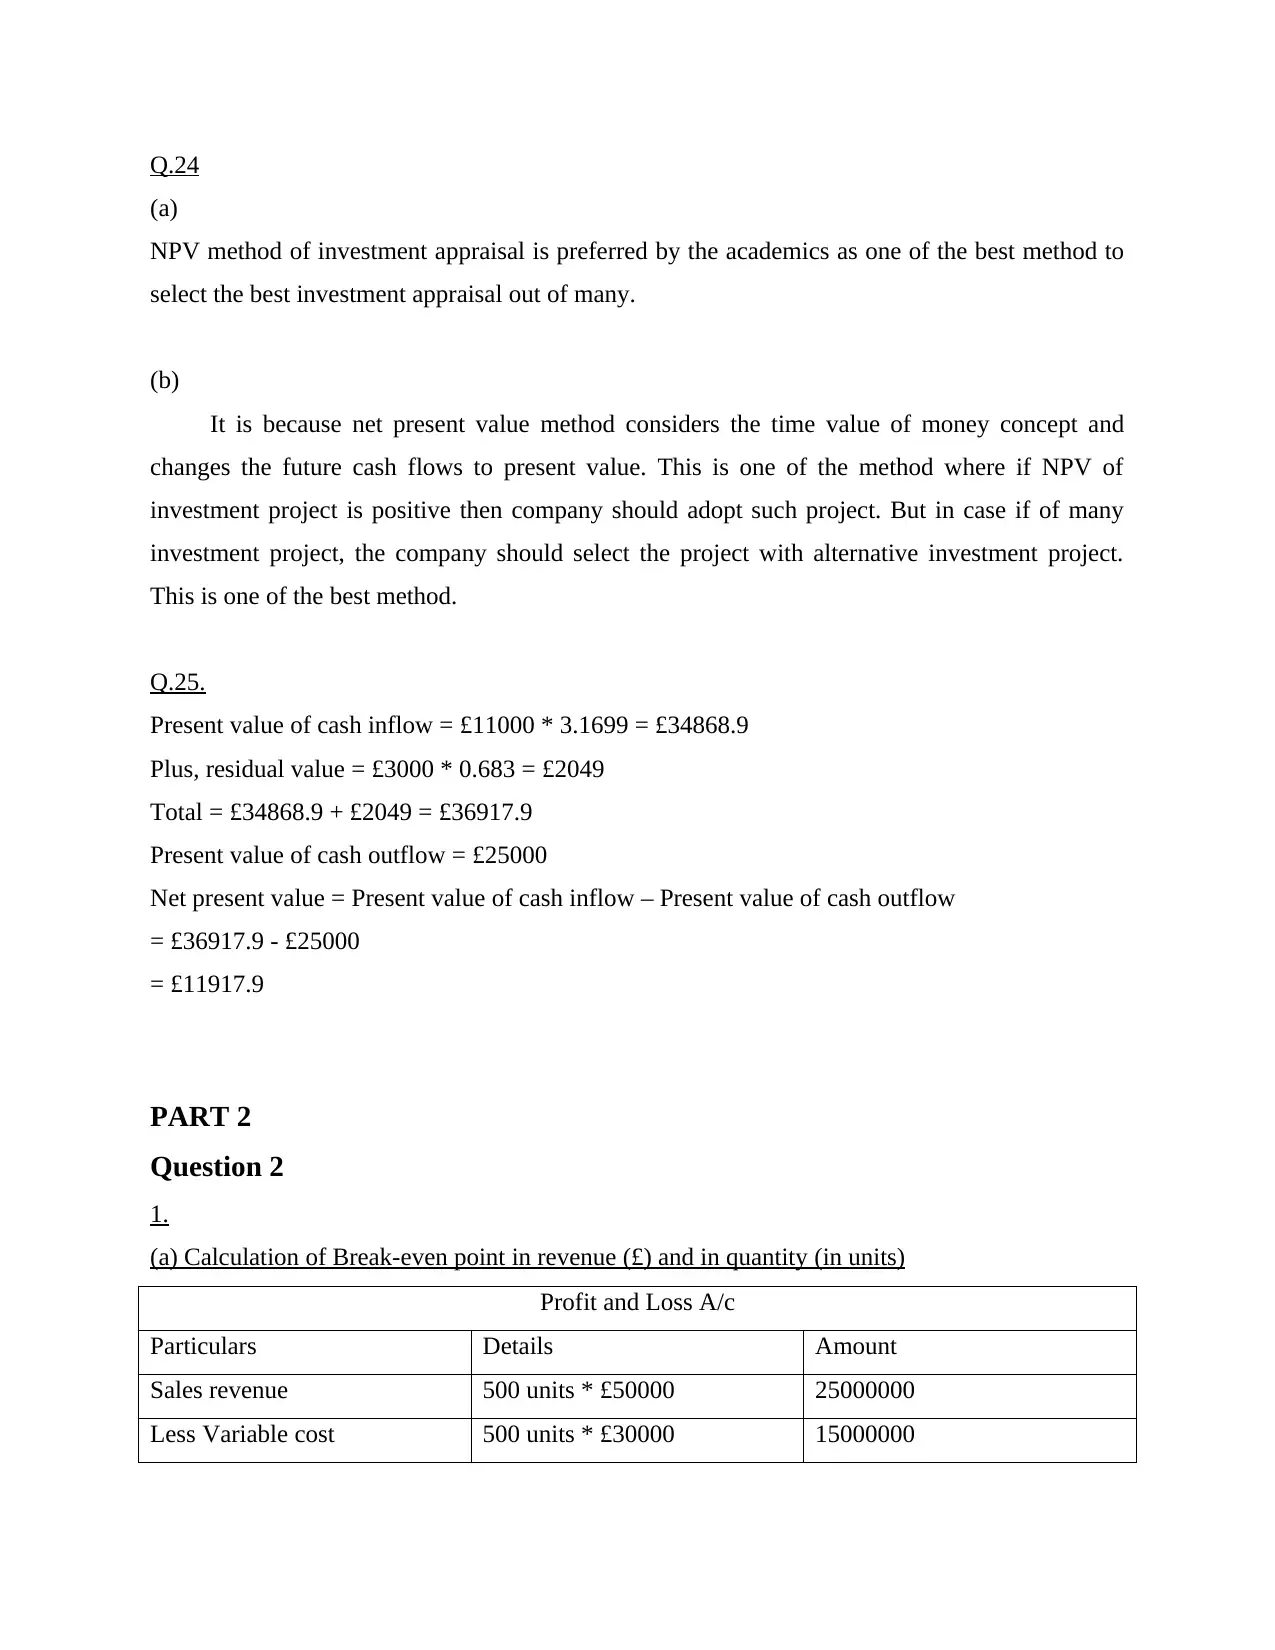
Q.24
(a)
NPV method of investment appraisal is preferred by the academics as one of the best method to
select the best investment appraisal out of many.
(b)
It is because net present value method considers the time value of money concept and
changes the future cash flows to present value. This is one of the method where if NPV of
investment project is positive then company should adopt such project. But in case if of many
investment project, the company should select the project with alternative investment project.
This is one of the best method.
Q.25.
Present value of cash inflow = £11000 * 3.1699 = £34868.9
Plus, residual value = £3000 * 0.683 = £2049
Total = £34868.9 + £2049 = £36917.9
Present value of cash outflow = £25000
Net present value = Present value of cash inflow – Present value of cash outflow
= £36917.9 - £25000
= £11917.9
PART 2
Question 2
1.
(a) Calculation of Break-even point in revenue (£) and in quantity (in units)
Profit and Loss A/c
Particulars Details Amount
Sales revenue 500 units * £50000 25000000
Less Variable cost 500 units * £30000 15000000
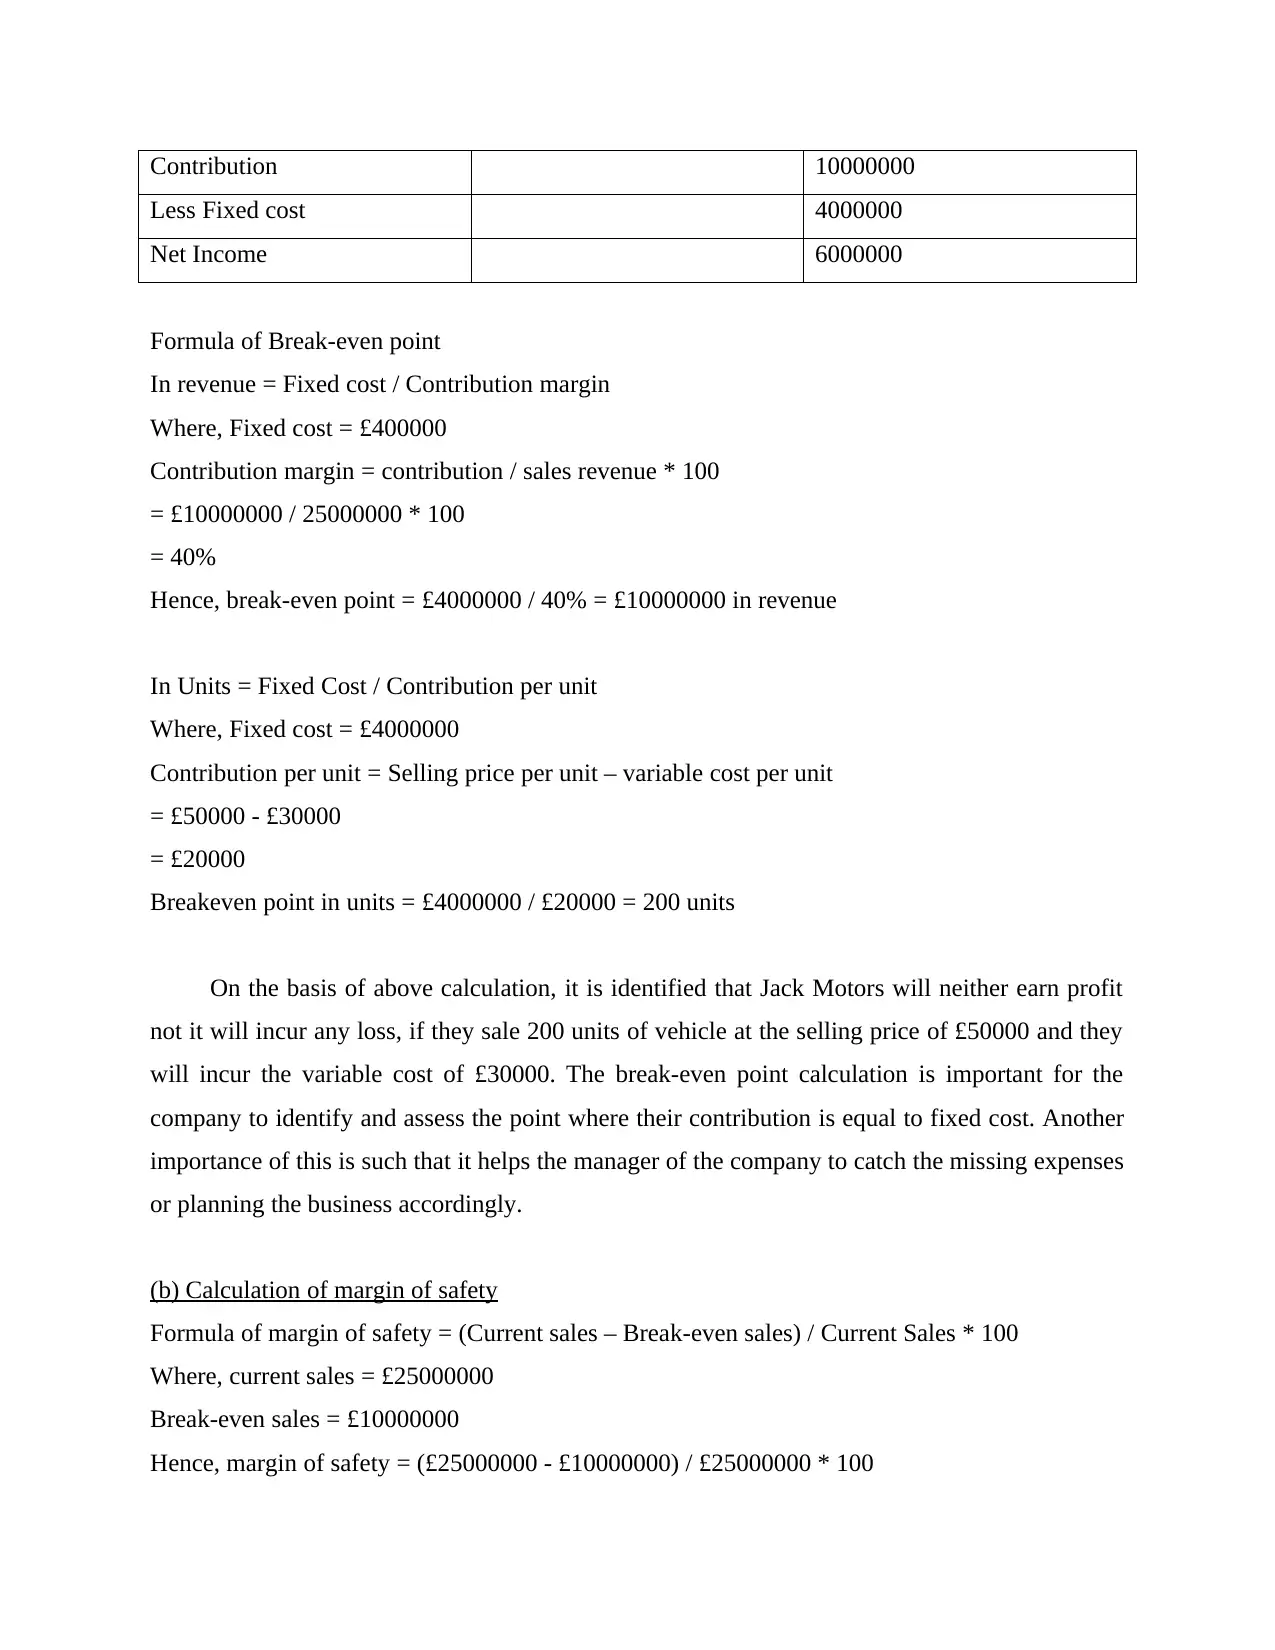
Contribution 10000000
Less Fixed cost 4000000
Net Income 6000000
Formula of Break-even point
In revenue = Fixed cost / Contribution margin
Where, Fixed cost = £400000
Contribution margin = contribution / sales revenue * 100
= £10000000 / 25000000 * 100
= 40%
Hence, break-even point = £4000000 / 40% = £10000000 in revenue
In Units = Fixed Cost / Contribution per unit
Where, Fixed cost = £4000000
Contribution per unit = Selling price per unit – variable cost per unit
= £50000 - £30000
= £20000
Breakeven point in units = £4000000 / £20000 = 200 units
On the basis of above calculation, it is identified that Jack Motors will neither earn profit
not it will incur any loss, if they sale 200 units of vehicle at the selling price of £50000 and they
will incur the variable cost of £30000. The break-even point calculation is important for the
company to identify and assess the point where their contribution is equal to fixed cost. Another
importance of this is such that it helps the manager of the company to catch the missing expenses
or planning the business accordingly.
(b) Calculation of margin of safety
Formula of margin of safety = (Current sales – Break-even sales) / Current Sales * 100
Where, current sales = £25000000
Break-even sales = £10000000
Hence, margin of safety = (£25000000 - £10000000) / £25000000 * 100
⊘ This is a preview!⊘
Do you want full access?
Subscribe today to unlock all pages.
Trusted by 1+ million students worldwide

= 60%
The margin of safety in the break-even analysis is the amount of sales that are above the
break-even sales. On the basis of above calculation, it is identified that Jack Motors margin of
safety is 60%. It means 60% of the sales units or revenue of company is higher than the break-
even sales that generate earnings or net income for the company (Kravchyk, Okur and
Kovalenko, 2021). Hence, this answer is important for the management of Jack Motors to
analyse whether they need to continue with the product or not.
(C) Calculation of units of vehicles to be sold for a target profit of £200000
Let, assume units of vehicles to be sold at a target profit of £200000 is x
Profit and Loss A/c
Particulars Details Amount
Sales revenue x units * £50000 50000x
Less Variable cost x units * £30000 30000x
Contribution 20000x
Less Fixed cost 4000000
Net Income 200000
On the basis of above P&L, the equation will become 20000x – 4000000 = 200000
= 20000x = 200000 + 4000000
= 20000x = 600000
X = 4200000 / 20000
= 210 units of vehicles.
Hence, as per above calculation of equation, it can be said that the company need to sold 210
units of vehicles in order to earn the target profit of £200000. This calculation or result is
important for the production line manager of Jack Motors to understand and analyse the number
of vehicles they need to sale in order to earn the target profit of business (Sintha, 2020).
Paraphrase This Document
Need a fresh take? Get an instant paraphrase of this document with our AI Paraphraser
2.
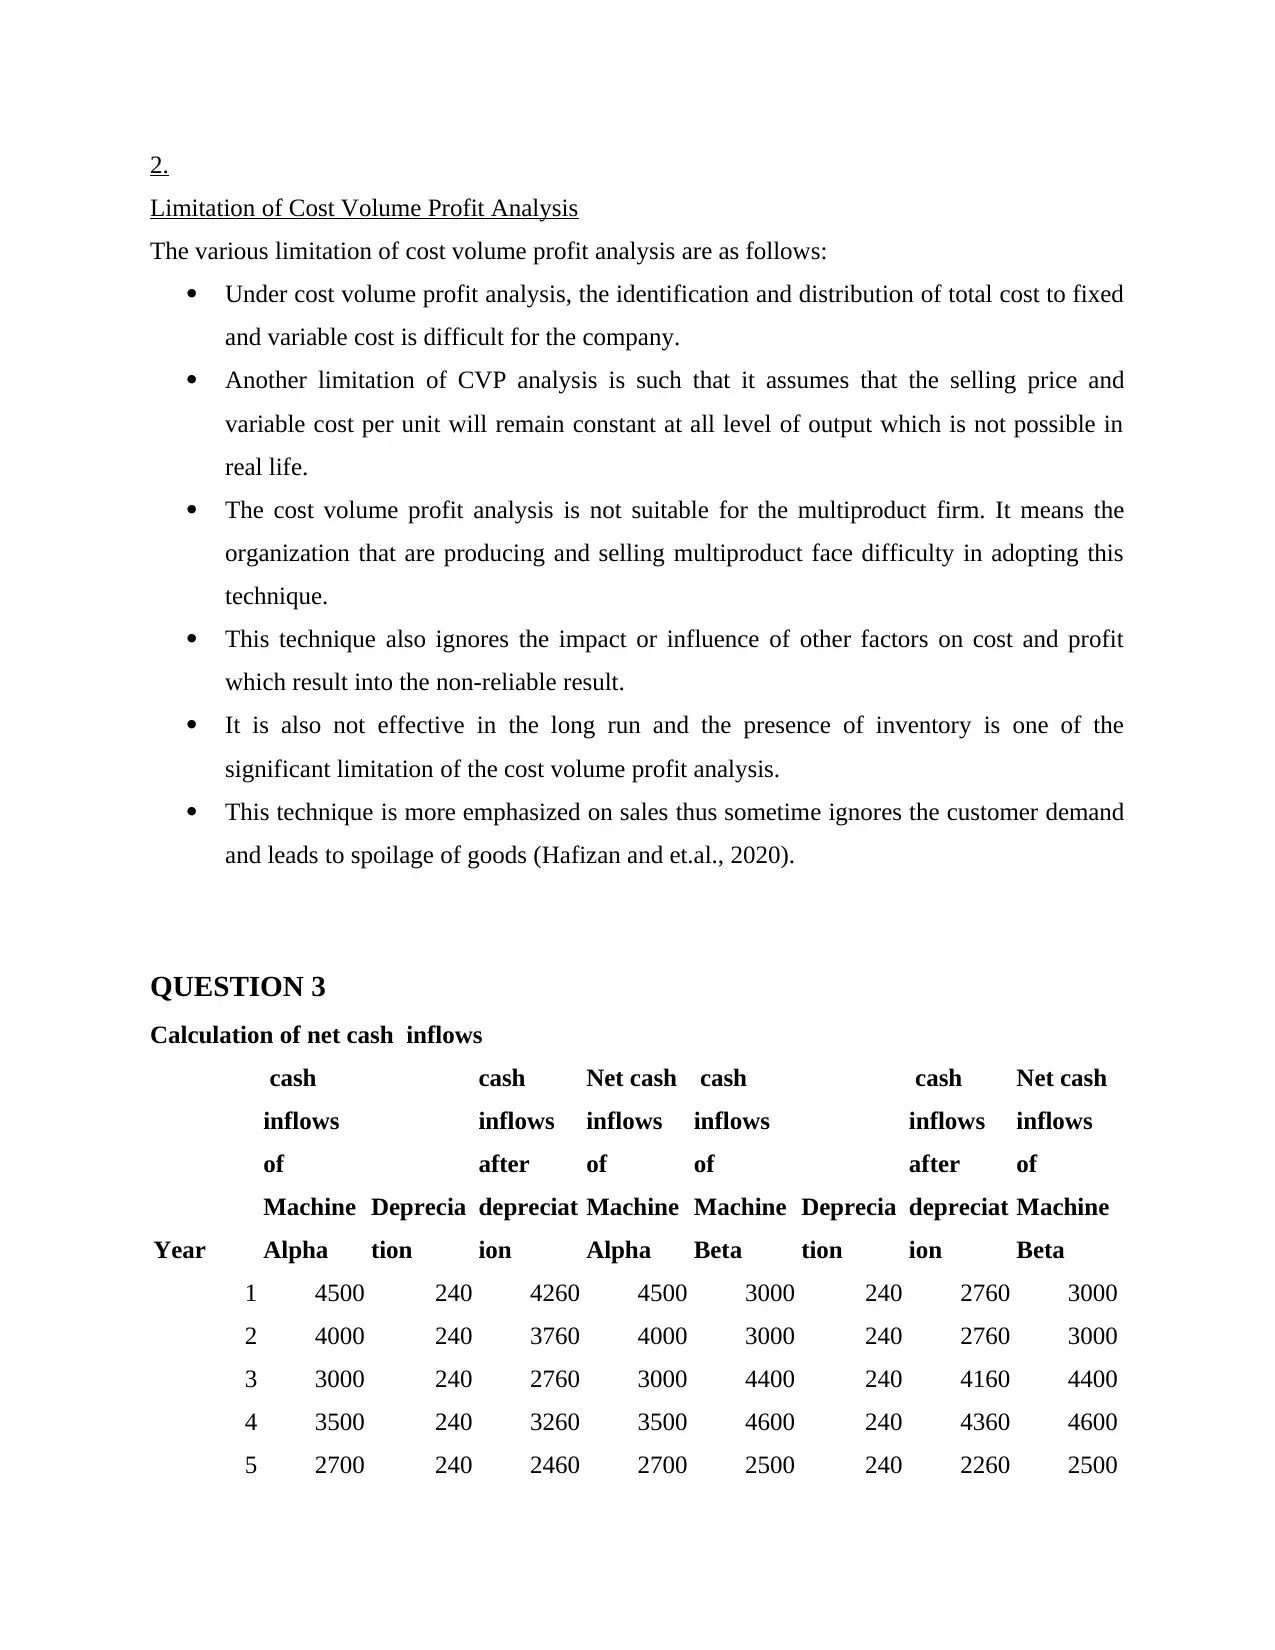
Limitation of Cost Volume Profit Analysis
The various limitation of cost volume profit analysis are as follows:
Under cost volume profit analysis, the identification and distribution of total cost to fixed
and variable cost is difficult for the company.
Another limitation of CVP analysis is such that it assumes that the selling price and
variable cost per unit will remain constant at all level of output which is not possible in
real life.
The cost volume profit analysis is not suitable for the multiproduct firm. It means the
organization that are producing and selling multiproduct face difficulty in adopting this
technique.
This technique also ignores the impact or influence of other factors on cost and profit
which result into the non-reliable result.
It is also not effective in the long run and the presence of inventory is one of the
significant limitation of the cost volume profit analysis.
This technique is more emphasized on sales thus sometime ignores the customer demand
and leads to spoilage of goods (Hafizan and et.al., 2020).
QUESTION 3
Calculation of net cash inflows
Year
cash
inflows
of
Machine
Alpha
Deprecia
tion
cash
inflows
after
depreciat
ion
Net cash
inflows
of
Machine
Alpha
cash
inflows
of
Machine
Beta
Deprecia
tion
cash
inflows
after
depreciat
ion
Net cash
inflows
of
Machine
Beta
1 4500 240 4260 4500 3000 240 2760 3000
2 4000 240 3760 4000 3000 240 2760 3000
3 3000 240 2760 3000 4400 240 4160 4400
4 3500 240 3260 3500 4600 240 4360 4600
5 2700 240 2460 2700 2500 240 2260 2500
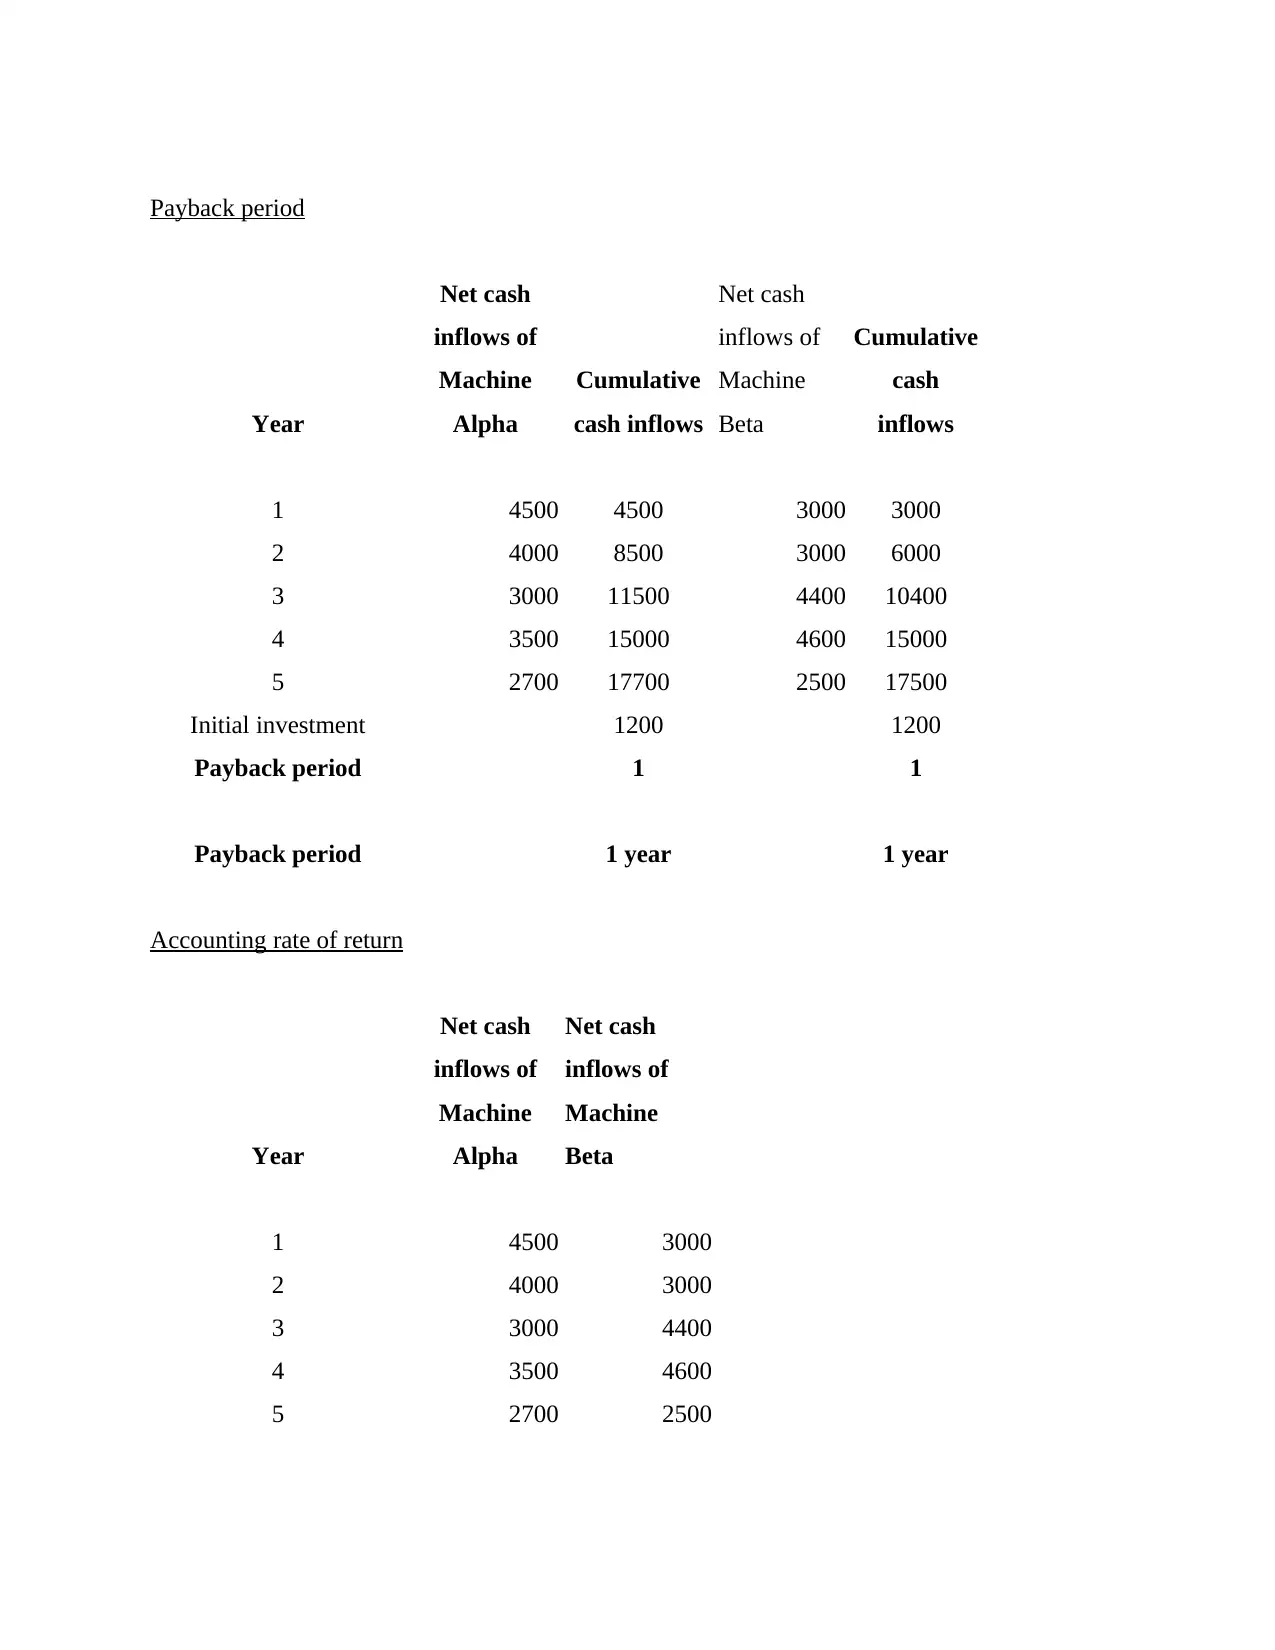
Payback period
Year
Net cash
inflows of
Machine
Alpha
Cumulative
cash inflows
Net cash
inflows of
Machine
Beta
Cumulative
cash
inflows
1 4500 4500 3000 3000
2 4000 8500 3000 6000
3 3000 11500 4400 10400
4 3500 15000 4600 15000
5 2700 17700 2500 17500
Initial investment 1200 1200
Payback period 1 1
Payback period 1 year 1 year
Accounting rate of return
Year
Net cash
inflows of
Machine
Alpha
Net cash
inflows of
Machine
Beta
1 4500 3000
2 4000 3000
3 3000 4400
4 3500 4600
5 2700 2500
Year
Net cash
inflows of
Machine
Alpha
Cumulative
cash inflows
Net cash
inflows of
Machine
Beta
Cumulative
cash
inflows
1 4500 4500 3000 3000
2 4000 8500 3000 6000
3 3000 11500 4400 10400
4 3500 15000 4600 15000
5 2700 17700 2500 17500
Initial investment 1200 1200
Payback period 1 1
Payback period 1 year 1 year
Accounting rate of return
Year
Net cash
inflows of
Machine
Alpha
Net cash
inflows of
Machine
Beta
1 4500 3000
2 4000 3000
3 3000 4400
4 3500 4600
5 2700 2500
⊘ This is a preview!⊘
Do you want full access?
Subscribe today to unlock all pages.
Trusted by 1+ million students worldwide
1 out of 17
Related Documents


Your All-in-One AI-Powered Toolkit for Academic Success.
+13062052269
info@desklib.com
Available 24*7 on WhatsApp / Email
![[object Object]](/_next/static/media/star-bottom.7253800d.svg)
Unlock your academic potential
Copyright © 2020–2026 A2Z Services. All Rights Reserved. Developed and managed by ZUCOL.