Financial Management Report: Cost of Capital, Valuation, and Debt
VerifiedAdded on 2020/06/06
|13
|3222
|69
Report
AI Summary
This report delves into key aspects of financial management, commencing with an exploration of methods for estimating the cost of capital, including the weighted average cost of capital (WACC), cost of debt, and cost of equity using the CAPM model. The report then transitions into business valuation methods, discussing the discounted cash flow (DCF) model and price-earnings ratio, while also addressing the limitations and issues associated with each approach. The DCF model is applied to forecast cash flows, and the report calculates the intrinsic value of shares. Finally, the report examines the evaluation of senior secured debt in relation to overall sources of finance, providing a comprehensive analysis of the financial health and valuation of a firm.

FINANCIAL MANAGEMENT FOR
ORGANISATIONS
ORGANISATIONS
Paraphrase This Document
Need a fresh take? Get an instant paraphrase of this document with our AI Paraphraser

TABLE OF CONTENTS
INTRODUCTION...........................................................................................................................1
Methods of estimating cost of capital..............................................................................................1
Business valuation methods and issues associated with them.........................................................3
Evaluation of senior secured debt in January 2017 in relation to overall source of finance...........8
CONCLUSION................................................................................................................................9
REFERENCES..............................................................................................................................10
LIST OF TABLES
Table 1: Calculation of cost of equity..............................................................................................2
Table 2: Calculation of enterprise value..........................................................................................2
Table 3: Calculation of WACC.......................................................................................................2
Table 4: Computation of cash flows................................................................................................3
Table 5: Percentage growth rate of cash outflow elements.............................................................4
Table 6: Present value of cash flows...............................................................................................4
Table 7: Computation of terminal value..........................................................................................5
Table 8: Equity overall value...........................................................................................................5
Table 9: Intrinsic value calculation..................................................................................................5
Table 10: Price earning ratio............................................................................................................7
Table 11: Calculation of EPS..........................................................................................................7
⊘ This is a preview!⊘
Do you want full access?
Subscribe today to unlock all pages.
Trusted by 1+ million students worldwide
INTRODUCTION
Corporate finance is the one of growing domain on which currently are placing due
attention so as to make accurate business decisions. In the current report, different approaches
are discussed in detail that are related to computation of cost of capital in the business. In middle
part of the report, DCF, earning per share and price earning ratio are computed and issues
associated with these approaches are discussed in detail. At end of the report, secured debt that
firm raised from market is discussed in respect to overall sources of finance.
METHODS OF ESTIMATING COST OF CAPITAL
There are number of methods of estimating cost of capital. It must be noted that cost of
capital is measured in number of ways and there are advantage and disadvantage of all these
methods for the business firms. Some of the methods that can be used to meaure cost of capital
are explained below. Weighted average cost of capital: Weigthed average cost of capital is the one of the
important model of computing cost of capital. Under this method, cost of equity and cost
of debt is computed. Weight is given to debt and equity in the capital structure and cost of
debt and cost of equity is multiplied to weights (Benninga, 2010). Finally, corporate tax
percentage is deducted from relvant value and in this way weighted average cost of
capital is computed. It can be said that weighted average cost of capital is the one of the
important method of computing cost of capital in the business. Cost of debt: In case of cost of debt formula interest rate and corporate tax rate is taken in
to acount. In this approach from one first of all from 1 corporate tax rate is deducted and
relvant value is multiplied byb rate of interest. Finally, computed value is multiplied to
100 and in this way cost of debt is computed. Tax rate is deduced because in case loan is
taken in business it is not necessary to pay tax to the government. Cost of equity: Cost of equity is computed by using CAPM model which is also known
as capital asset pricing model. Under this model beta, market premium and risk free rate
of return is taken in to acount (Baldwin and Von Hippel, 2011). By using this approach
return percentage that must be atleast earned on equity is computed. That percentage is
considerd as cost of equity by the business firms and investors.
1 | P a g e
Paraphrase This Document
Need a fresh take? Get an instant paraphrase of this document with our AI Paraphraser
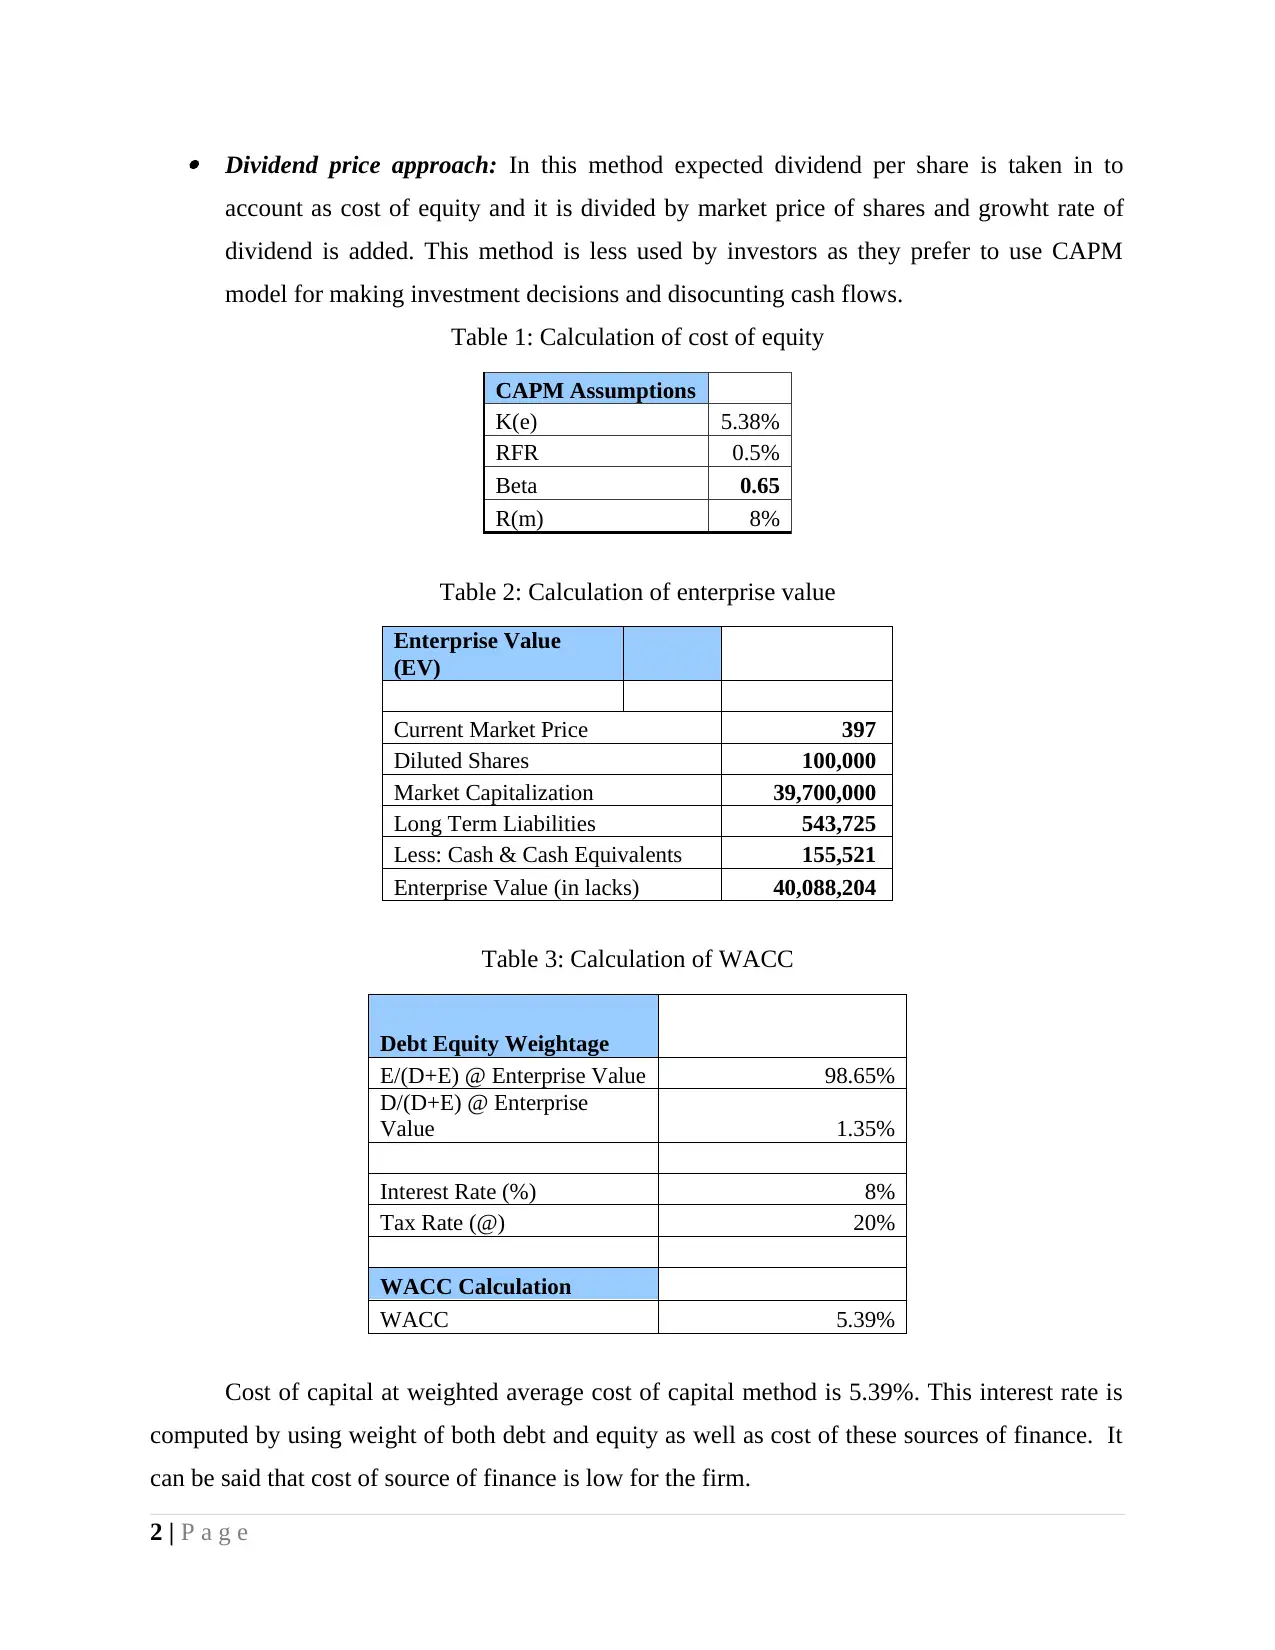
Dividend price approach: In this method expected dividend per share is taken in to
account as cost of equity and it is divided by market price of shares and growht rate of
dividend is added. This method is less used by investors as they prefer to use CAPM
model for making investment decisions and disocunting cash flows.
Table 1: Calculation of cost of equity
CAPM Assumptions
K(e) 5.38%
RFR 0.5%
Beta 0.65
R(m) 8%
Table 2: Calculation of enterprise value
Enterprise Value
(EV)
Current Market Price 397
Diluted Shares 100,000
Market Capitalization 39,700,000
Long Term Liabilities 543,725
Less: Cash & Cash Equivalents 155,521
Enterprise Value (in lacks) 40,088,204
Table 3: Calculation of WACC
Debt Equity Weightage
E/(D+E) @ Enterprise Value 98.65%
D/(D+E) @ Enterprise
Value 1.35%
Interest Rate (%) 8%
Tax Rate (@) 20%
WACC Calculation
WACC 5.39%
Cost of capital at weighted average cost of capital method is 5.39%. This interest rate is
computed by using weight of both debt and equity as well as cost of these sources of finance. It
can be said that cost of source of finance is low for the firm.
2 | P a g e
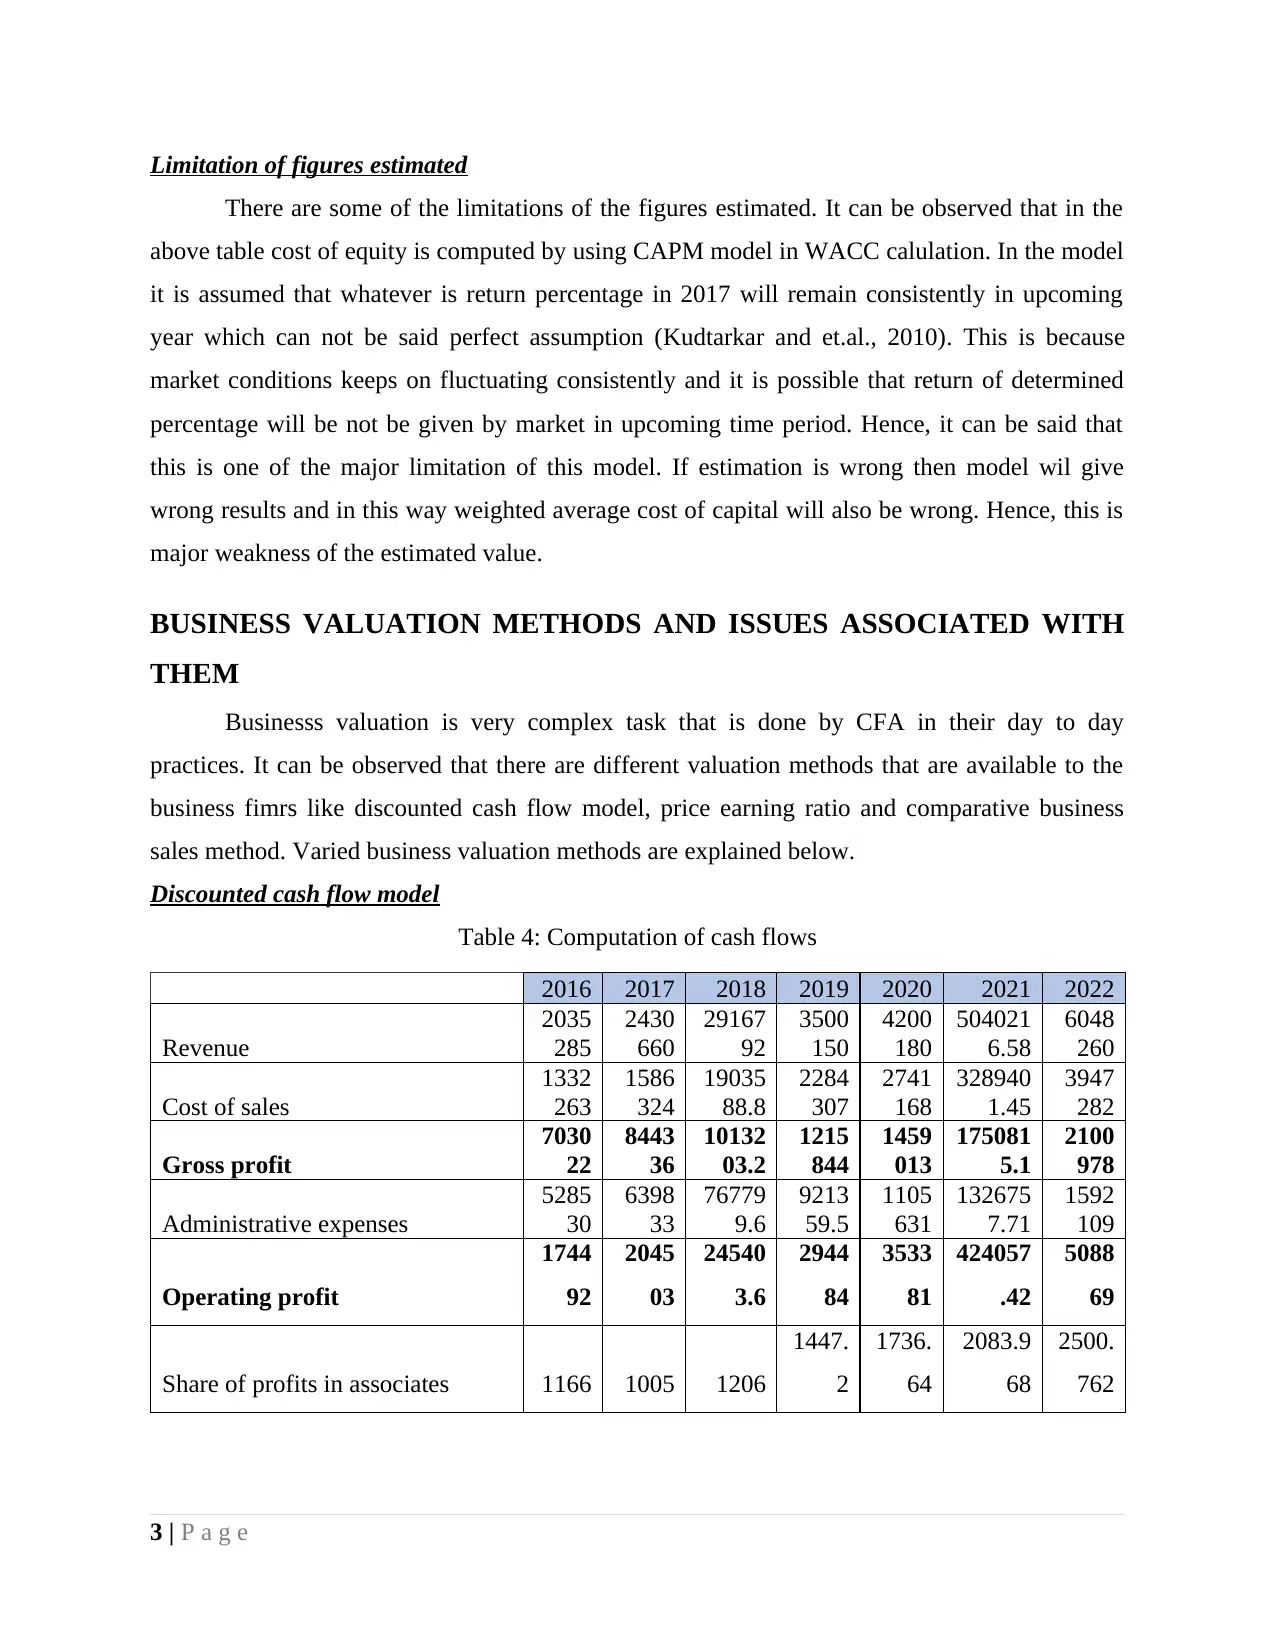
Limitation of figures estimated
There are some of the limitations of the figures estimated. It can be observed that in the
above table cost of equity is computed by using CAPM model in WACC calulation. In the model
it is assumed that whatever is return percentage in 2017 will remain consistently in upcoming
year which can not be said perfect assumption (Kudtarkar and et.al., 2010). This is because
market conditions keeps on fluctuating consistently and it is possible that return of determined
percentage will be not be given by market in upcoming time period. Hence, it can be said that
this is one of the major limitation of this model. If estimation is wrong then model wil give
wrong results and in this way weighted average cost of capital will also be wrong. Hence, this is
major weakness of the estimated value.
BUSINESS VALUATION METHODS AND ISSUES ASSOCIATED WITH
THEM
Businesss valuation is very complex task that is done by CFA in their day to day
practices. It can be observed that there are different valuation methods that are available to the
business fimrs like discounted cash flow model, price earning ratio and comparative business
sales method. Varied business valuation methods are explained below.
Discounted cash flow model
Table 4: Computation of cash flows
2016 2017 2018 2019 2020 2021 2022
Revenue
2035
285
2430
660
29167
92
3500
150
4200
180
504021
6.58
6048
260
Cost of sales
1332
263
1586
324
19035
88.8
2284
307
2741
168
328940
1.45
3947
282
Gross profit
7030
22
8443
36
10132
03.2
1215
844
1459
013
175081
5.1
2100
978
Administrative expenses
5285
30
6398
33
76779
9.6
9213
59.5
1105
631
132675
7.71
1592
109
Operating profit
1744
92
2045
03
24540
3.6
2944
84
3533
81
424057
.42
5088
69
Share of profits in associates 1166 1005 1206
1447.
2
1736.
64
2083.9
68
2500.
762
3 | P a g e
⊘ This is a preview!⊘
Do you want full access?
Subscribe today to unlock all pages.
Trusted by 1+ million students worldwide
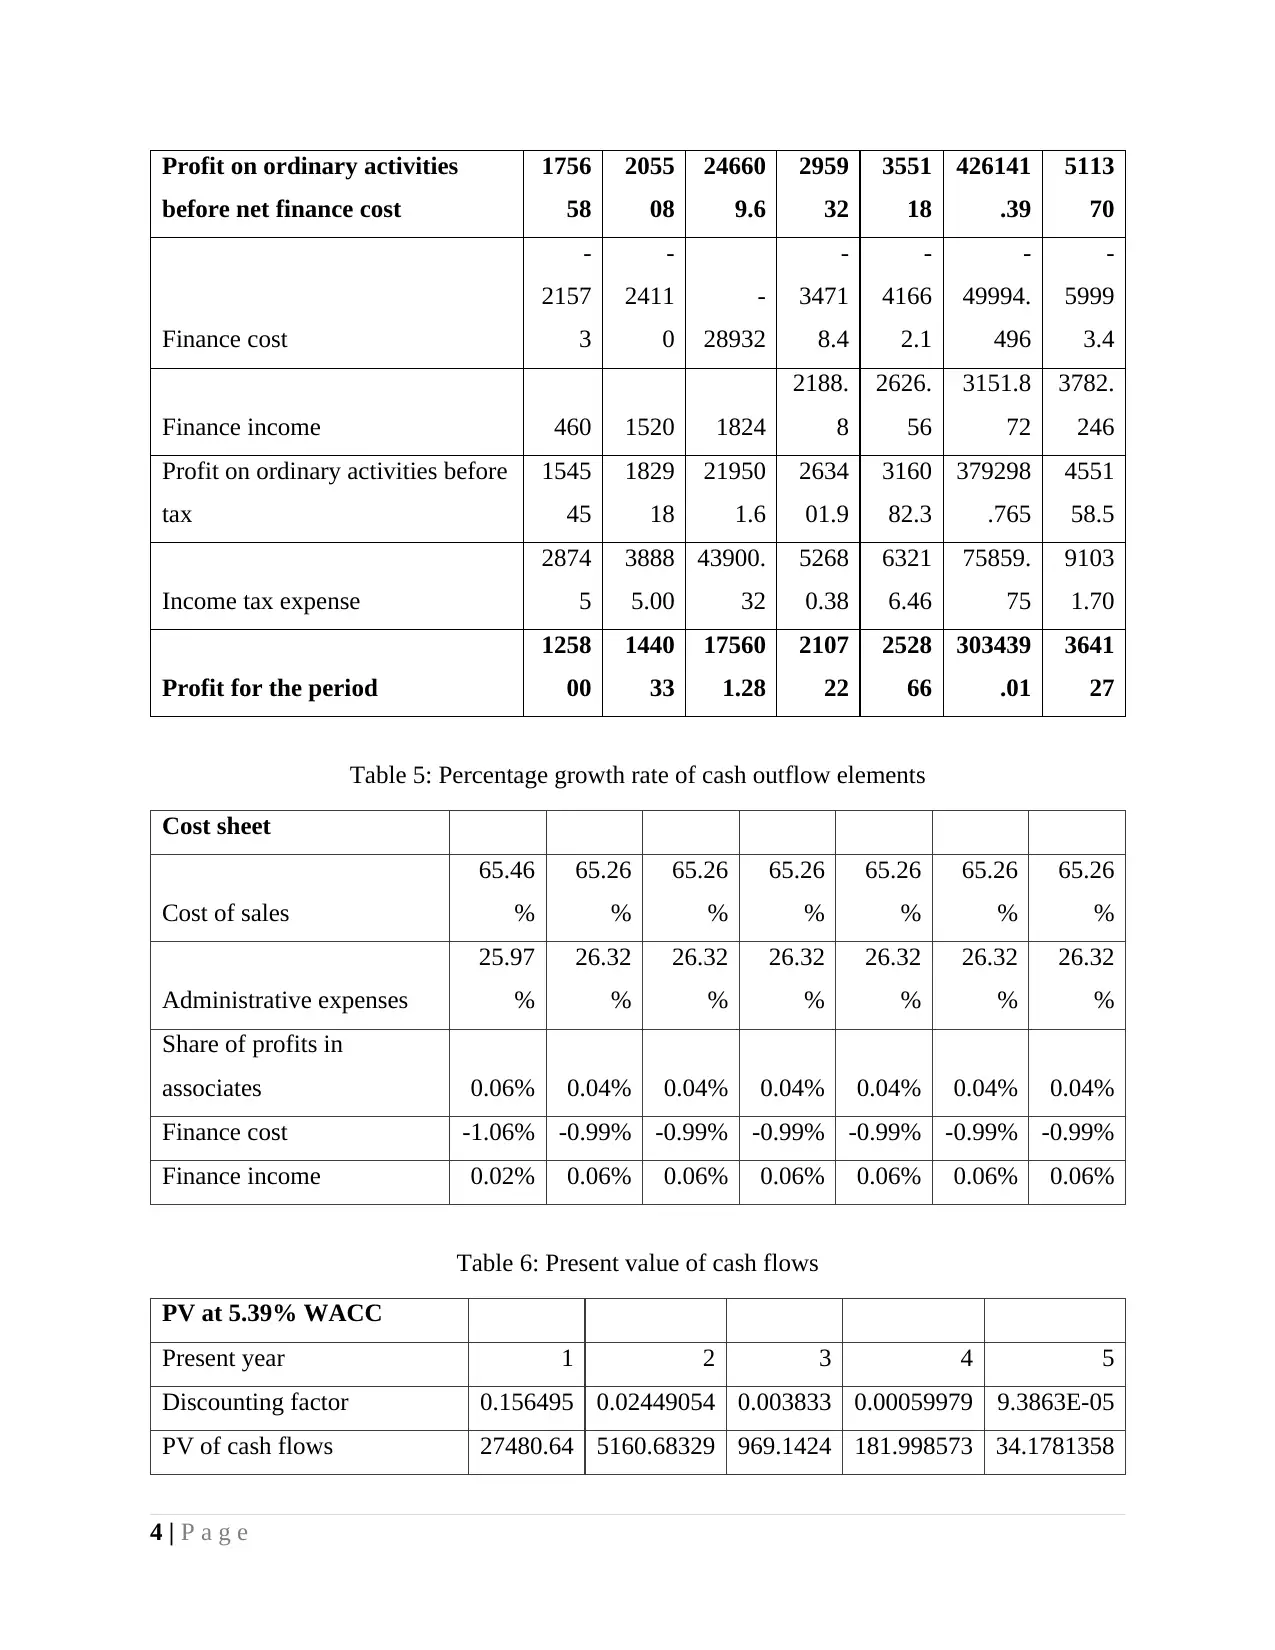
Profit on ordinary activities
before net finance cost
1756
58
2055
08
24660
9.6
2959
32
3551
18
426141
.39
5113
70
Finance cost
-
2157
3
-
2411
0
-
28932
-
3471
8.4
-
4166
2.1
-
49994.
496
-
5999
3.4
Finance income 460 1520 1824
2188.
8
2626.
56
3151.8
72
3782.
246
Profit on ordinary activities before
tax
1545
45
1829
18
21950
1.6
2634
01.9
3160
82.3
379298
.765
4551
58.5
Income tax expense
2874
5
3888
5.00
43900.
32
5268
0.38
6321
6.46
75859.
75
9103
1.70
Profit for the period
1258
00
1440
33
17560
1.28
2107
22
2528
66
303439
.01
3641
27
Table 5: Percentage growth rate of cash outflow elements
Cost sheet
Cost of sales
65.46
%
65.26
%
65.26
%
65.26
%
65.26
%
65.26
%
65.26
%
Administrative expenses
25.97
%
26.32
%
26.32
%
26.32
%
26.32
%
26.32
%
26.32
%
Share of profits in
associates 0.06% 0.04% 0.04% 0.04% 0.04% 0.04% 0.04%
Finance cost -1.06% -0.99% -0.99% -0.99% -0.99% -0.99% -0.99%
Finance income 0.02% 0.06% 0.06% 0.06% 0.06% 0.06% 0.06%
Table 6: Present value of cash flows
PV at 5.39% WACC
Present year 1 2 3 4 5
Discounting factor 0.156495 0.02449054 0.003833 0.00059979 9.3863E-05
PV of cash flows 27480.64 5160.68329 969.1424 181.998573 34.1781358
4 | P a g e
Paraphrase This Document
Need a fresh take? Get an instant paraphrase of this document with our AI Paraphraser
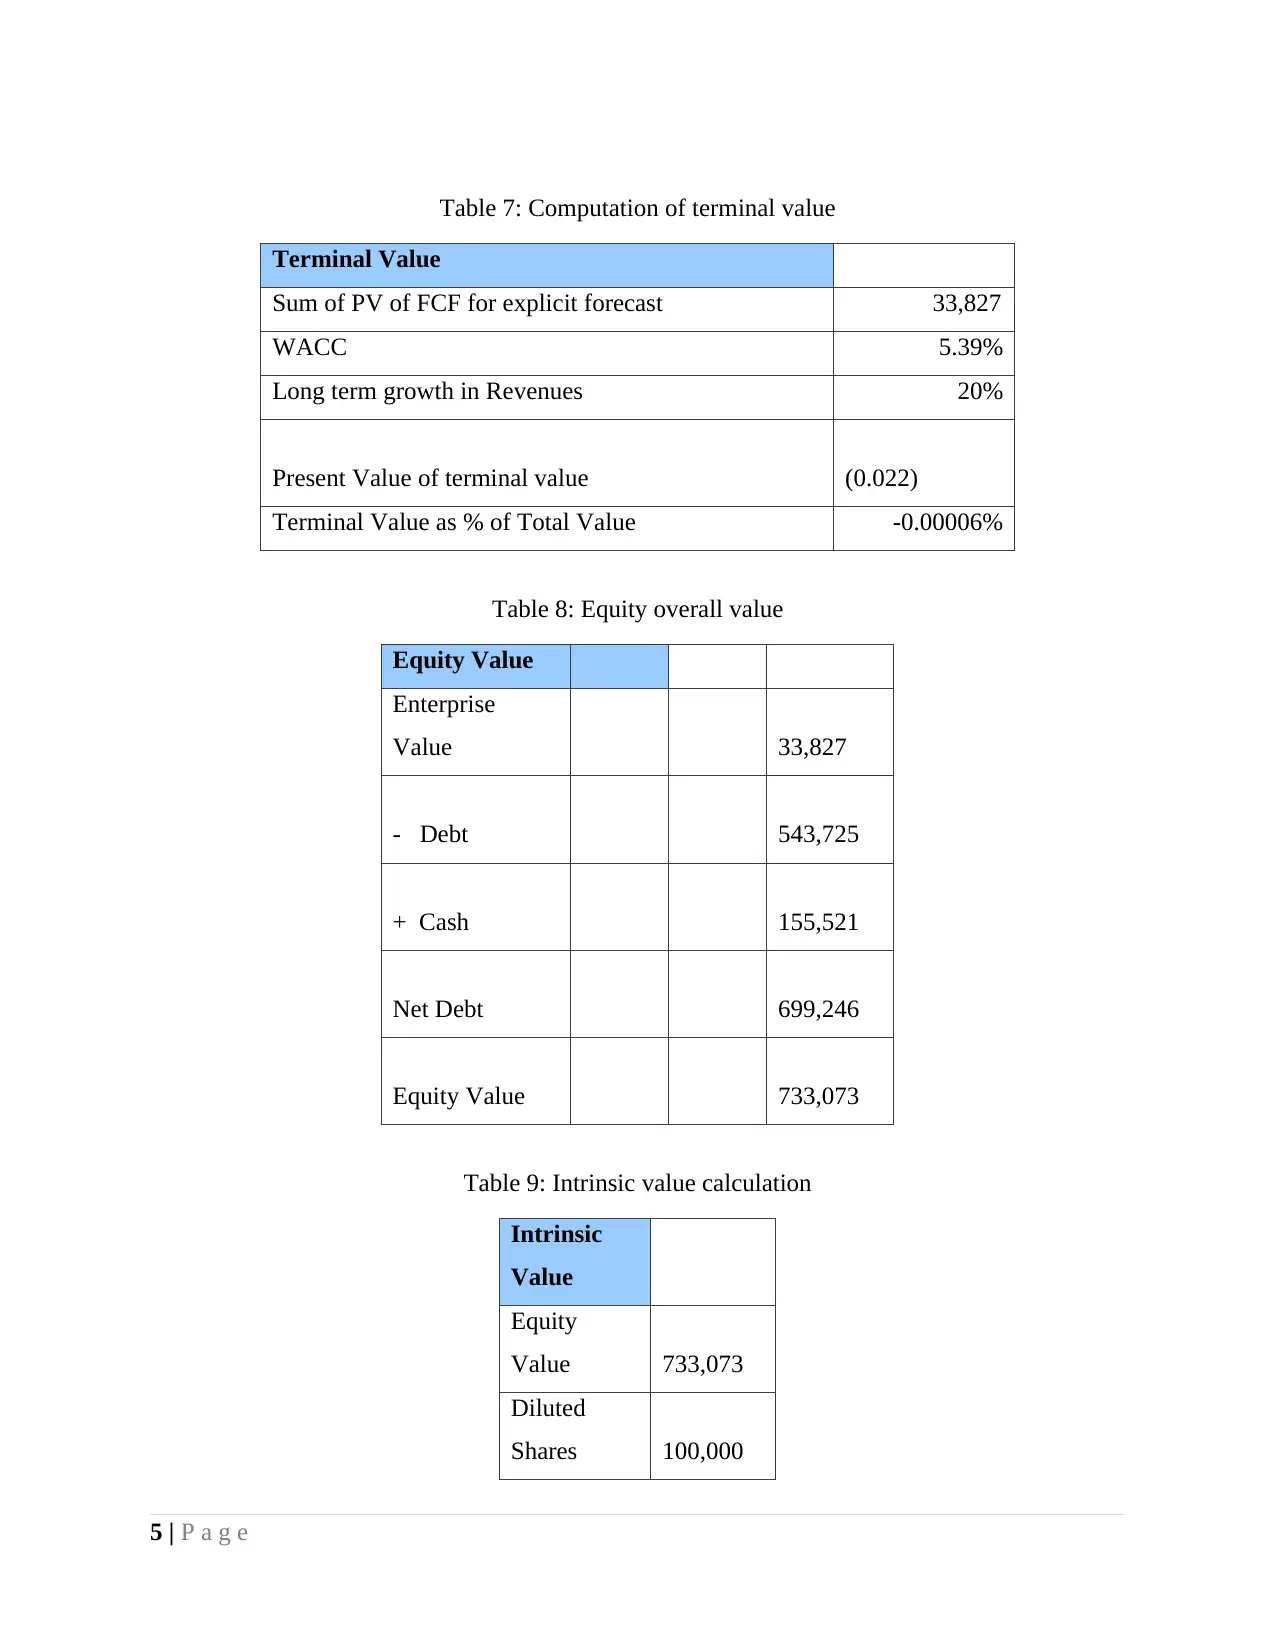
Table 7: Computation of terminal value
Terminal Value
Sum of PV of FCF for explicit forecast 33,827
WACC 5.39%
Long term growth in Revenues 20%
Present Value of terminal value (0.022)
Terminal Value as % of Total Value -0.00006%
Table 8: Equity overall value
Equity Value
Enterprise
Value 33,827
- Debt 543,725
+ Cash 155,521
Net Debt 699,246
Equity Value 733,073
Table 9: Intrinsic value calculation
Intrinsic
Value
Equity
Value 733,073
Diluted
Shares 100,000
5 | P a g e
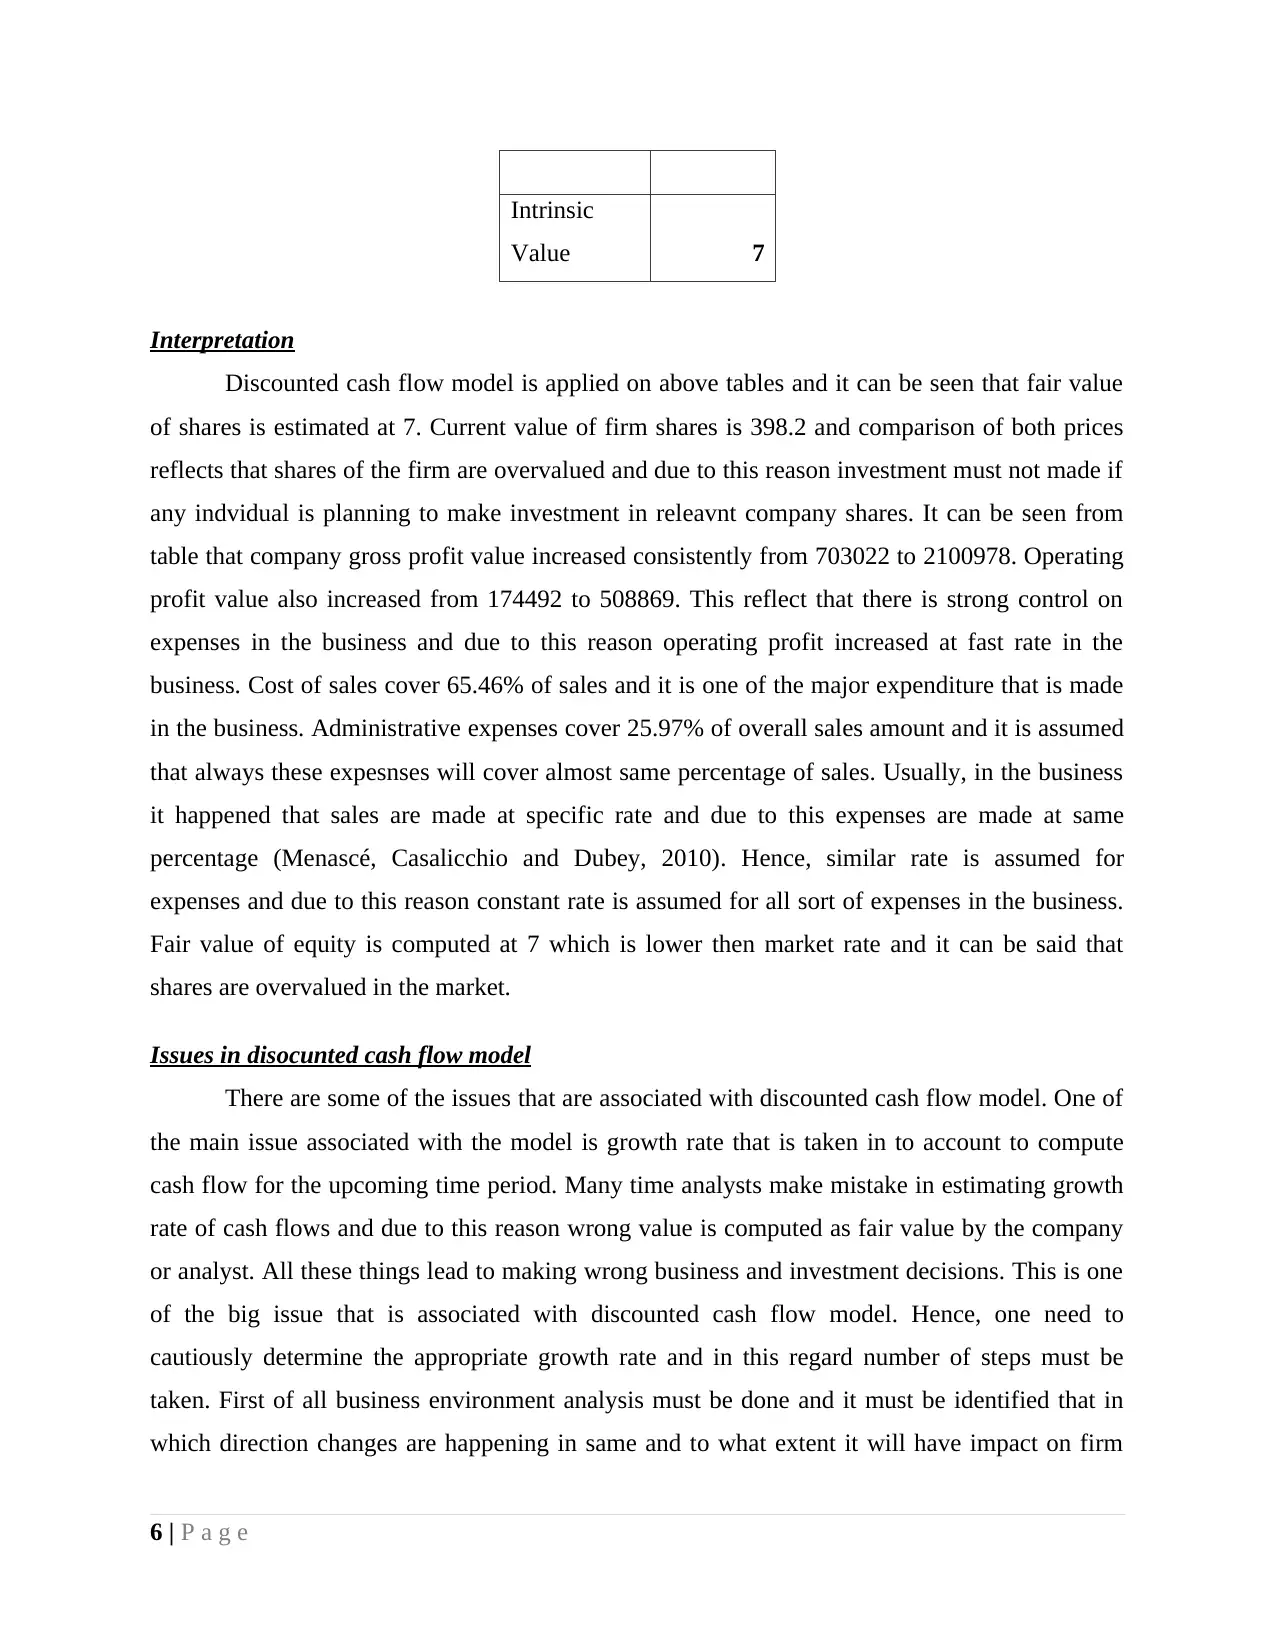
Intrinsic
Value 7
Interpretation
Discounted cash flow model is applied on above tables and it can be seen that fair value
of shares is estimated at 7. Current value of firm shares is 398.2 and comparison of both prices
reflects that shares of the firm are overvalued and due to this reason investment must not made if
any indvidual is planning to make investment in releavnt company shares. It can be seen from
table that company gross profit value increased consistently from 703022 to 2100978. Operating
profit value also increased from 174492 to 508869. This reflect that there is strong control on
expenses in the business and due to this reason operating profit increased at fast rate in the
business. Cost of sales cover 65.46% of sales and it is one of the major expenditure that is made
in the business. Administrative expenses cover 25.97% of overall sales amount and it is assumed
that always these expesnses will cover almost same percentage of sales. Usually, in the business
it happened that sales are made at specific rate and due to this expenses are made at same
percentage (Menascé, Casalicchio and Dubey, 2010). Hence, similar rate is assumed for
expenses and due to this reason constant rate is assumed for all sort of expenses in the business.
Fair value of equity is computed at 7 which is lower then market rate and it can be said that
shares are overvalued in the market.
Issues in disocunted cash flow model
There are some of the issues that are associated with discounted cash flow model. One of
the main issue associated with the model is growth rate that is taken in to account to compute
cash flow for the upcoming time period. Many time analysts make mistake in estimating growth
rate of cash flows and due to this reason wrong value is computed as fair value by the company
or analyst. All these things lead to making wrong business and investment decisions. This is one
of the big issue that is associated with discounted cash flow model. Hence, one need to
cautiously determine the appropriate growth rate and in this regard number of steps must be
taken. First of all business environment analysis must be done and it must be identified that in
which direction changes are happening in same and to what extent it will have impact on firm
6 | P a g e
⊘ This is a preview!⊘
Do you want full access?
Subscribe today to unlock all pages.
Trusted by 1+ million students worldwide
profitability (Healy and Palepu, 2012). In this regard, different years cash flows must be taken in
to acount and also information of business environment. By doing so it can be identified that
what appropriate growth rate may be for projecting cash flows. In this way one of the big issue
that is associated with discounted cash flow model can be solved. Apart from this number of
other approaches and tools can be used to solve this problem. In this regard, analytics can be
used by the firm at its workplace and by using same esimation can be made about cash flows in
proper manner.
Price earning ratio
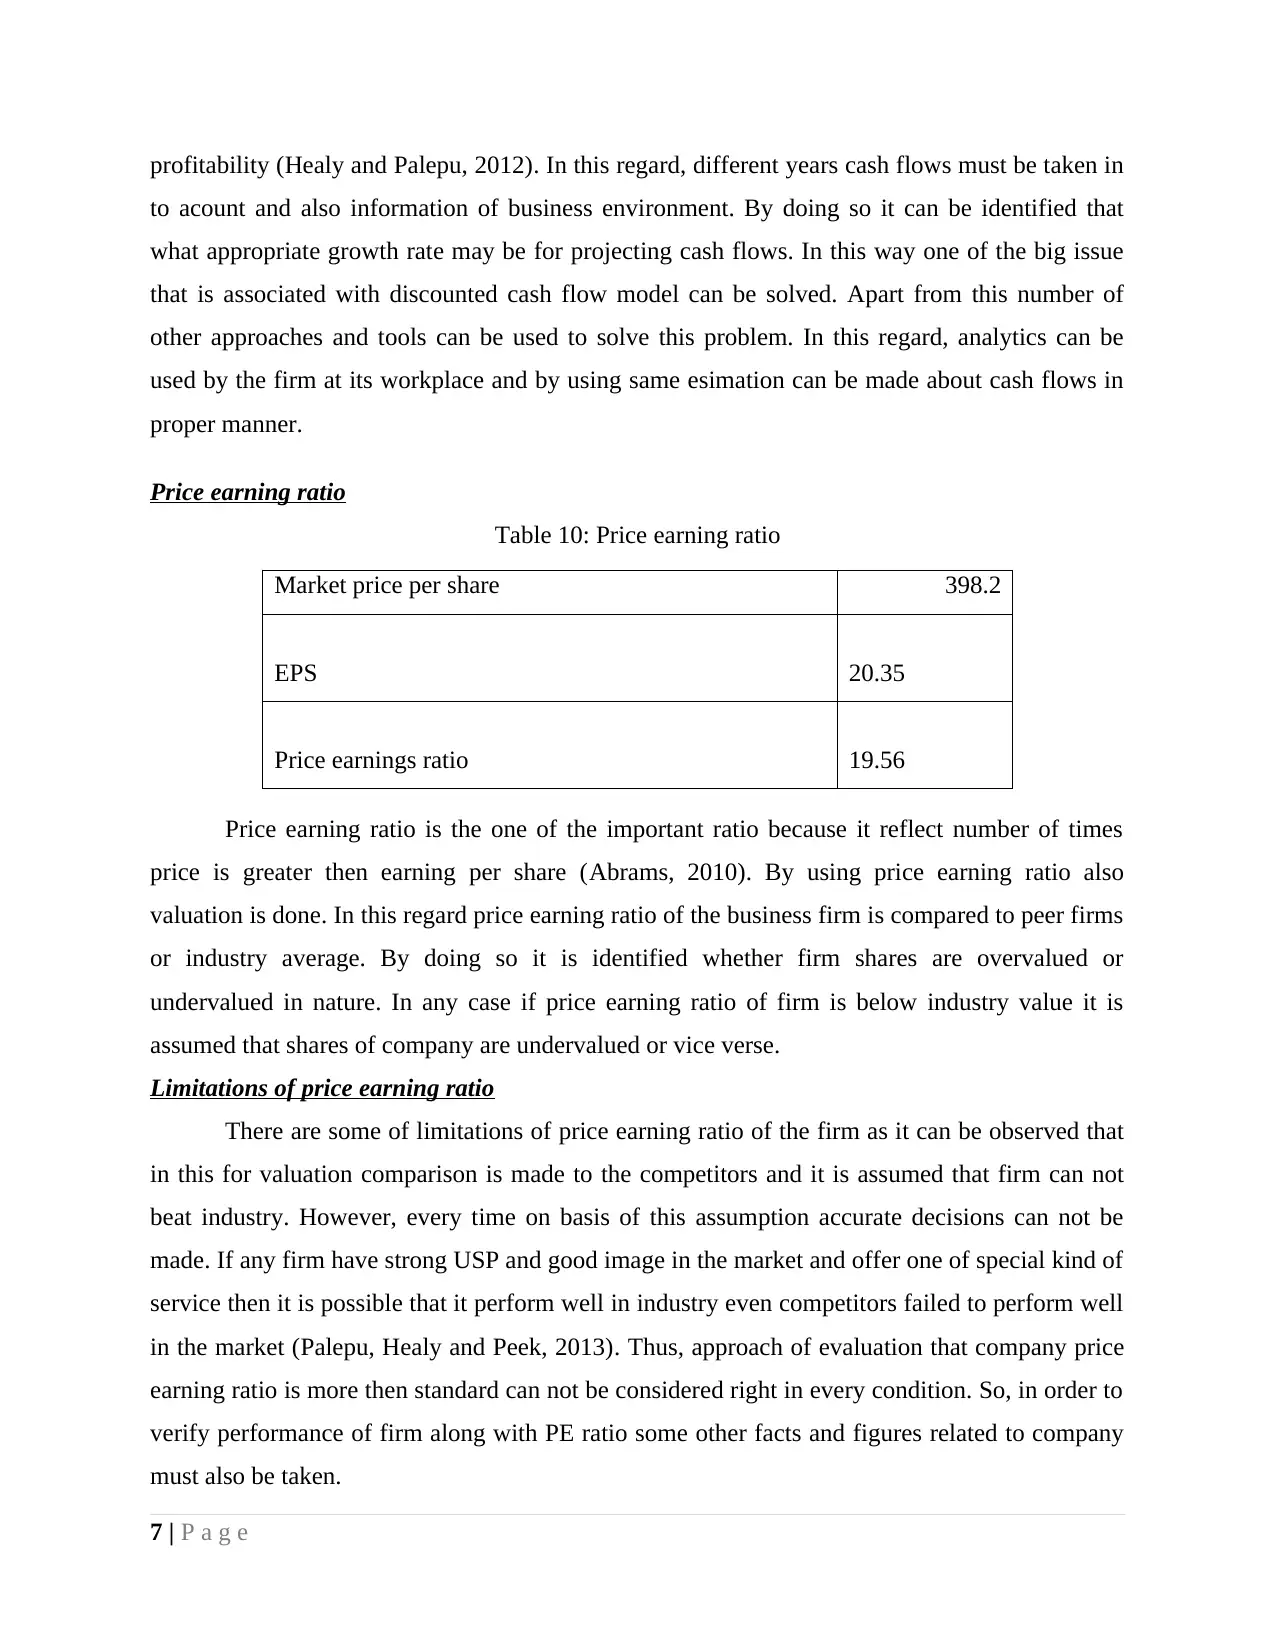
Table 10: Price earning ratio
Market price per share 398.2
EPS 20.35
Price earnings ratio 19.56
Price earning ratio is the one of the important ratio because it reflect number of times
price is greater then earning per share (Abrams, 2010). By using price earning ratio also
valuation is done. In this regard price earning ratio of the business firm is compared to peer firms
or industry average. By doing so it is identified whether firm shares are overvalued or
undervalued in nature. In any case if price earning ratio of firm is below industry value it is
assumed that shares of company are undervalued or vice verse.
Limitations of price earning ratio
There are some of limitations of price earning ratio of the firm as it can be observed that
in this for valuation comparison is made to the competitors and it is assumed that firm can not
beat industry. However, every time on basis of this assumption accurate decisions can not be
made. If any firm have strong USP and good image in the market and offer one of special kind of
service then it is possible that it perform well in industry even competitors failed to perform well
in the market (Palepu, Healy and Peek, 2013). Thus, approach of evaluation that company price
earning ratio is more then standard can not be considered right in every condition. So, in order to
verify performance of firm along with PE ratio some other facts and figures related to company
must also be taken.
7 | P a g e
to acount and also information of business environment. By doing so it can be identified that
what appropriate growth rate may be for projecting cash flows. In this way one of the big issue
that is associated with discounted cash flow model can be solved. Apart from this number of
other approaches and tools can be used to solve this problem. In this regard, analytics can be
used by the firm at its workplace and by using same esimation can be made about cash flows in
proper manner.
Price earning ratio
Table 10: Price earning ratio
Market price per share 398.2
EPS 20.35
Price earnings ratio 19.56
Price earning ratio is the one of the important ratio because it reflect number of times
price is greater then earning per share (Abrams, 2010). By using price earning ratio also
valuation is done. In this regard price earning ratio of the business firm is compared to peer firms
or industry average. By doing so it is identified whether firm shares are overvalued or
undervalued in nature. In any case if price earning ratio of firm is below industry value it is
assumed that shares of company are undervalued or vice verse.
Limitations of price earning ratio
There are some of limitations of price earning ratio of the firm as it can be observed that
in this for valuation comparison is made to the competitors and it is assumed that firm can not
beat industry. However, every time on basis of this assumption accurate decisions can not be
made. If any firm have strong USP and good image in the market and offer one of special kind of
service then it is possible that it perform well in industry even competitors failed to perform well
in the market (Palepu, Healy and Peek, 2013). Thus, approach of evaluation that company price
earning ratio is more then standard can not be considered right in every condition. So, in order to
verify performance of firm along with PE ratio some other facts and figures related to company
must also be taken.
7 | P a g e
Paraphrase This Document
Need a fresh take? Get an instant paraphrase of this document with our AI Paraphraser
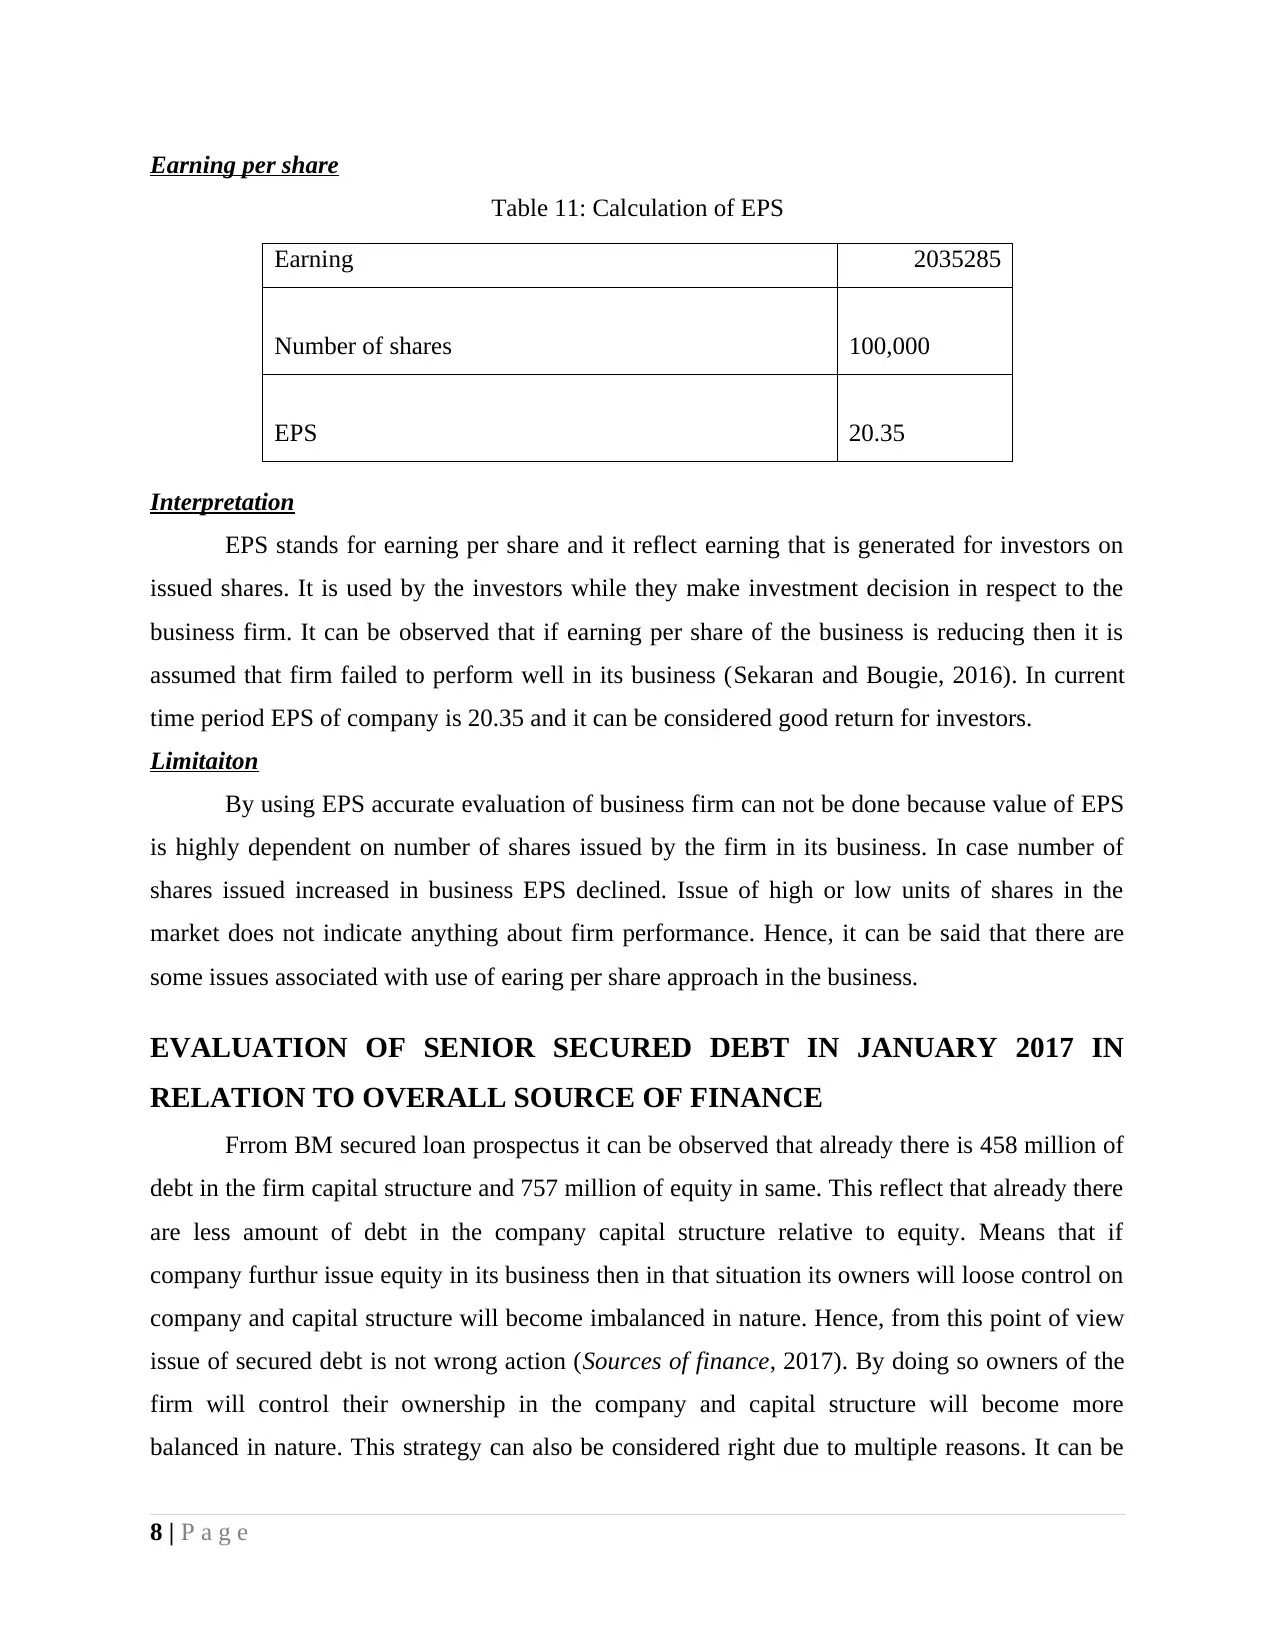
Earning per share
Table 11: Calculation of EPS
Earning 2035285
Number of shares 100,000
EPS 20.35
Interpretation
EPS stands for earning per share and it reflect earning that is generated for investors on
issued shares. It is used by the investors while they make investment decision in respect to the
business firm. It can be observed that if earning per share of the business is reducing then it is
assumed that firm failed to perform well in its business (Sekaran and Bougie, 2016). In current
time period EPS of company is 20.35 and it can be considered good return for investors.
Limitaiton
By using EPS accurate evaluation of business firm can not be done because value of EPS
is highly dependent on number of shares issued by the firm in its business. In case number of
shares issued increased in business EPS declined. Issue of high or low units of shares in the
market does not indicate anything about firm performance. Hence, it can be said that there are
some issues associated with use of earing per share approach in the business.
EVALUATION OF SENIOR SECURED DEBT IN JANUARY 2017 IN
RELATION TO OVERALL SOURCE OF FINANCE
Frrom BM secured loan prospectus it can be observed that already there is 458 million of
debt in the firm capital structure and 757 million of equity in same. This reflect that already there
are less amount of debt in the company capital structure relative to equity. Means that if
company furthur issue equity in its business then in that situation its owners will loose control on
company and capital structure will become imbalanced in nature. Hence, from this point of view
issue of secured debt is not wrong action (Sources of finance, 2017). By doing so owners of the
firm will control their ownership in the company and capital structure will become more
balanced in nature. This strategy can also be considered right due to multiple reasons. It can be
8 | P a g e
observed that firm fund its operations through number of sources of finance like Put/Call
options, shares and through short term loan. Locking deal through call and put option is very
risky. Profit and loss are observed in millions in case of this source of finance. In comparison to
this bank loan is safe side as company already know about its debt payment liability in advance
and accordingly it prepare plan in its business. On other hand, in case of call and put options it is
not possible to make such kind of plans and due to this reason risk of failure or loss in business
are very high and payment liability may also increase suddenly. Hence, by considering this
source of finance it can be said that senior secured debt is the one of the best source of finance in
respect to overall source of finance. Receivables, trade payables and lease are also sources of
finance that are available in the firm capital structure (Criteria for evaluating different sources of
finance available to a business, 2017). These sources of finance can not be used for long term
and can not be used consistently in the business to fund business. Hence, it can be said that firm
decision to issue senior secured debt in January 2017 is correct and it will ensure that firm is able
to make effective use of varied sources of finance in its business. Issue of debt security will also
make capital structure more balanced then before and due to this reason it can be said that senior
secured debt is the one of best choice relative to overall source of finance.
CONCLUSION
On the basis of above discussion it is concluded that there is signficent importance of
business valuation methods because by using same business value can be measure that must be
in market. However, there are some of the limitations of each of the busines valuation approach
and due to this reason after considering number of factors specific approach of business
valuation must be used by the firm. It is also concluded that there are varied approaches of
computing cost of capital but weigthed average cost of capital is one of the best approach to do
equity valuation.
9 | P a g e
⊘ This is a preview!⊘
Do you want full access?
Subscribe today to unlock all pages.
Trusted by 1+ million students worldwide
1 out of 13
Related Documents


Your All-in-One AI-Powered Toolkit for Academic Success.
+13062052269
info@desklib.com
Available 24*7 on WhatsApp / Email
![[object Object]](/_next/static/media/star-bottom.7253800d.svg)
Unlock your academic potential
Copyright © 2020–2026 A2Z Services. All Rights Reserved. Developed and managed by ZUCOL.