Financial Analysis Report: UK Carved Wooden Ornaments Venture, Year 1
VerifiedAdded on 2020/06/05
|28
|6272
|102
Report
AI Summary
This report provides a detailed financial analysis of a carved wooden ornament business venture in the UK. It encompasses various aspects of financial management, including a summary of assumptions, break-even analysis, profit and loss statements, balance sheets, monthly and annual cash flow statements, and sensitivity analysis. The report also addresses the initial cash requirements for the venture and offers suggestions for managing upfront supplier fees. The analysis is based on the financial data provided, including sales figures, cost estimations, and investment details. The report concludes with a reflection on the analysis and recommendations for the business's financial strategy, including a breakdown of fixed and variable costs, and a discussion of factors affecting the break-even point and profitability.

FINANCIAL
MANAGEMENT
MANAGEMENT
Paraphrase This Document
Need a fresh take? Get an instant paraphrase of this document with our AI Paraphraser
TABLE OF CONTENTS
INTRODUCTION...........................................................................................................................1
Summary of all the assumptions.................................................................................................1
Break- even analysis...................................................................................................................4
Profit and Loss and Balance sheet statements.............................................................................6
Monthly cash flow for the first year of operation.......................................................................7
Annual Cash Flow Statement ...................................................................................................12
A clear explanation, of how much cash the venture will need to get started............................14
Sensitivity Analysis...................................................................................................................17
Suggestions to pay upfront fees to Clearcut supplier................................................................20
Recommendations.....................................................................................................................21
Reflection of the Analysis.........................................................................................................22
CONCLUSIONS.......................................................................................................................24
REFERENCES..............................................................................................................................25
INTRODUCTION
Financial management refers to the planning organising, directing and controlling of the
monitory resources of the organisation in such a manner that it helps in achieving the goals and
objectives of the organisation. This function is directly associated to the top level management.
Financial activities of the organisation includes utilization and procurement of the organisational
funds. Elements of financial management includes various types of decisions that are -
investment decisions that includes fixed assets known as capital budgeting, investment in current
assets known as working capital; financial decision that includes finance related decisions that
are raised from various resources; dividend decision that includes decision related to the
distribution of net profits. The objectives of financial management are to ensure adequate and
regular supply of funds to the organisation, create wealth for the business, generate cash,
adequate return to the shareholders, optimum utilisation of funds, safety on investments and to
plan a sound capital structure.
Functions of financial management are estimation of capital requirement, to determine
capital structure, choice of sources and investments of funds, distribution of surplus profits, cash
management and financial controls. Management of the organisation need to ensure the
availability of funds at the time of meeting business requirements. Short term requirements of
business includes stock, equipments, cost of sales and employees. Long term need includes
increase in assets.
In the below study accounting for financial management is done for Nancy who is willing
to start her own venture of carved wooden ornaments in UK. She is been retired from services
with an amount of £325000 and is willing to start a new business with this amount. The below
report providing full analysis of its financial activities as per the information provided by her.
The report includes break even analysis, income statement and balance sheet, cash flow
statement for monthly as well as yearly and also the sensitivity analysis of its financial
information.
⊘ This is a preview!⊘
Do you want full access?
Subscribe today to unlock all pages.
Trusted by 1+ million students worldwide
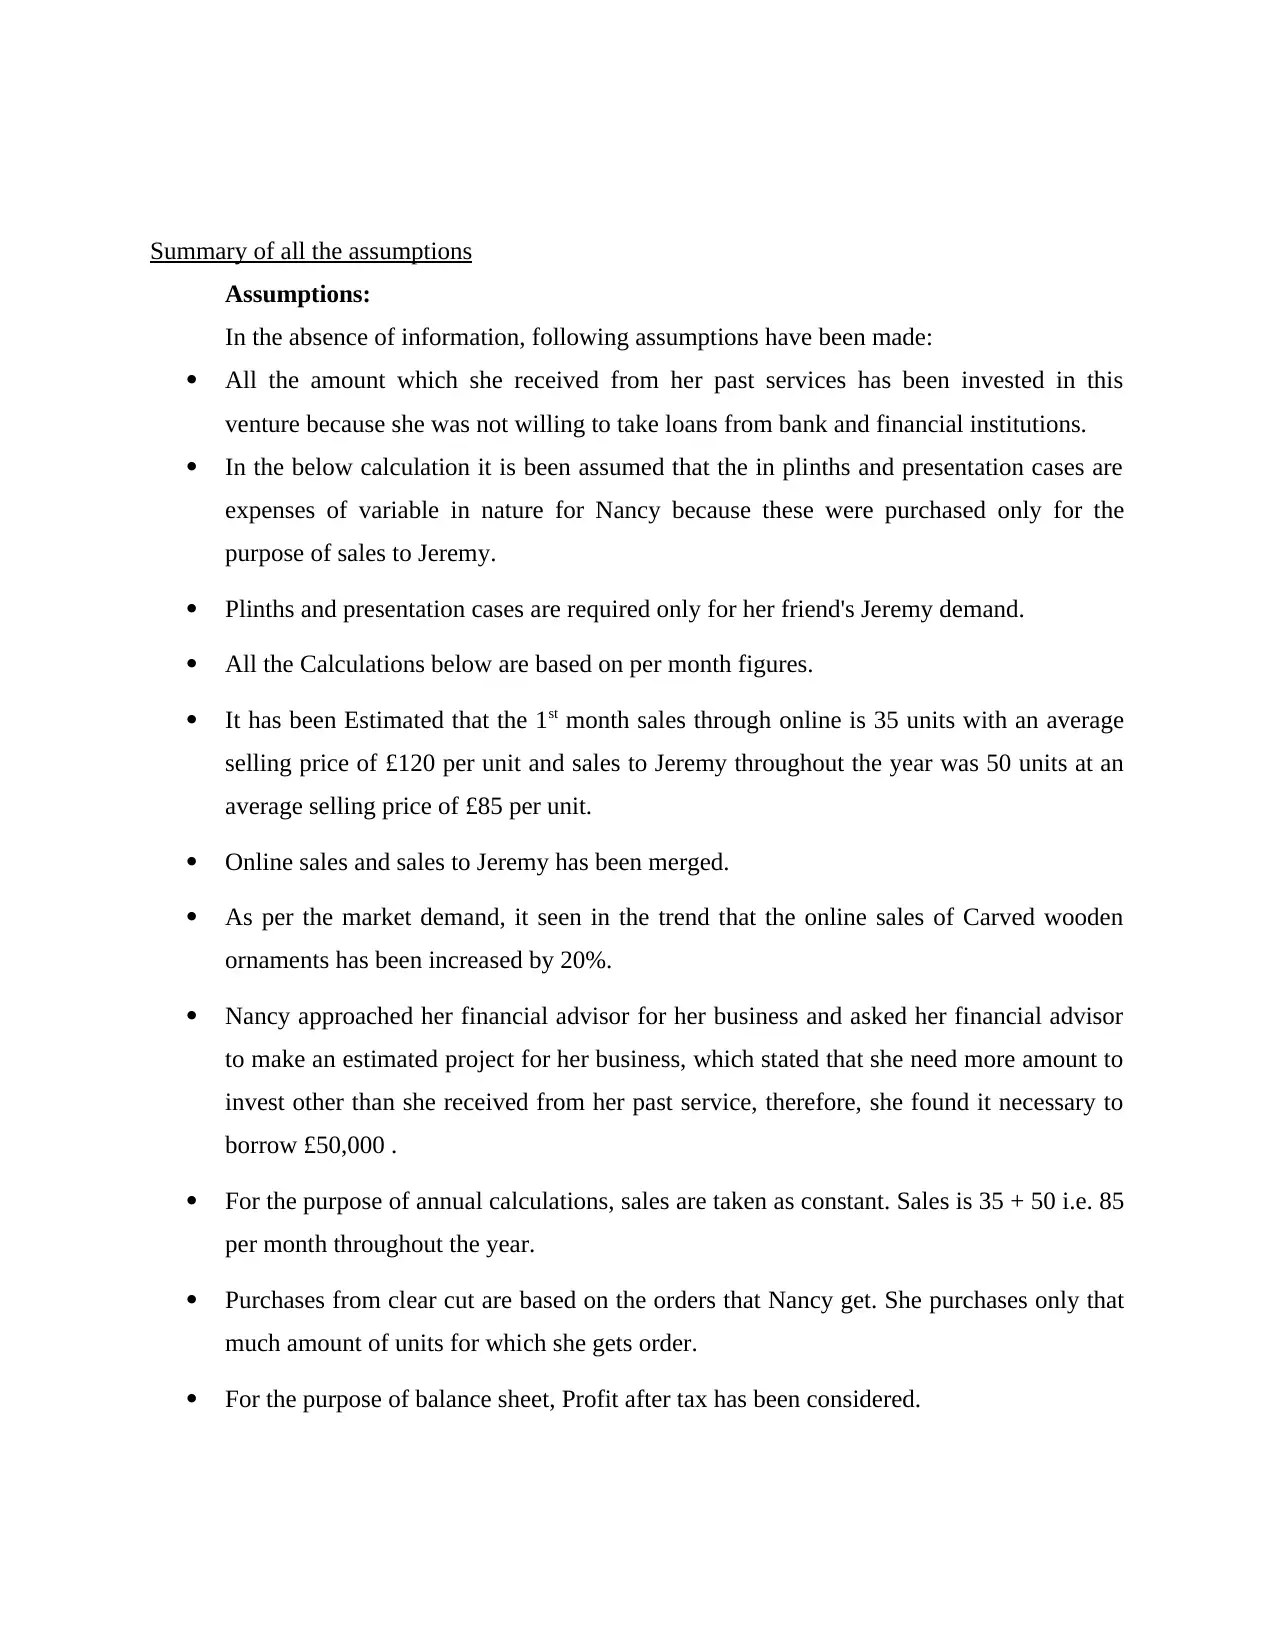
Summary of all the assumptions
Assumptions:
In the absence of information, following assumptions have been made:
All the amount which she received from her past services has been invested in this
venture because she was not willing to take loans from bank and financial institutions.
In the below calculation it is been assumed that the in plinths and presentation cases are
expenses of variable in nature for Nancy because these were purchased only for the
purpose of sales to Jeremy.
Plinths and presentation cases are required only for her friend's Jeremy demand.
All the Calculations below are based on per month figures.
It has been Estimated that the 1st month sales through online is 35 units with an average
selling price of £120 per unit and sales to Jeremy throughout the year was 50 units at an
average selling price of £85 per unit.
Online sales and sales to Jeremy has been merged.
As per the market demand, it seen in the trend that the online sales of Carved wooden
ornaments has been increased by 20%.
Nancy approached her financial advisor for her business and asked her financial advisor
to make an estimated project for her business, which stated that she need more amount to
invest other than she received from her past service, therefore, she found it necessary to
borrow £50,000 .
For the purpose of annual calculations, sales are taken as constant. Sales is 35 + 50 i.e. 85
per month throughout the year.
Purchases from clear cut are based on the orders that Nancy get. She purchases only that
much amount of units for which she gets order.
For the purpose of balance sheet, Profit after tax has been considered.
Paraphrase This Document
Need a fresh take? Get an instant paraphrase of this document with our AI Paraphraser
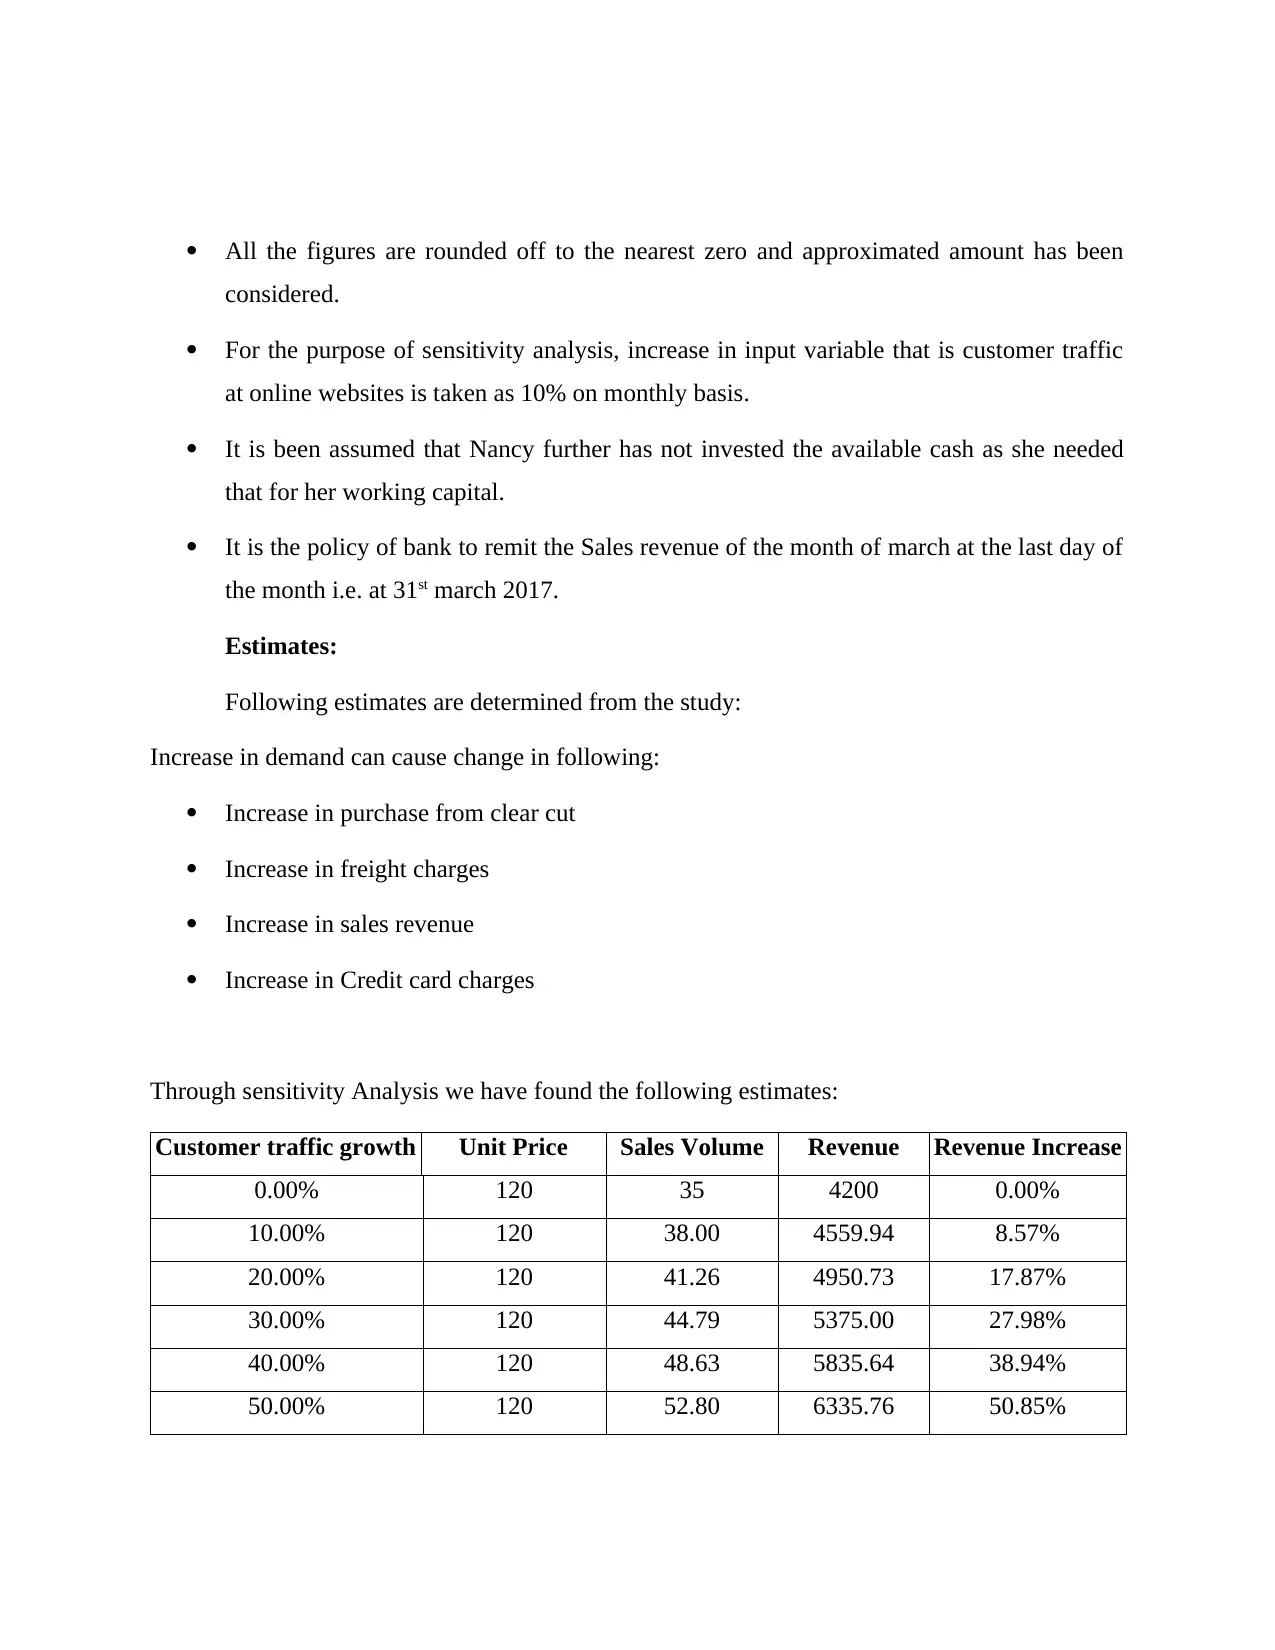
All the figures are rounded off to the nearest zero and approximated amount has been
considered.
For the purpose of sensitivity analysis, increase in input variable that is customer traffic
at online websites is taken as 10% on monthly basis.
It is been assumed that Nancy further has not invested the available cash as she needed
that for her working capital.
It is the policy of bank to remit the Sales revenue of the month of march at the last day of
the month i.e. at 31st march 2017.
Estimates:
Following estimates are determined from the study:
Increase in demand can cause change in following:
Increase in purchase from clear cut
Increase in freight charges
Increase in sales revenue
Increase in Credit card charges
Through sensitivity Analysis we have found the following estimates:
Customer traffic growth Unit Price Sales Volume Revenue Revenue Increase
0.00% 120 35 4200 0.00%
10.00% 120 38.00 4559.94 8.57%
20.00% 120 41.26 4950.73 17.87%
30.00% 120 44.79 5375.00 27.98%
40.00% 120 48.63 5835.64 38.94%
50.00% 120 52.80 6335.76 50.85%
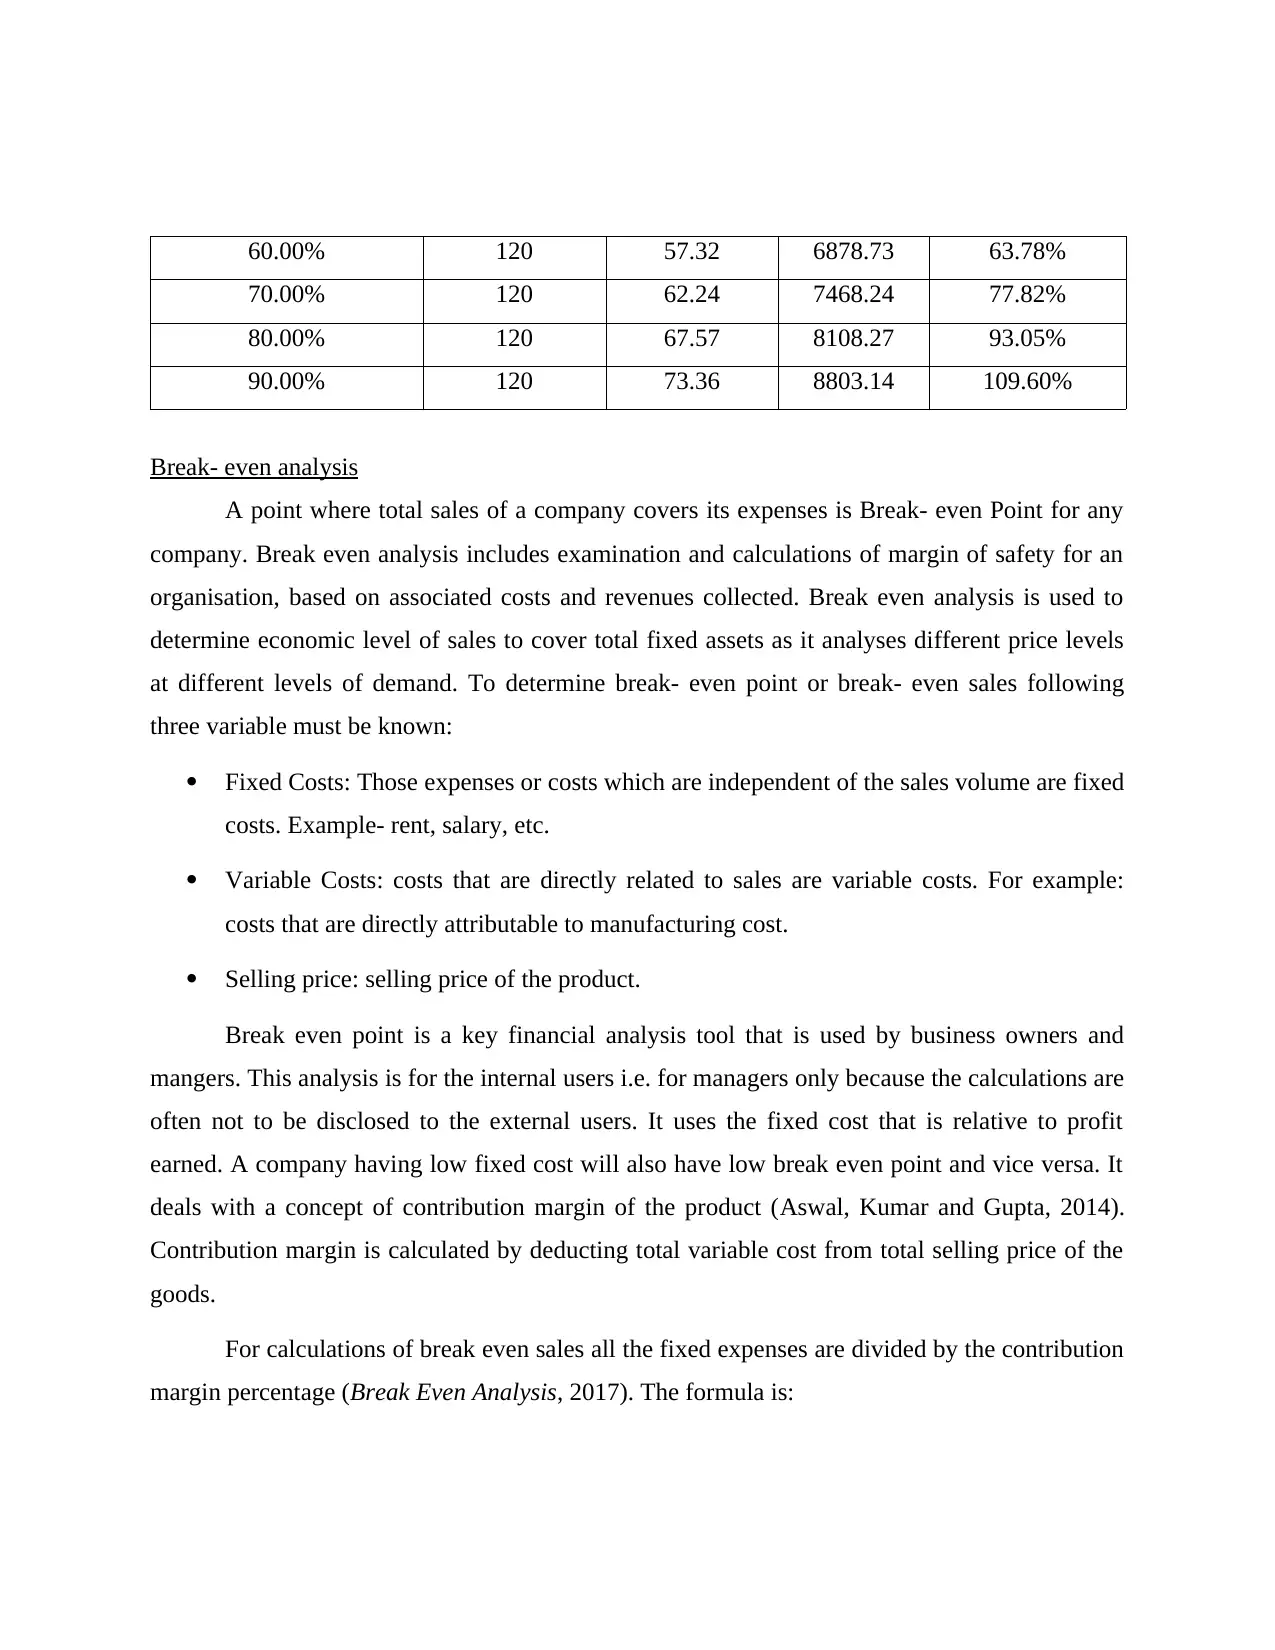
60.00% 120 57.32 6878.73 63.78%
70.00% 120 62.24 7468.24 77.82%
80.00% 120 67.57 8108.27 93.05%
90.00% 120 73.36 8803.14 109.60%
Break- even analysis
A point where total sales of a company covers its expenses is Break- even Point for any
company. Break even analysis includes examination and calculations of margin of safety for an
organisation, based on associated costs and revenues collected. Break even analysis is used to
determine economic level of sales to cover total fixed assets as it analyses different price levels
at different levels of demand. To determine break- even point or break- even sales following
three variable must be known:
Fixed Costs: Those expenses or costs which are independent of the sales volume are fixed
costs. Example- rent, salary, etc.
Variable Costs: costs that are directly related to sales are variable costs. For example:
costs that are directly attributable to manufacturing cost.
Selling price: selling price of the product.
Break even point is a key financial analysis tool that is used by business owners and
mangers. This analysis is for the internal users i.e. for managers only because the calculations are
often not to be disclosed to the external users. It uses the fixed cost that is relative to profit
earned. A company having low fixed cost will also have low break even point and vice versa. It
deals with a concept of contribution margin of the product (Aswal, Kumar and Gupta, 2014).
Contribution margin is calculated by deducting total variable cost from total selling price of the
goods.
For calculations of break even sales all the fixed expenses are divided by the contribution
margin percentage (Break Even Analysis, 2017). The formula is:
⊘ This is a preview!⊘
Do you want full access?
Subscribe today to unlock all pages.
Trusted by 1+ million students worldwide
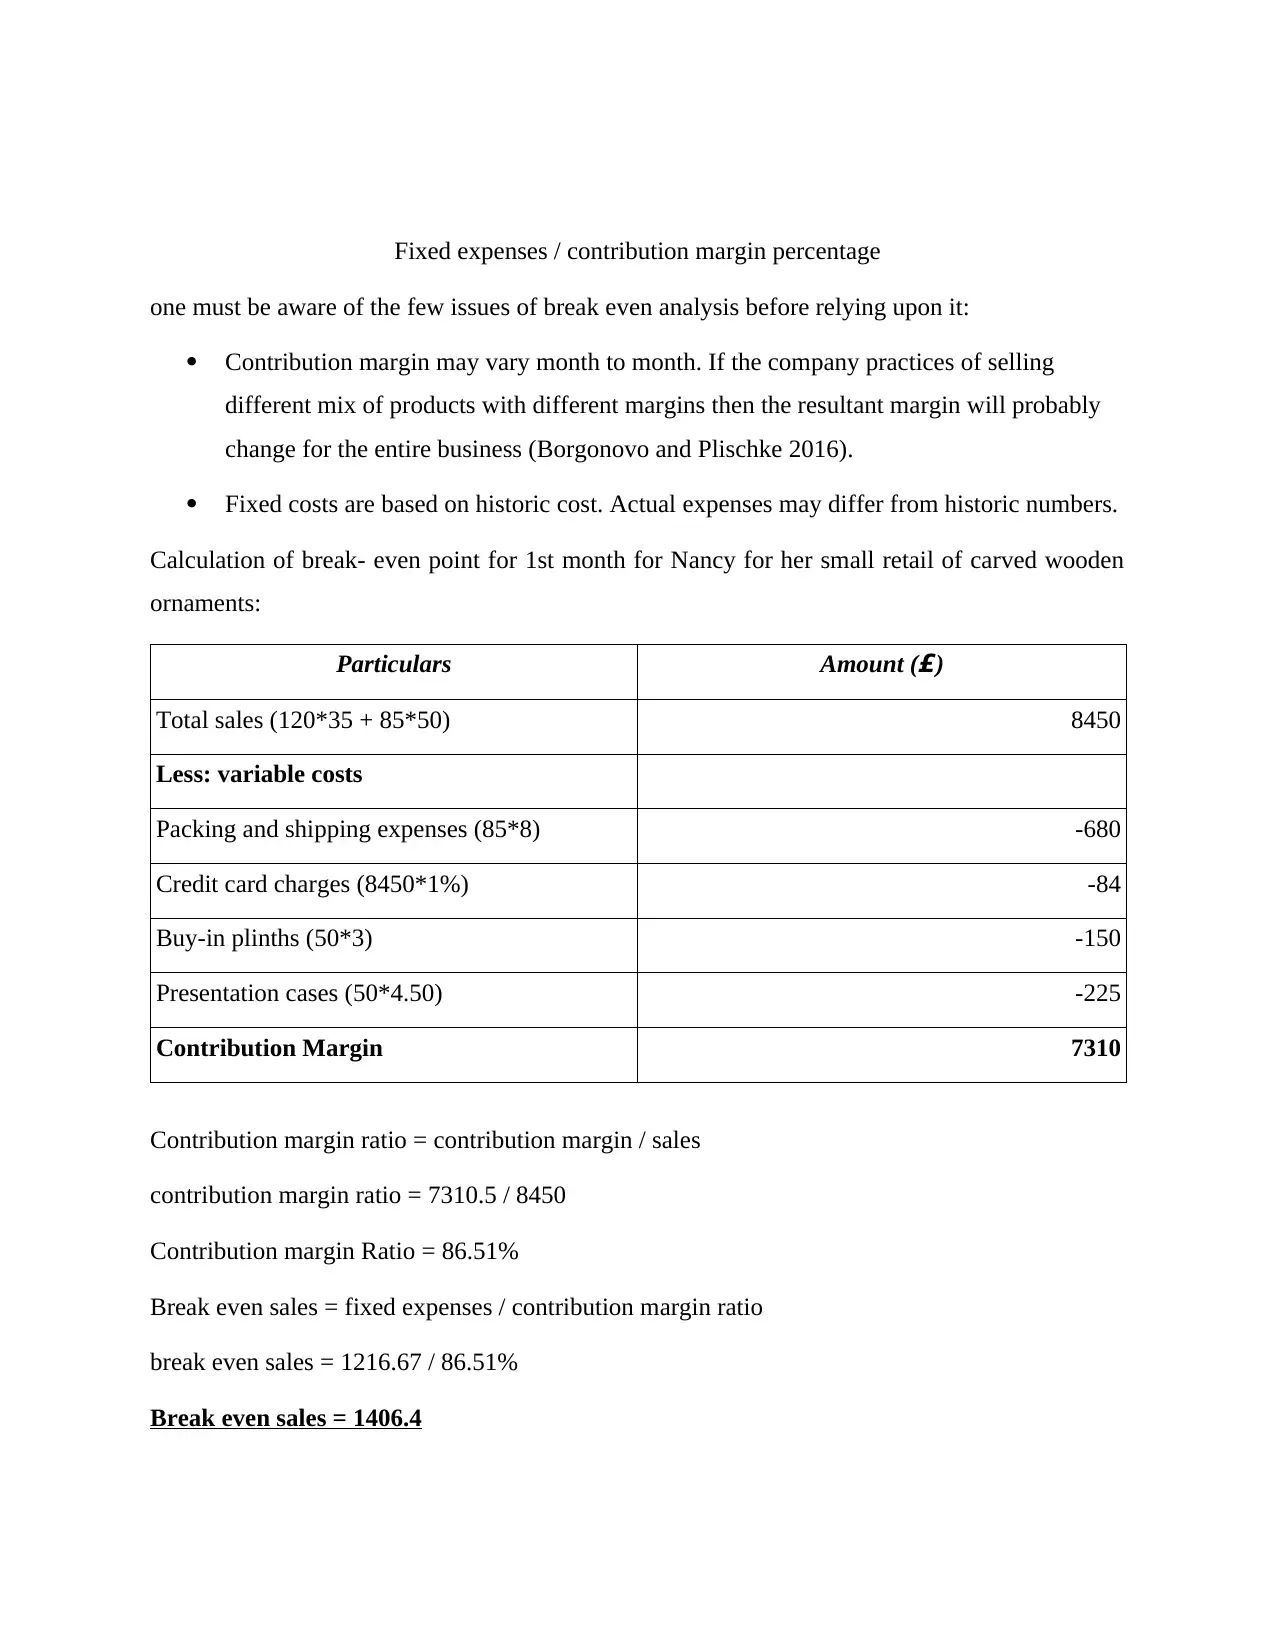
Fixed expenses / contribution margin percentage
one must be aware of the few issues of break even analysis before relying upon it:
Contribution margin may vary month to month. If the company practices of selling
different mix of products with different margins then the resultant margin will probably
change for the entire business (Borgonovo and Plischke 2016).
Fixed costs are based on historic cost. Actual expenses may differ from historic numbers.
Calculation of break- even point for 1st month for Nancy for her small retail of carved wooden
ornaments:
Particulars Amount (£)
Total sales (120*35 + 85*50) 8450
Less: variable costs
Packing and shipping expenses (85*8) -680
Credit card charges (8450*1%) -84
Buy-in plinths (50*3) -150
Presentation cases (50*4.50) -225
Contribution Margin 7310
Contribution margin ratio = contribution margin / sales
contribution margin ratio = 7310.5 / 8450
Contribution margin Ratio = 86.51%
Break even sales = fixed expenses / contribution margin ratio
break even sales = 1216.67 / 86.51%
Break even sales = 1406.4
Paraphrase This Document
Need a fresh take? Get an instant paraphrase of this document with our AI Paraphraser
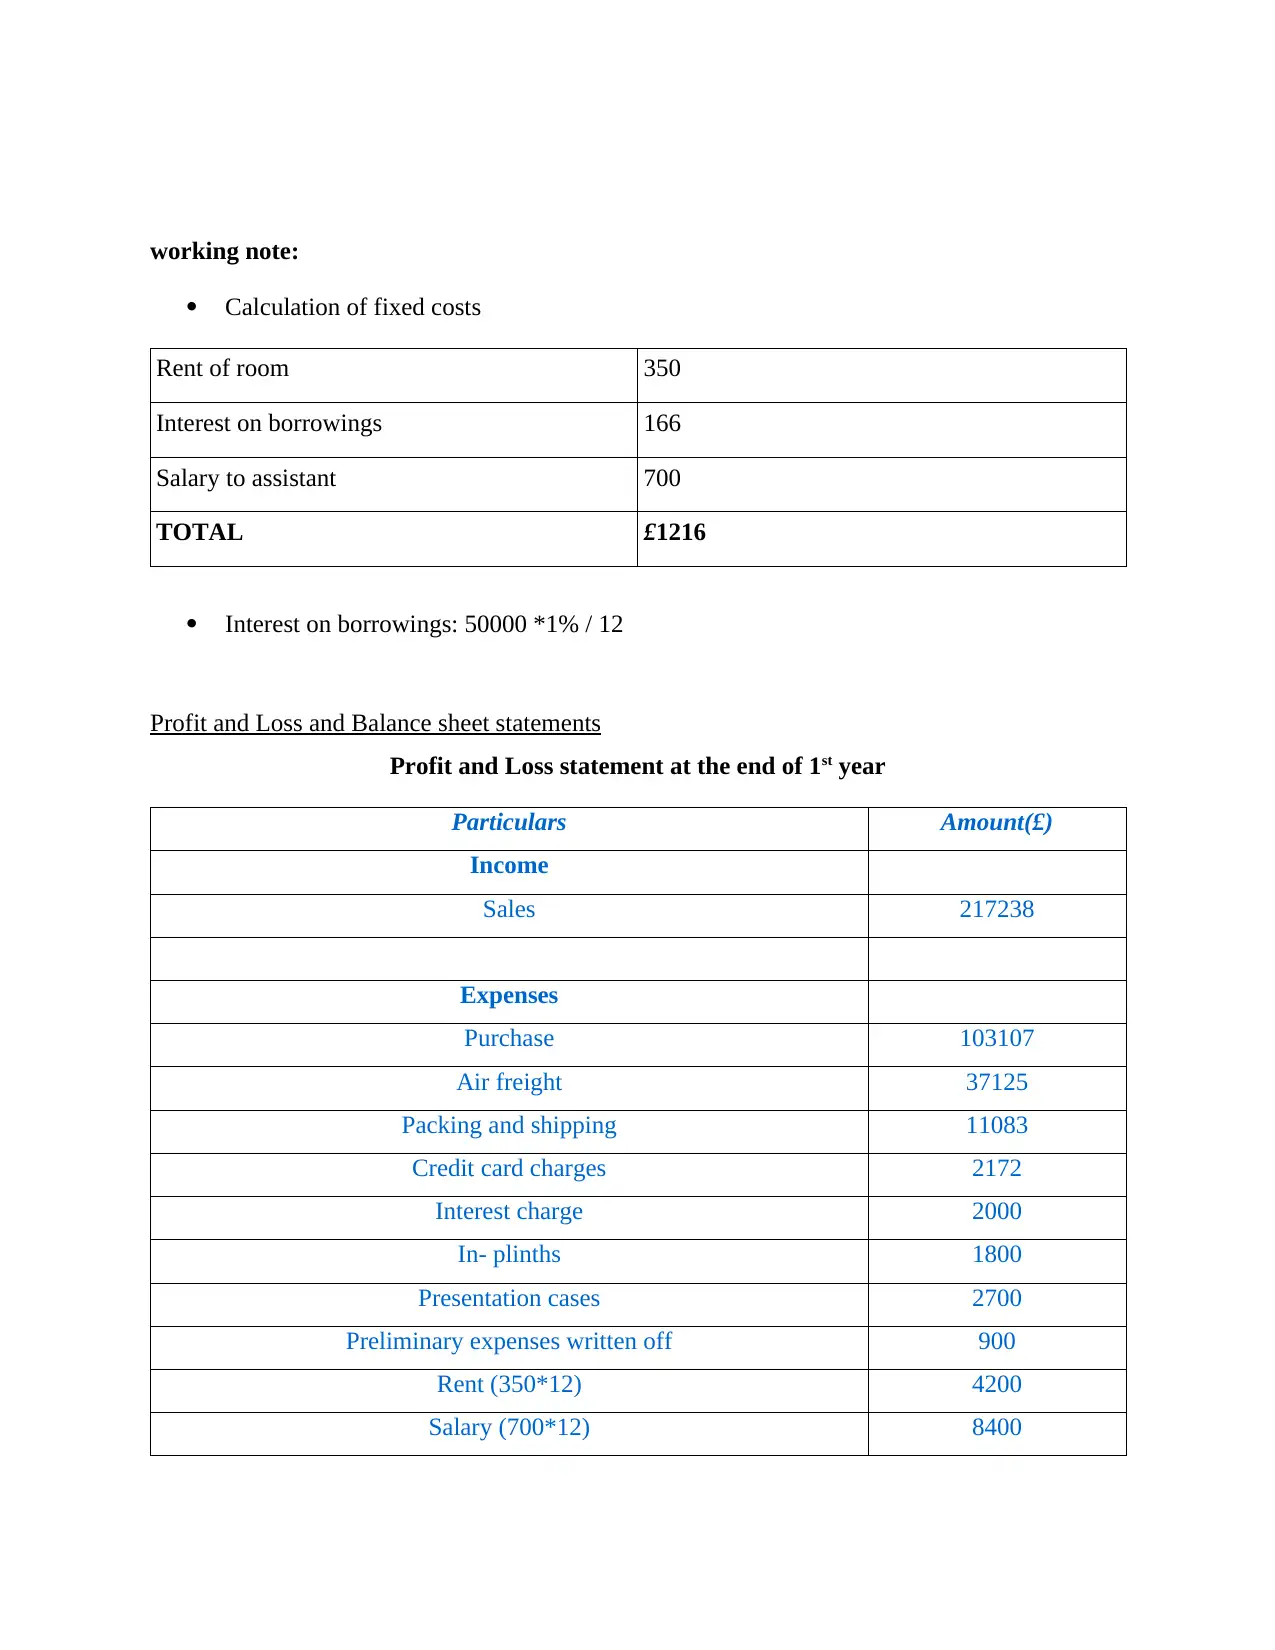
working note:
Calculation of fixed costs
Rent of room 350
Interest on borrowings 166
Salary to assistant 700
TOTAL £1216
Interest on borrowings: 50000 *1% / 12
Profit and Loss and Balance sheet statements
Profit and Loss statement at the end of 1st year
Particulars Amount(£)
Income
Sales 217238
Expenses
Purchase 103107
Air freight 37125
Packing and shipping 11083
Credit card charges 2172
Interest charge 2000
In- plinths 1800
Presentation cases 2700
Preliminary expenses written off 900
Rent (350*12) 4200
Salary (700*12) 8400
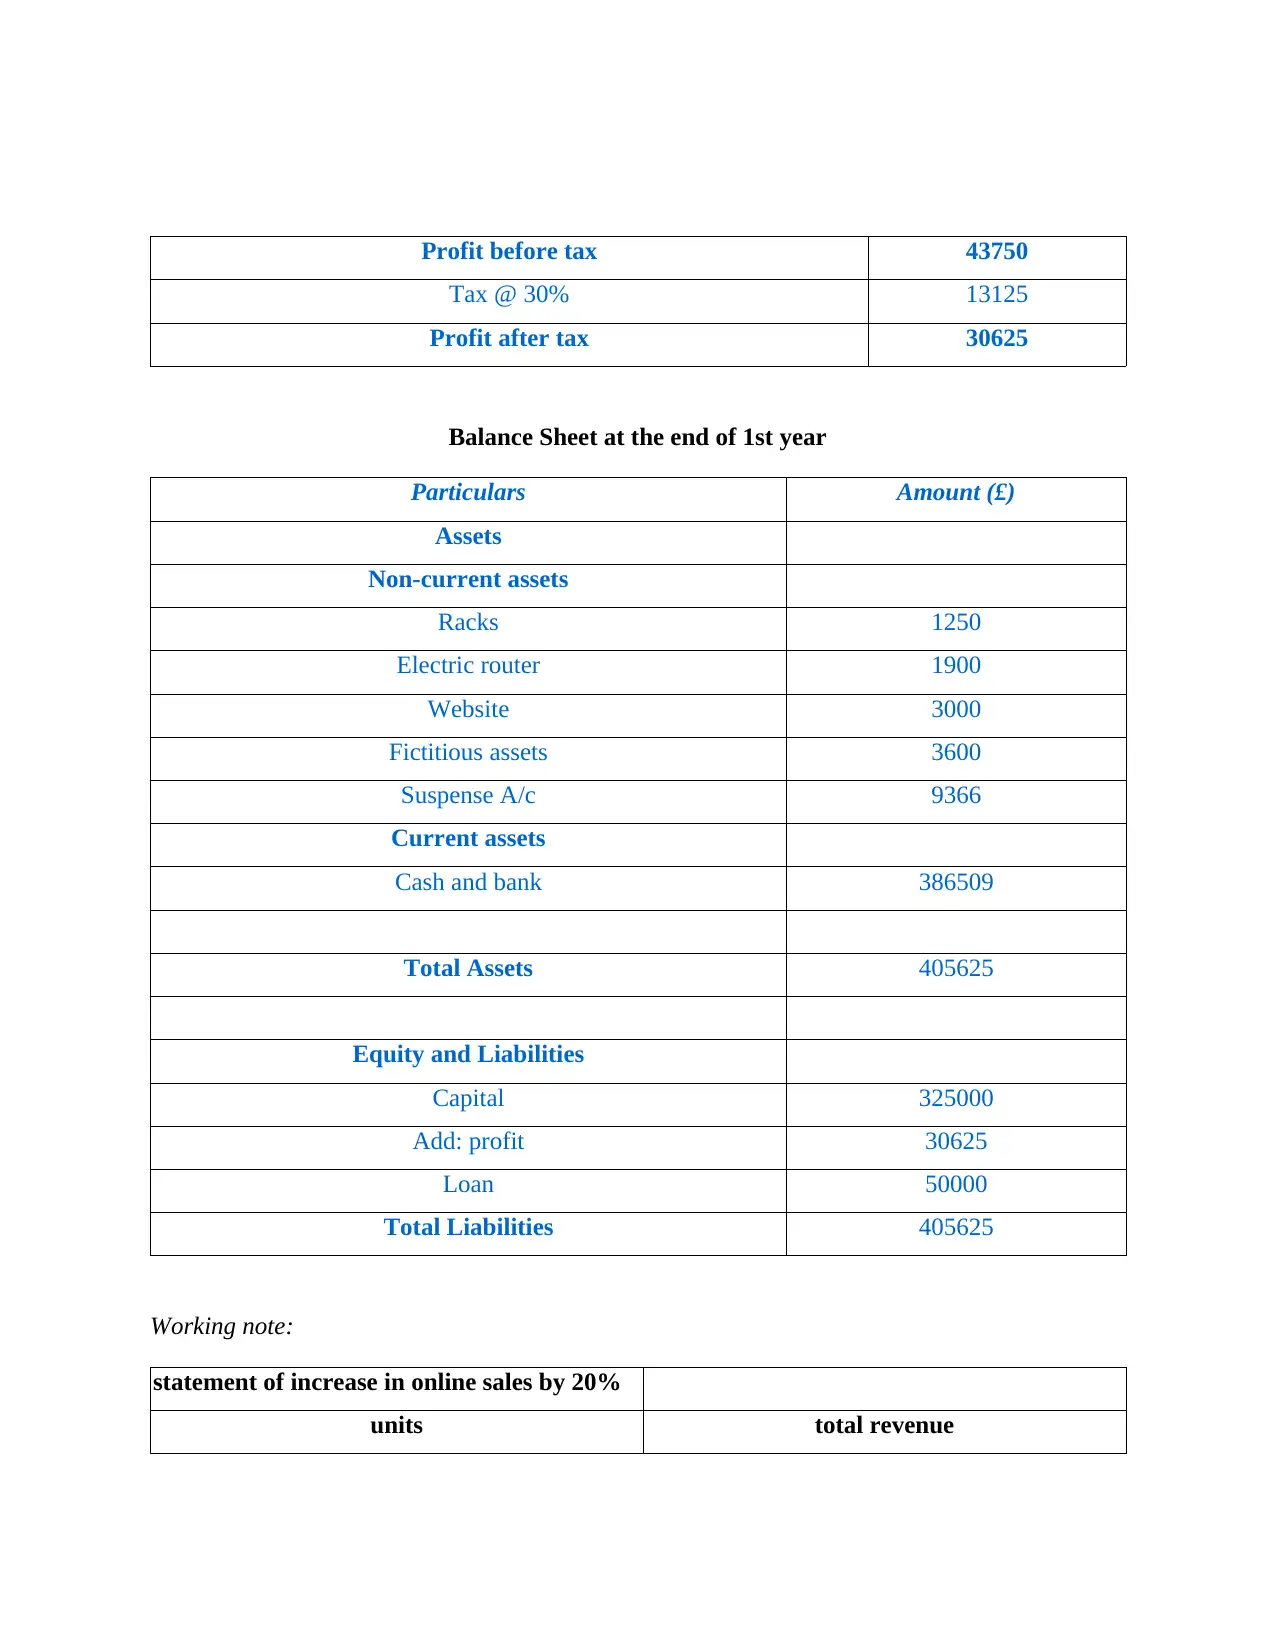
Profit before tax 43750
Tax @ 30% 13125
Profit after tax 30625
Balance Sheet at the end of 1st year
Particulars Amount (£)
Assets
Non-current assets
Racks 1250
Electric router 1900
Website 3000
Fictitious assets 3600
Suspense A/c 9366
Current assets
Cash and bank 386509
Total Assets 405625
Equity and Liabilities
Capital 325000
Add: profit 30625
Loan 50000
Total Liabilities 405625
Working note:
statement of increase in online sales by 20%
units total revenue
⊘ This is a preview!⊘
Do you want full access?
Subscribe today to unlock all pages.
Trusted by 1+ million students worldwide
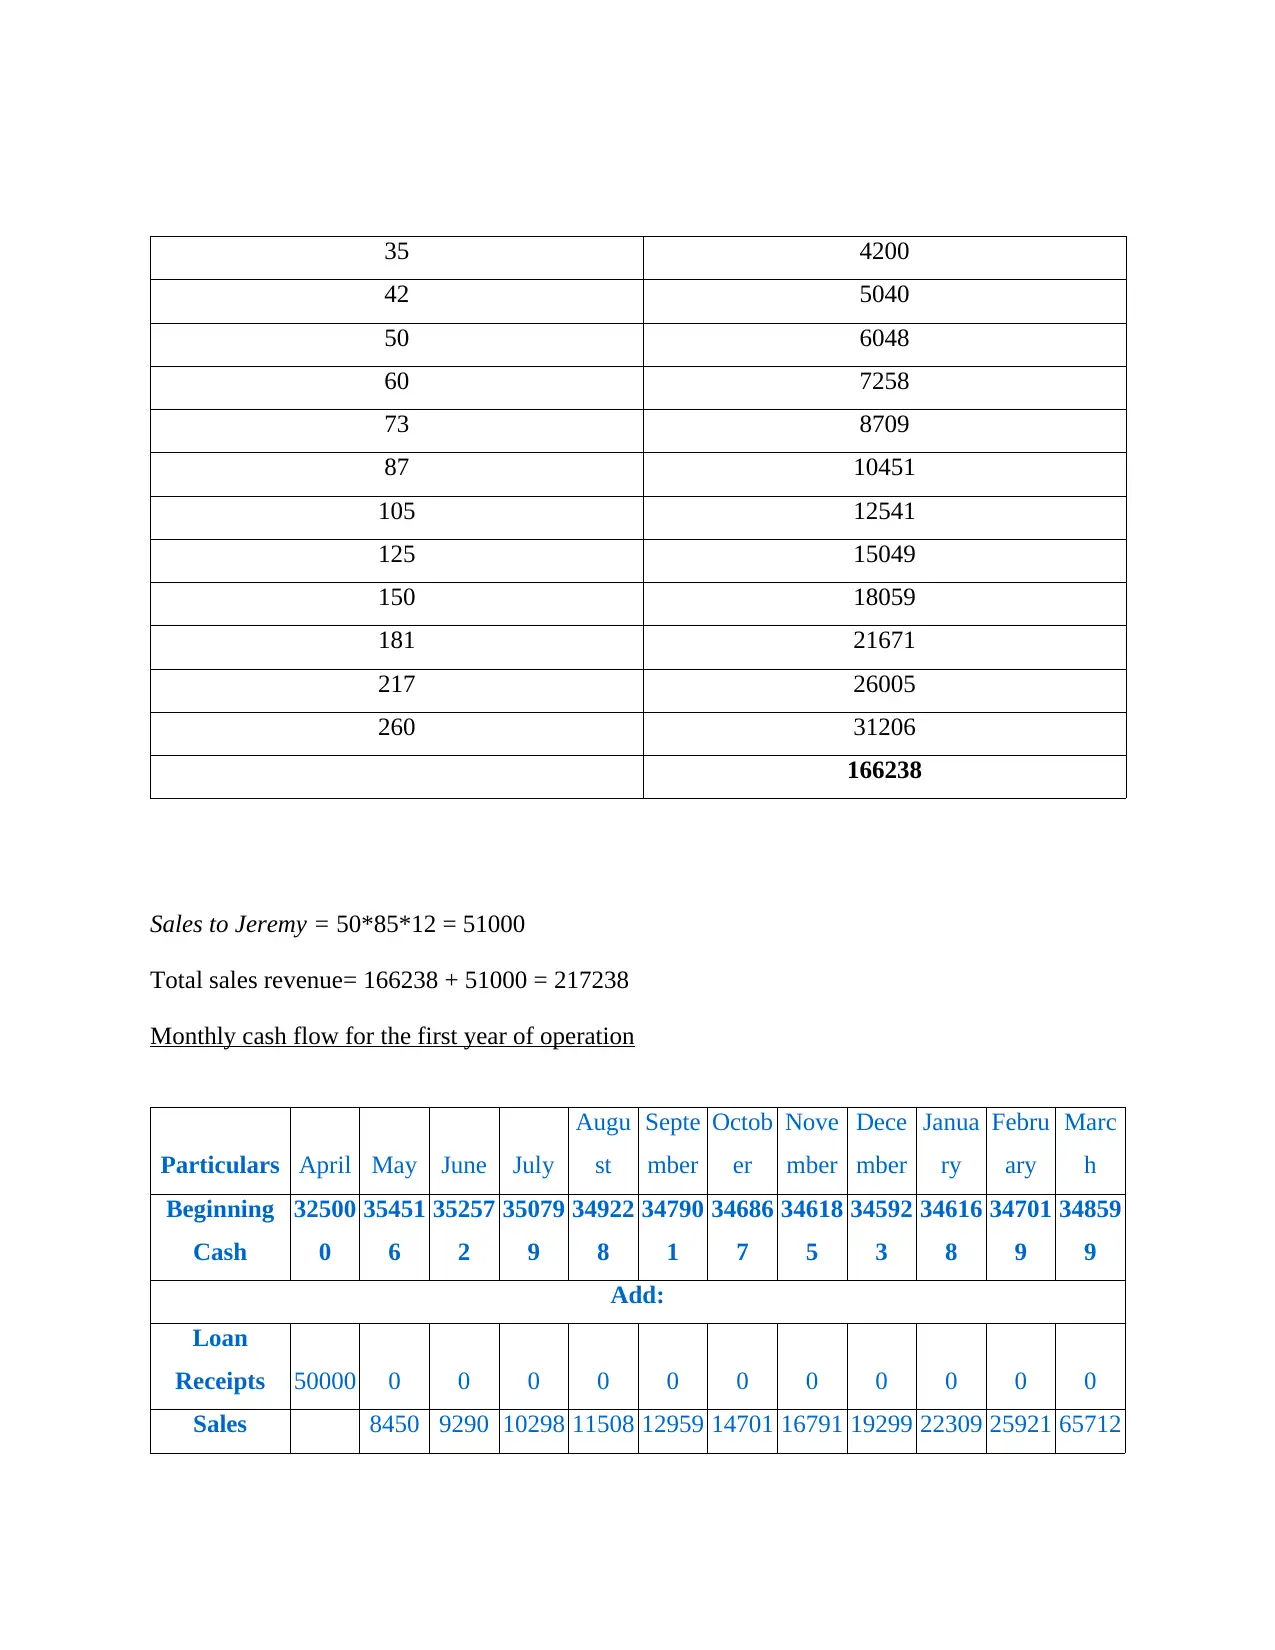
35 4200
42 5040
50 6048
60 7258
73 8709
87 10451
105 12541
125 15049
150 18059
181 21671
217 26005
260 31206
166238
Sales to Jeremy = 50*85*12 = 51000
Total sales revenue= 166238 + 51000 = 217238
Monthly cash flow for the first year of operation
Particulars April May June July
Augu
st
Septe
mber
Octob
er
Nove
mber
Dece
mber
Janua
ry
Febru
ary
Marc
h
Beginning
Cash
32500
0
35451
6
35257
2
35079
9
34922
8
34790
1
34686
7
34618
5
34592
3
34616
8
34701
9
34859
9
Add:
Loan
Receipts 50000 0 0 0 0 0 0 0 0 0 0 0
Sales 8450 9290 10298 11508 12959 14701 16791 19299 22309 25921 65712
Paraphrase This Document
Need a fresh take? Get an instant paraphrase of this document with our AI Paraphraser
receipts*
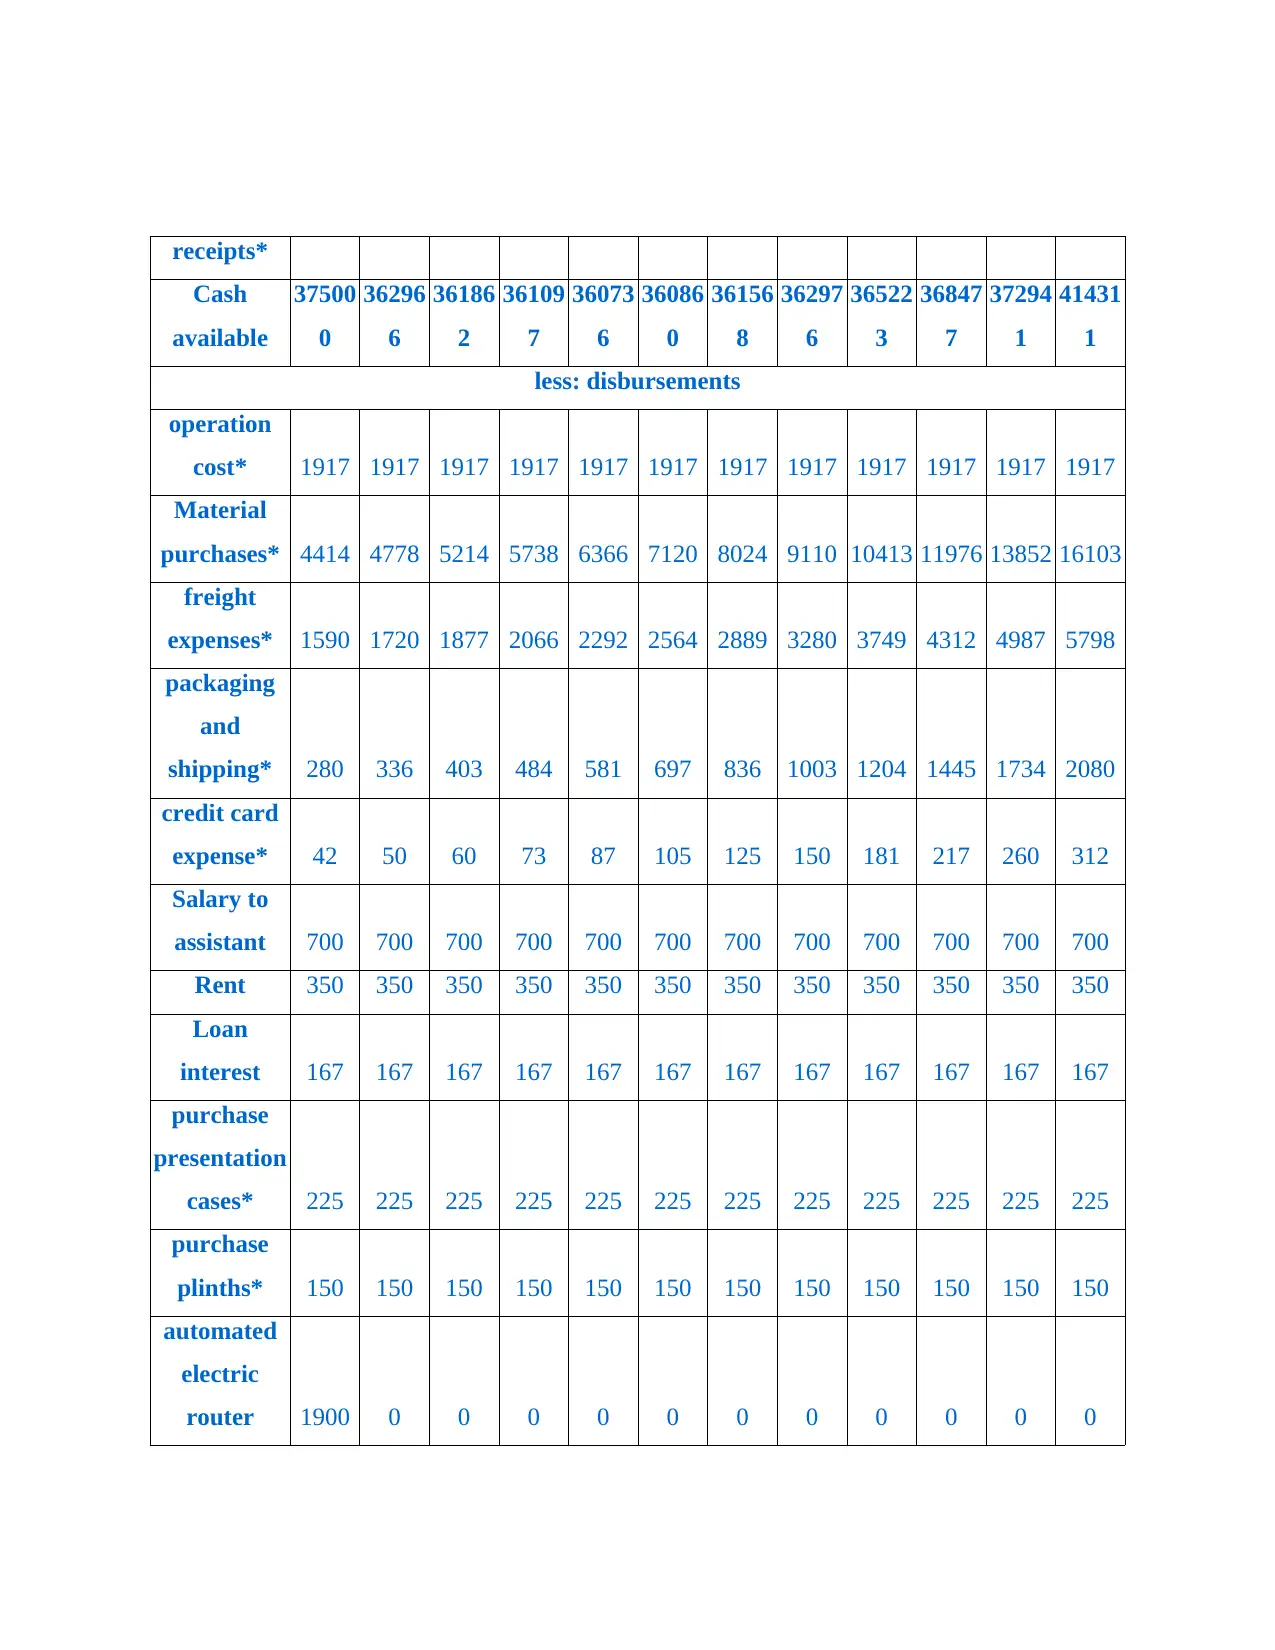
Cash
available
37500
0
36296
6
36186
2
36109
7
36073
6
36086
0
36156
8
36297
6
36522
3
36847
7
37294
1
41431
1
less: disbursements
operation
cost* 1917 1917 1917 1917 1917 1917 1917 1917 1917 1917 1917 1917
Material
purchases* 4414 4778 5214 5738 6366 7120 8024 9110 10413 11976 13852 16103
freight
expenses* 1590 1720 1877 2066 2292 2564 2889 3280 3749 4312 4987 5798
packaging
and
shipping* 280 336 403 484 581 697 836 1003 1204 1445 1734 2080
credit card
expense* 42 50 60 73 87 105 125 150 181 217 260 312
Salary to
assistant 700 700 700 700 700 700 700 700 700 700 700 700
Rent 350 350 350 350 350 350 350 350 350 350 350 350
Loan
interest 167 167 167 167 167 167 167 167 167 167 167 167
purchase
presentation
cases* 225 225 225 225 225 225 225 225 225 225 225 225
purchase
plinths* 150 150 150 150 150 150 150 150 150 150 150 150
automated
electric
router 1900 0 0 0 0 0 0 0 0 0 0 0
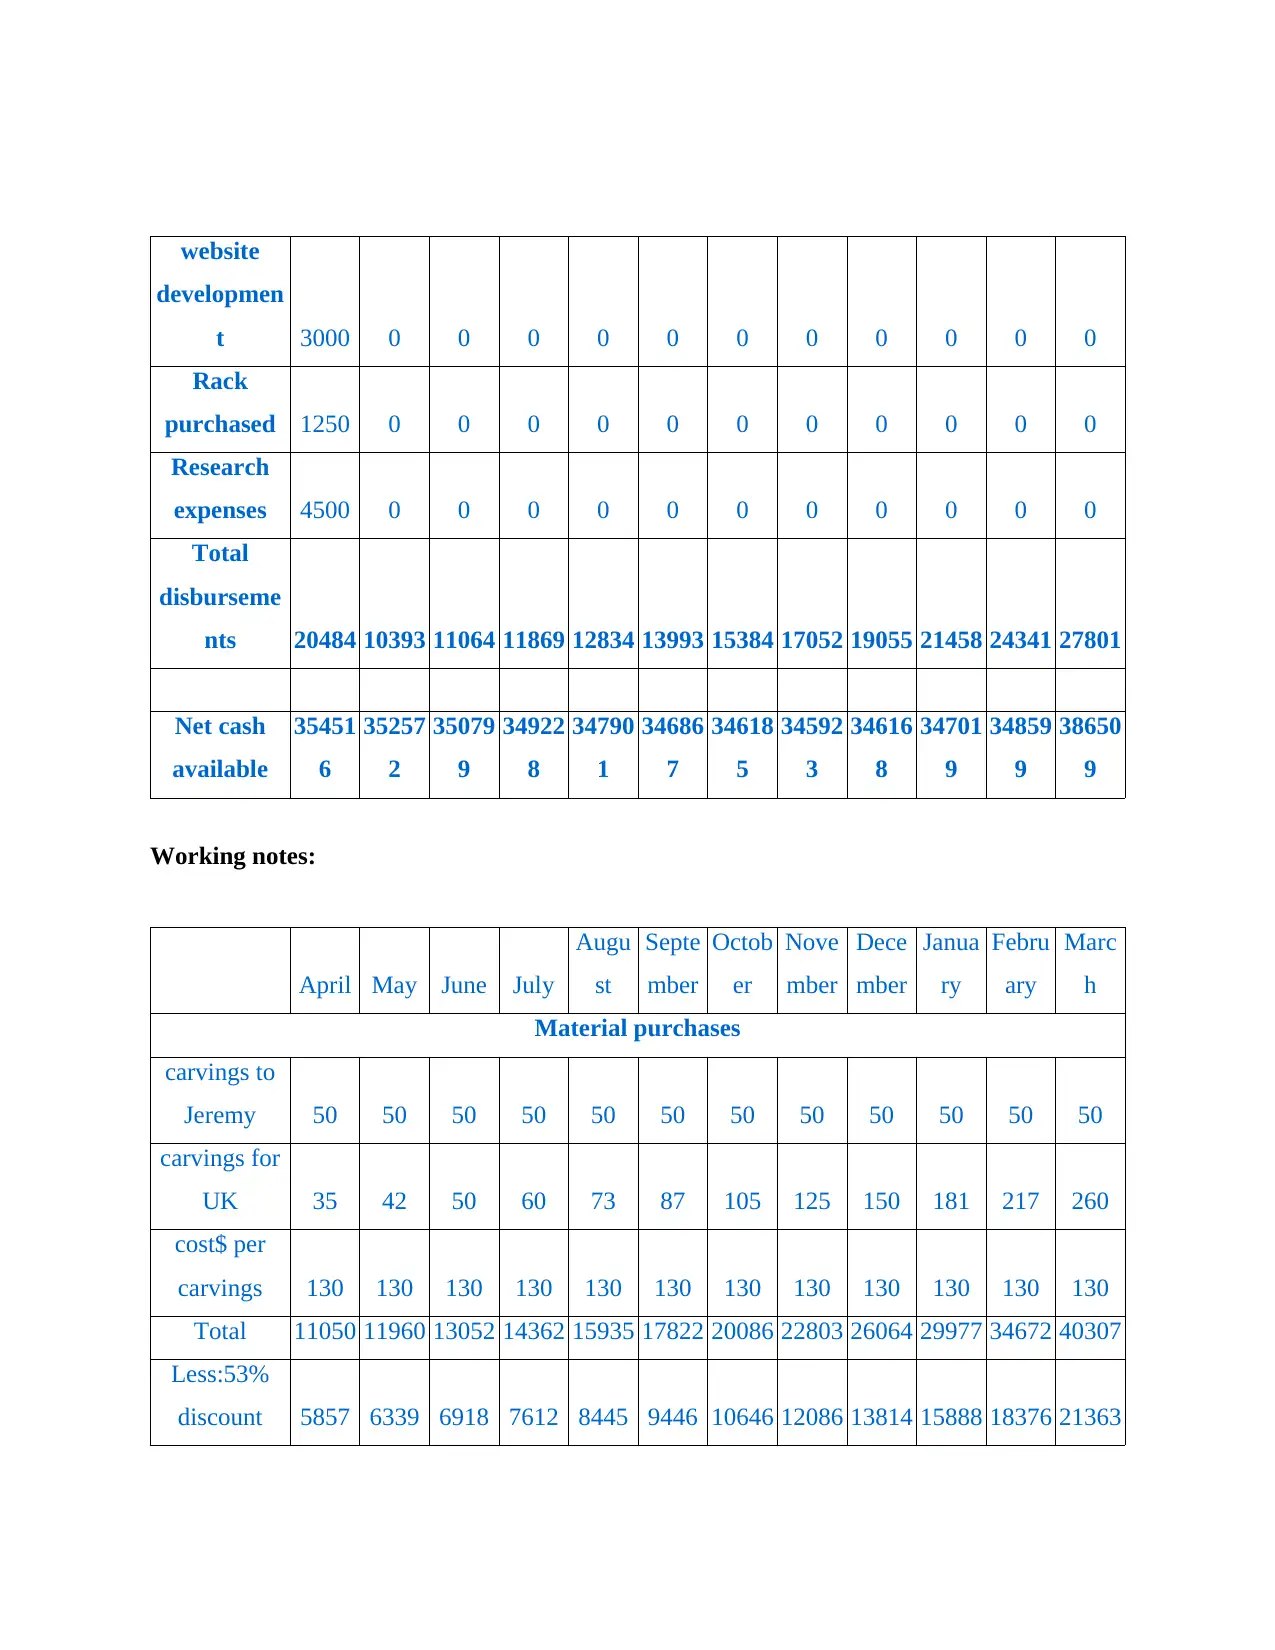
website
developmen
t 3000 0 0 0 0 0 0 0 0 0 0 0
Rack
purchased 1250 0 0 0 0 0 0 0 0 0 0 0
Research
expenses 4500 0 0 0 0 0 0 0 0 0 0 0
Total
disburseme
nts 20484 10393 11064 11869 12834 13993 15384 17052 19055 21458 24341 27801
Net cash
available
35451
6
35257
2
35079
9
34922
8
34790
1
34686
7
34618
5
34592
3
34616
8
34701
9
34859
9
38650
9
Working notes:
April May June July
Augu
st
Septe
mber
Octob
er
Nove
mber
Dece
mber
Janua
ry
Febru
ary
Marc
h
Material purchases
carvings to
Jeremy 50 50 50 50 50 50 50 50 50 50 50 50
carvings for
UK 35 42 50 60 73 87 105 125 150 181 217 260
cost$ per
carvings 130 130 130 130 130 130 130 130 130 130 130 130
Total 11050 11960 13052 14362 15935 17822 20086 22803 26064 29977 34672 40307
Less:53%
discount 5857 6339 6918 7612 8445 9446 10646 12086 13814 15888 18376 21363
⊘ This is a preview!⊘
Do you want full access?
Subscribe today to unlock all pages.
Trusted by 1+ million students worldwide
1 out of 28
Related Documents


Your All-in-One AI-Powered Toolkit for Academic Success.
+13062052269
info@desklib.com
Available 24*7 on WhatsApp / Email
![[object Object]](/_next/static/media/star-bottom.7253800d.svg)
Unlock your academic potential
Copyright © 2020–2026 A2Z Services. All Rights Reserved. Developed and managed by ZUCOL.