Financial Management and Accounting Report: Cost Analysis and Ratios
VerifiedAdded on 2020/01/07
|17
|4625
|164
Report
AI Summary
This report presents a comprehensive analysis of financial management and accounting principles, focusing on the influence of legal and regulatory factors on financial statements. It includes an examination of the Companies Act 2006 and International Financial Reporting Standards (IFRS), detailing their implications for various stakeholders. The report also features a cost of production analysis for Howorth Ltd., calculating equivalent units and total costs, and identifies key performance indicators for potential improvements. Furthermore, it provides income statements, consolidated statements, and a financial ratio analysis of Ager Ltd. for 2012 and 2013, along with a memorandum report advising management. The analysis covers various aspects of financial reporting, from cost accounting to the interpretation of financial ratios, offering valuable insights for financial decision-making.

FINANCIAL MANAGEMENT AND
ACCOUNTING
ACCOUNTING
Paraphrase This Document
Need a fresh take? Get an instant paraphrase of this document with our AI Paraphraser
Table of Contents
FINANCIAL MANAGEMENT AND ACCOUNTING.................................................................1
INTRODUCTION ..........................................................................................................................1
11.1 Legal and regulatory influences on the financial statements and dealt with accounting
and reporting standard.................................................................................................................1
21.2 Implications of legal and regulatory measures on the users using financial statements and
how information needs of the users vary....................................................................................2
TASK 2............................................................................................................................................3
11) Calculation of Cost of production ........................................................................................3
22) Performance indicators to identify the potential improvements..........................................6
3A) Income statements for the year ended.................................................................................6
4B) Comprehensive income statements......................................................................................7
TASK 3............................................................................................................................................9
1Consolidated and summarized statement of comprehensive income financial position
statements for X parent company................................................................................................9
TASK 4..........................................................................................................................................10
1A] Calculation of ratios for the year ended on 30/9/2013.......................................................10
2b) Interpretation of the ratios computed for the year 2013.....................................................11
3C] Memorandum report advising the management of the company.......................................12
CONCLUSION..............................................................................................................................13
REFERENCES..............................................................................................................................14
INTRODUCTION
Financial management is the process that is highly concern with summarizing, recording
and analysing all the accounting transactions in order to examine the accurate picture of
organisation (Barton and Simko, 2002). By using data extracted from the above processes,
financial statements are prepared by the company and same are communicated to the general
public. In the present project report, influence of legal and regulatory factors on financial
statements is explained. Along with this, implication of these legal and regulatory factors on
financial statements will also be depicted. Further, cost of production report has prepared for
Howorth and some of the suggestions has been given to the company with an aim to minimize
the costs as well as enhance the value and quality. Apart from this, consolidated income and
financial position statements have been prepared. Besides this, financial ratios of Ager ltd. for
the year 2012 and 2013 have been computed and the same have been compared.
TASK 1
11.1 Legal and regulatory influences on the financial statements and dealt with accounting and
reporting standard
Companies act 2006: This act was established by the parliament of UK which includes
the primary sources of Company law. This act handles the working of all the companies. This
act includes 1300 sections covered in 700 pages and includes 16 schedules. Further, it was
finally came into existence on 1st October 2009 (Bromwich and Bhimani, 2005). This act
includes various provisions related to the duties and responsibilities of directors. Companies act,
2006 also includes various provisions related to the public and private companies.
As per this law, every organisation is required to maintain a complete record of all its
assets, liabilities, income, expenses, sales and inventories. In addition to this, they are required to
combine the subsidiaries account and then, publish all these statements for the general public. If,
company is not able to do this then as per the section 386, officer is liable to be punished and
imprisoned. Section 388 says that every organisation is required to keep the complete record of
all the transactions so that they can be checked anytime by the inspected officer. Section 386
says that it is mandatory for all the companies to prepare balance sheet and income statements
which tell about the profit and loss of business.
⊘ This is a preview!⊘
Do you want full access?
Subscribe today to unlock all pages.
Trusted by 1+ million students worldwide
International accounting standards: This is one of the oldest set of standards which states
a particular types of transactions that influence the financial statements. These standards were
issued by the International Board of Accounting and Standard Committee (IASC). In the year
2001, new and more advanced standards were set which were known as International Financial
Reporting Standards (IFRS). This act includes various clauses about transcription the assets,
liabilities, inventories, earning per share, dividend per share, foreign exchange rate, expenditure,
income, joint ventures, staff benefits, lease contract, intangible assets, fixed assets, investment
and many more things (Burns and Scapens, 2000).
International financial and reporting standards (IFRS): These standards are set to
understand and compare the financial statements of all the companies across the geographical
boundaries. Increase in international shareholding and trade is one of the main causes for the
establishment of these standards. IFRS is successfully replacing the national accounting
standards of various countries. The main motive of IFRS is to furnish all the information related
to assets, liabilities, revenue, income, profit & loss and so on. Set up of these standards provide
assistance to the company to make the international transaction easily (Burns and Vaivio, 2001).
Some of the basis characteristics of IFRS include going concern concept, offsetting, consistency,
fair presentation, reporting frequency and accrual accounting basis. IFRS also requires that every
organisation should prepare the cash flow statements, income statements, balance sheet,
statements related to equity, retained earnings etc.
21.2 Implications of legal and regulatory measures on the users using financial statements and
how information needs of the users vary.
There are different types of users of the financial statements of company. Some of them are
internally present and some are the external users. Internal users include directors, employees
and owners while external users include creditors, suppliers, investors, government, competitor
and many more. These all users require different types of financial information.
Internal users
Directors: Directors are the ones who form various strategies with an aim to operate the
organisational activities in an effective manner, which in turn will help company to achieve its
desired objectives. They use financial statements to examine the financial performance and
position of company. On the basis of income statements, they try to analysis in detail about the
2
Paraphrase This Document
Need a fresh take? Get an instant paraphrase of this document with our AI Paraphraser
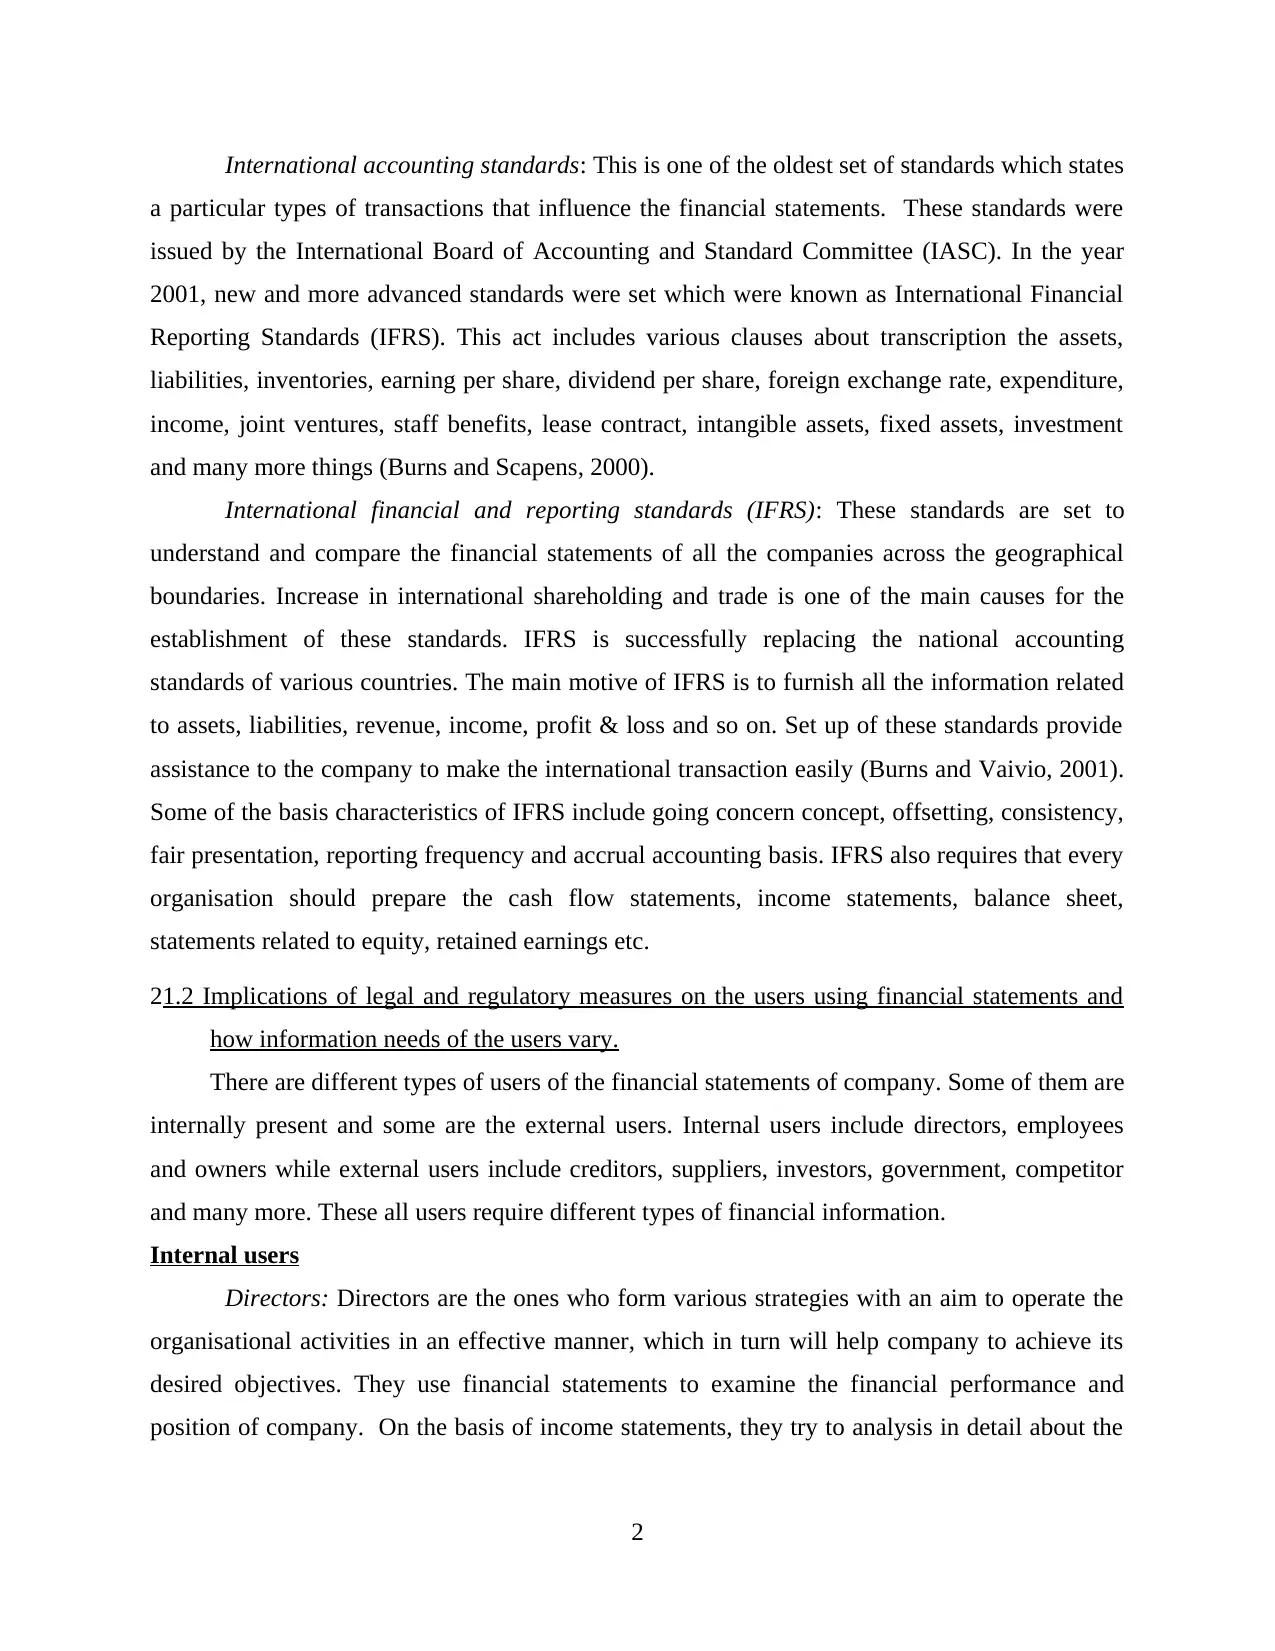
income and expenditure made by the company and then, make policies accordingly in order to
reduce the cost (Burritt and Schaltegger, 2010).
Employees: They are the important resources of company. They provide various services
to the customers of company. Their main motive is to get the job security, bonus, performance
appraisals, fair salary and various non-monetary rewards. In lieu of which they prefer to see the
probability statement of company in order to get better earning as per the business profit.
Increase in probability level indicates that company is growing and there are the chances of
increasing salary in the next financial year.
External users
Investors: They are the one who invest their saving in the company with an aim to earn
more return on their investment. They want that company should generate more and more profit
and should increase the market value of shares. In lieu of which they see the financial statements
of business. Existing investors examine the business profit to conclude the return earned by
them. However, existing shareholders use financial statements published by the company.
Government: Government wants information about the profit and loss generated by
company and the growth rate it in various sectors. They use financial statements of the
organization in order to calculate the amount of tax needed to be paid by them (Dechow and
Skinner, 2000). Various government authorities ascertain the firm’s tax debts and then compare
the same with the tax paid. Government provides resources to the company to develop better
policies for the economic growth.
TASK 2
PART A
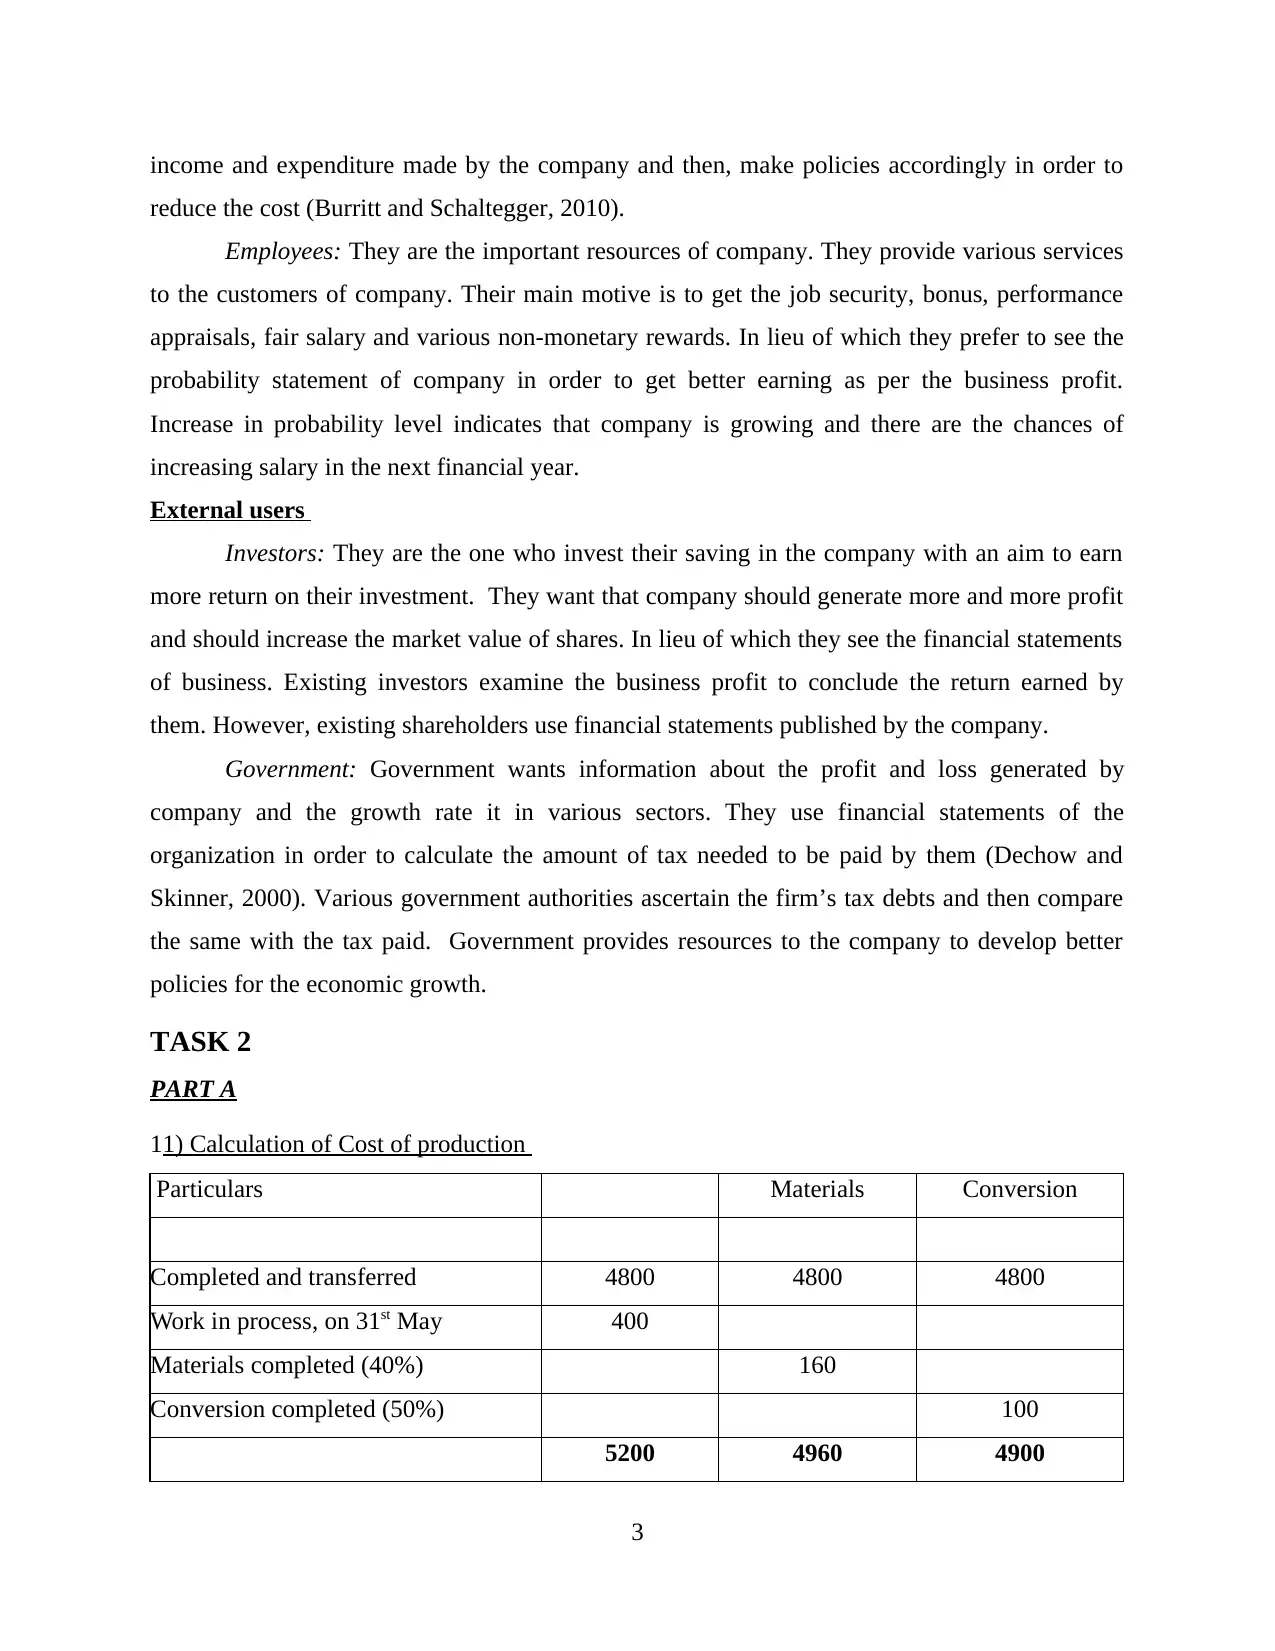
11) Calculation of Cost of production
Particulars Materials Conversion
Completed and transferred 4800 4800 4800
Work in process, on 31st May 400
Materials completed (40%) 160
Conversion completed (50%) 100
5200 4960 4900
3
reduce the cost (Burritt and Schaltegger, 2010).
Employees: They are the important resources of company. They provide various services
to the customers of company. Their main motive is to get the job security, bonus, performance
appraisals, fair salary and various non-monetary rewards. In lieu of which they prefer to see the
probability statement of company in order to get better earning as per the business profit.
Increase in probability level indicates that company is growing and there are the chances of
increasing salary in the next financial year.
External users
Investors: They are the one who invest their saving in the company with an aim to earn
more return on their investment. They want that company should generate more and more profit
and should increase the market value of shares. In lieu of which they see the financial statements
of business. Existing investors examine the business profit to conclude the return earned by
them. However, existing shareholders use financial statements published by the company.
Government: Government wants information about the profit and loss generated by
company and the growth rate it in various sectors. They use financial statements of the
organization in order to calculate the amount of tax needed to be paid by them (Dechow and
Skinner, 2000). Various government authorities ascertain the firm’s tax debts and then compare
the same with the tax paid. Government provides resources to the company to develop better
policies for the economic growth.
TASK 2
PART A
11) Calculation of Cost of production
Particulars Materials Conversion
Completed and transferred 4800 4800 4800
Work in process, on 31st May 400
Materials completed (40%) 160
Conversion completed (50%) 100
5200 4960 4900
3
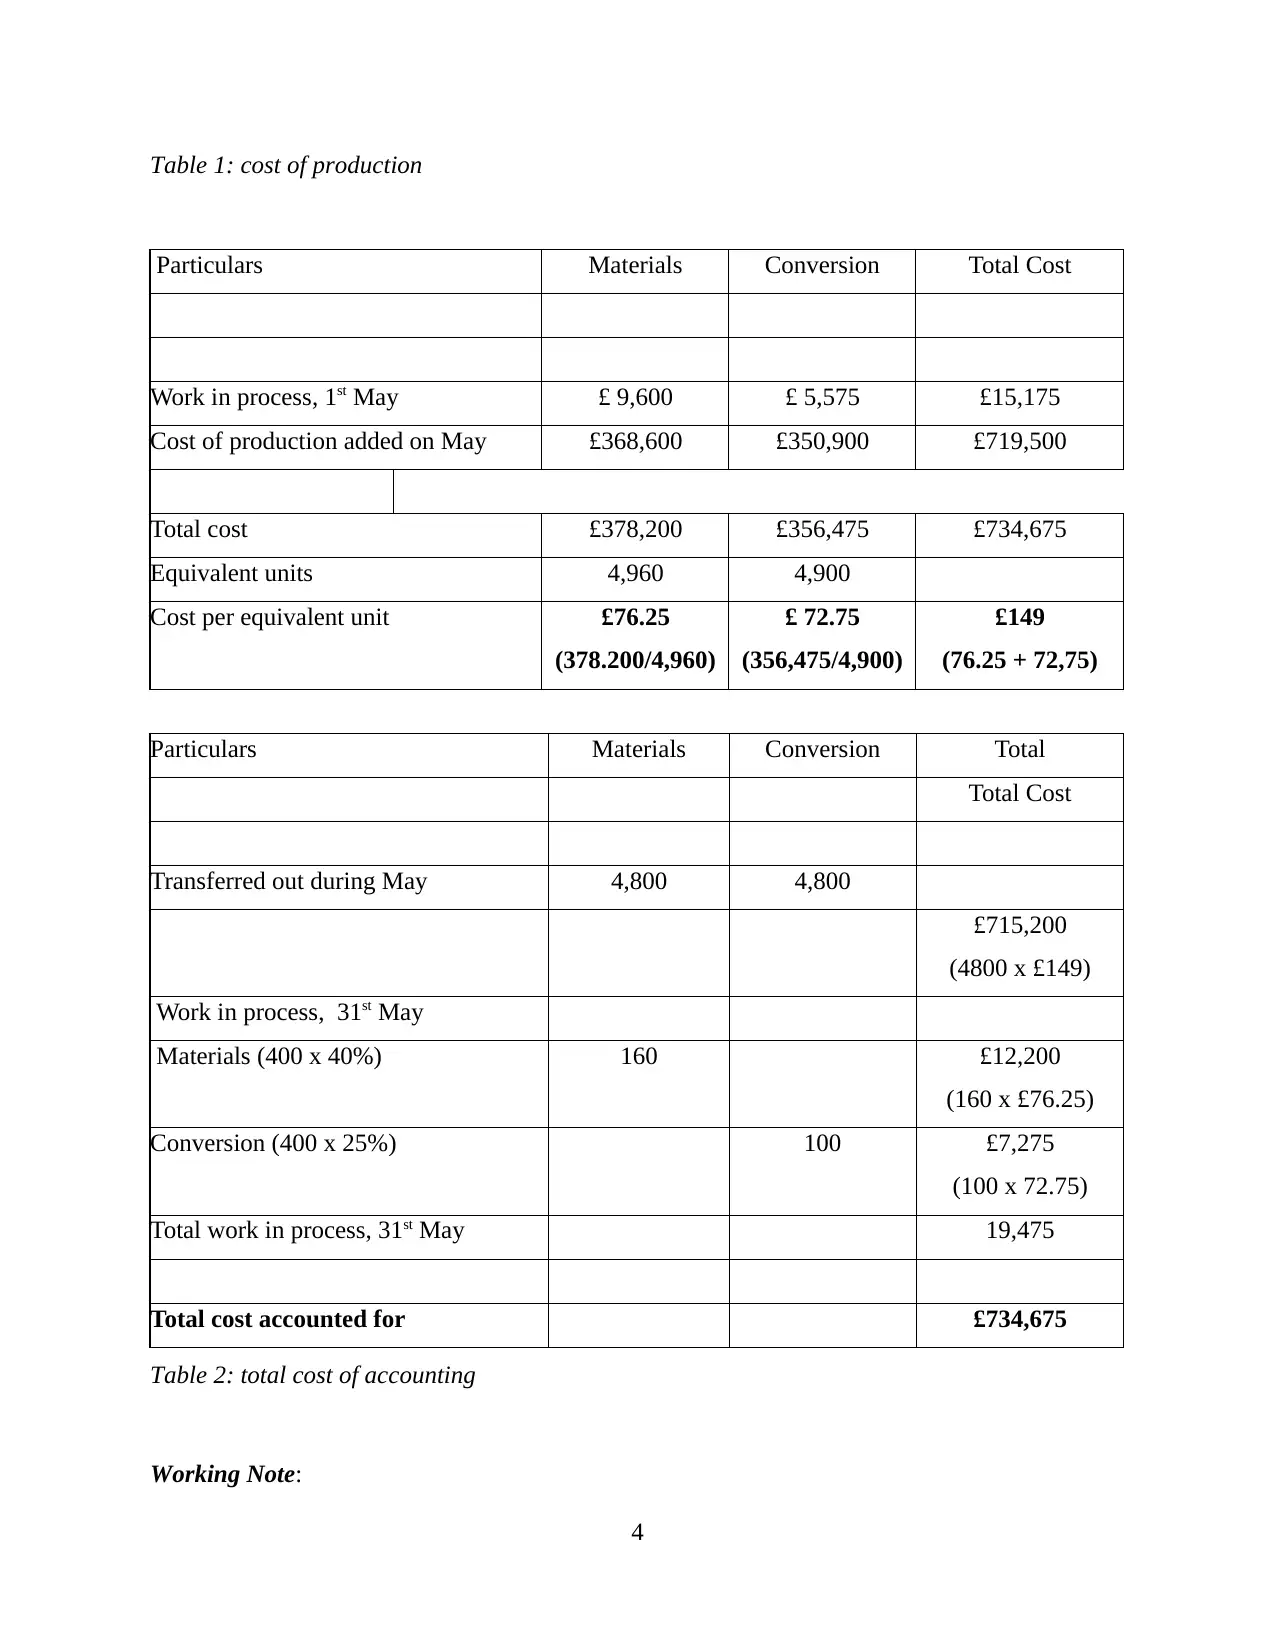
Table 1: cost of production
Particulars Materials Conversion Total Cost
Work in process, 1st May £ 9,600 £ 5,575 £15,175
Cost of production added on May £368,600 £350,900 £719,500
Total cost £378,200 £356,475 £734,675
Equivalent units 4,960 4,900
Cost per equivalent unit £76.25
(378.200/4,960)
£ 72.75
(356,475/4,900)
£149
(76.25 + 72,75)
Particulars Materials Conversion Total
Total Cost
Transferred out during May 4,800 4,800
£715,200
(4800 x £149)
Work in process, 31st May
Materials (400 x 40%) 160 £12,200
(160 x £76.25)
Conversion (400 x 25%) 100 £7,275
(100 x 72.75)
Total work in process, 31st May 19,475
Total cost accounted for £734,675
Table 2: total cost of accounting
Working Note:
4
⊘ This is a preview!⊘
Do you want full access?
Subscribe today to unlock all pages.
Trusted by 1+ million students worldwide
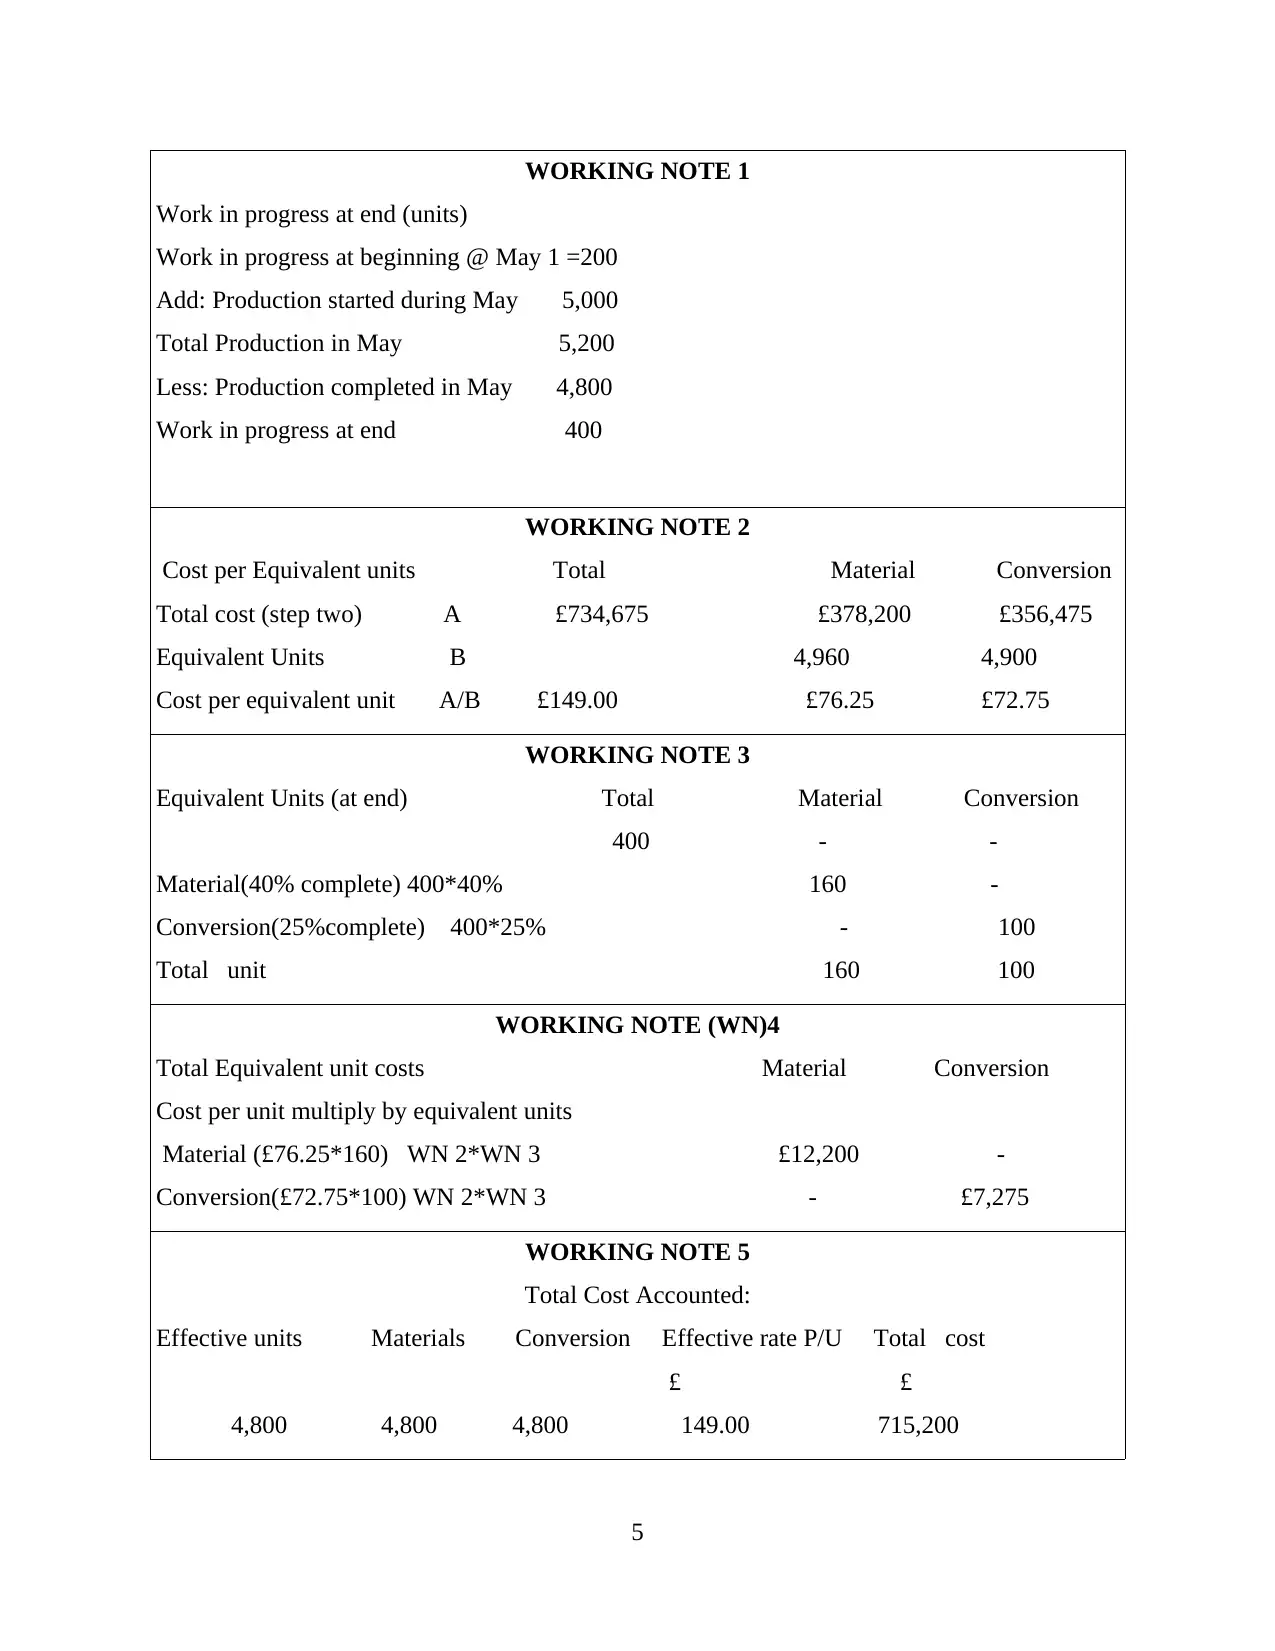
WORKING NOTE 1
Work in progress at end (units)
Work in progress at beginning @ May 1 =200
Add: Production started during May 5,000
Total Production in May 5,200
Less: Production completed in May 4,800
Work in progress at end 400
WORKING NOTE 2
Cost per Equivalent units Total Material Conversion
Total cost (step two) A £734,675 £378,200 £356,475
Equivalent Units B 4,960 4,900
Cost per equivalent unit A/B £149.00 £76.25 £72.75
WORKING NOTE 3
Equivalent Units (at end) Total Material Conversion
400 - -
Material(40% complete) 400*40% 160 -
Conversion(25%complete) 400*25% - 100
Total unit 160 100
WORKING NOTE (WN)4
Total Equivalent unit costs Material Conversion
Cost per unit multiply by equivalent units
Material (£76.25*160) WN 2*WN 3 £12,200 -
Conversion(£72.75*100) WN 2*WN 3 - £7,275
WORKING NOTE 5
Total Cost Accounted:
Effective units Materials Conversion Effective rate P/U Total cost
£ £
4,800 4,800 4,800 149.00 715,200
5
Paraphrase This Document
Need a fresh take? Get an instant paraphrase of this document with our AI Paraphraser
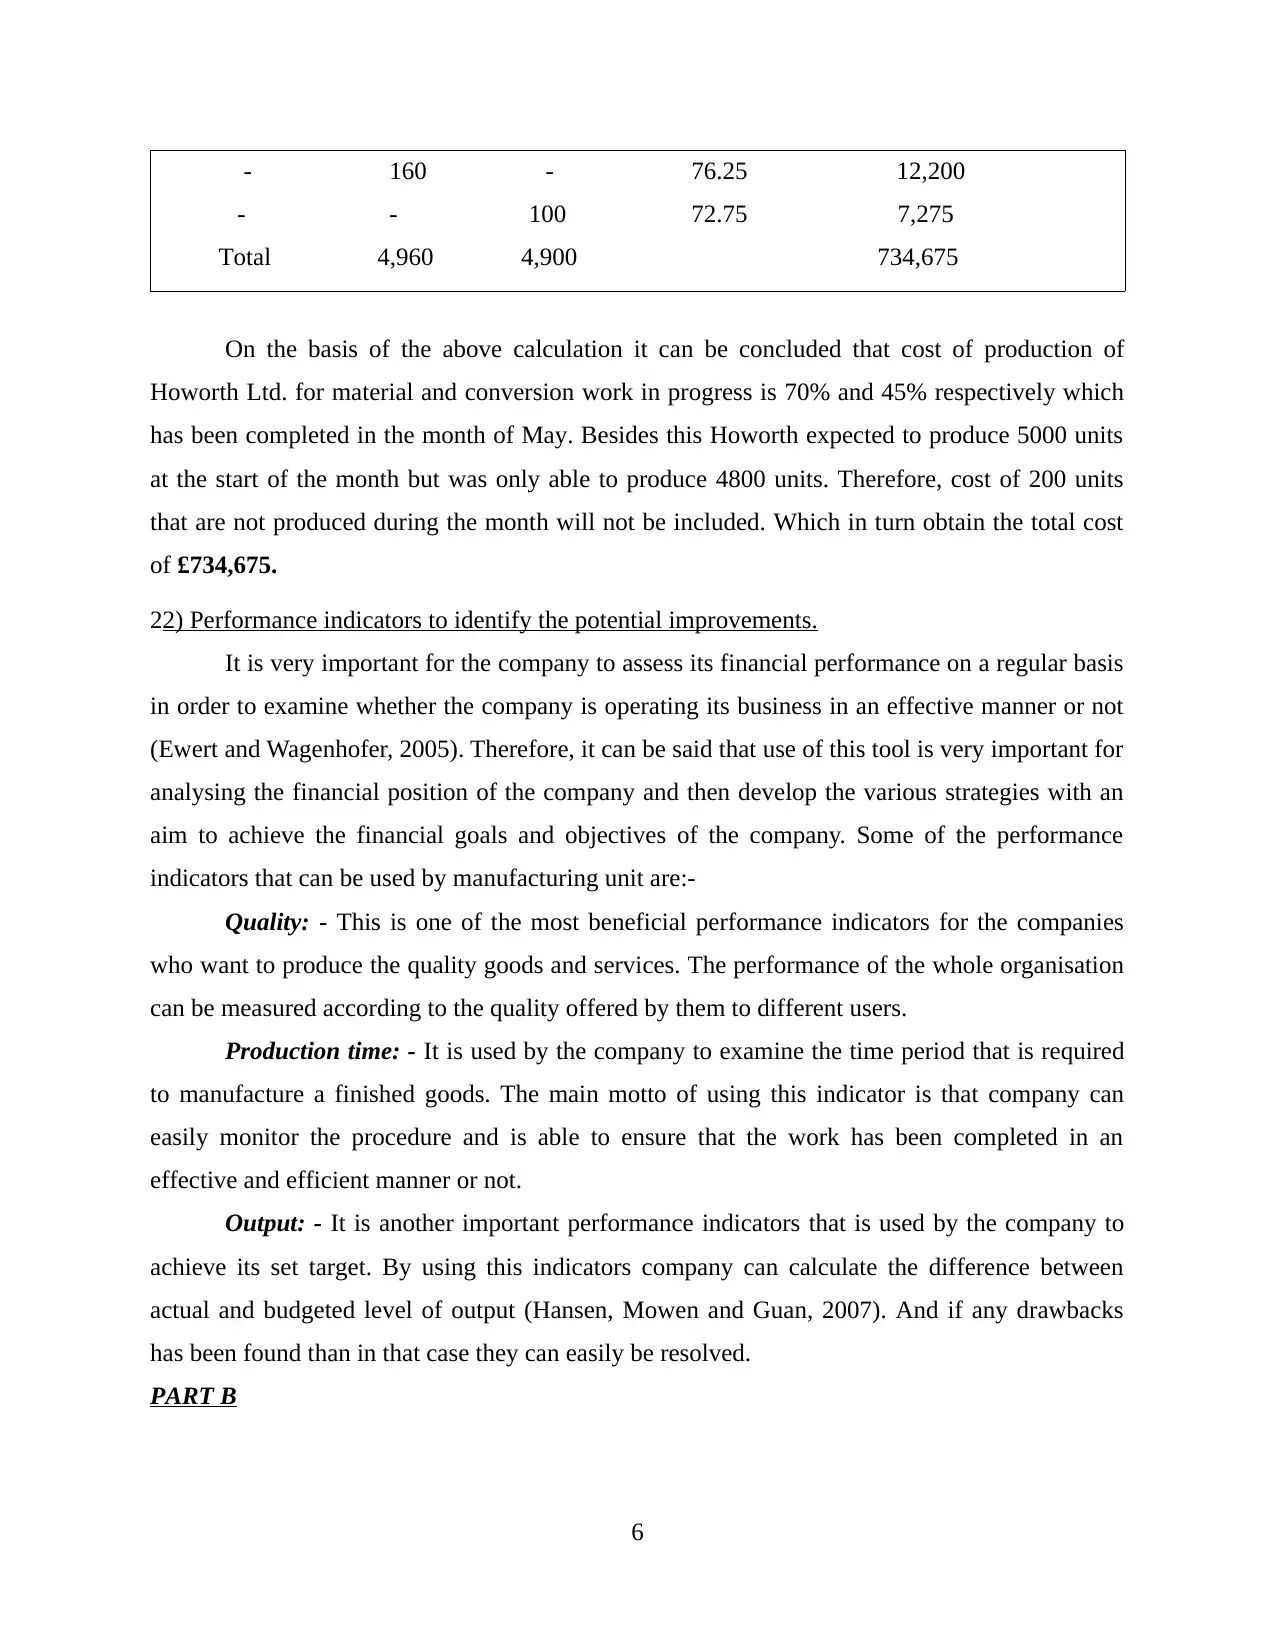
- 160 - 76.25 12,200
- - 100 72.75 7,275
Total 4,960 4,900 734,675
On the basis of the above calculation it can be concluded that cost of production of
Howorth Ltd. for material and conversion work in progress is 70% and 45% respectively which
has been completed in the month of May. Besides this Howorth expected to produce 5000 units
at the start of the month but was only able to produce 4800 units. Therefore, cost of 200 units
that are not produced during the month will not be included. Which in turn obtain the total cost
of £734,675.
22) Performance indicators to identify the potential improvements.
It is very important for the company to assess its financial performance on a regular basis
in order to examine whether the company is operating its business in an effective manner or not
(Ewert and Wagenhofer, 2005). Therefore, it can be said that use of this tool is very important for
analysing the financial position of the company and then develop the various strategies with an
aim to achieve the financial goals and objectives of the company. Some of the performance
indicators that can be used by manufacturing unit are:-
Quality: - This is one of the most beneficial performance indicators for the companies
who want to produce the quality goods and services. The performance of the whole organisation
can be measured according to the quality offered by them to different users.
Production time: - It is used by the company to examine the time period that is required
to manufacture a finished goods. The main motto of using this indicator is that company can
easily monitor the procedure and is able to ensure that the work has been completed in an
effective and efficient manner or not.
Output: - It is another important performance indicators that is used by the company to
achieve its set target. By using this indicators company can calculate the difference between
actual and budgeted level of output (Hansen, Mowen and Guan, 2007). And if any drawbacks
has been found than in that case they can easily be resolved.
PART B
6
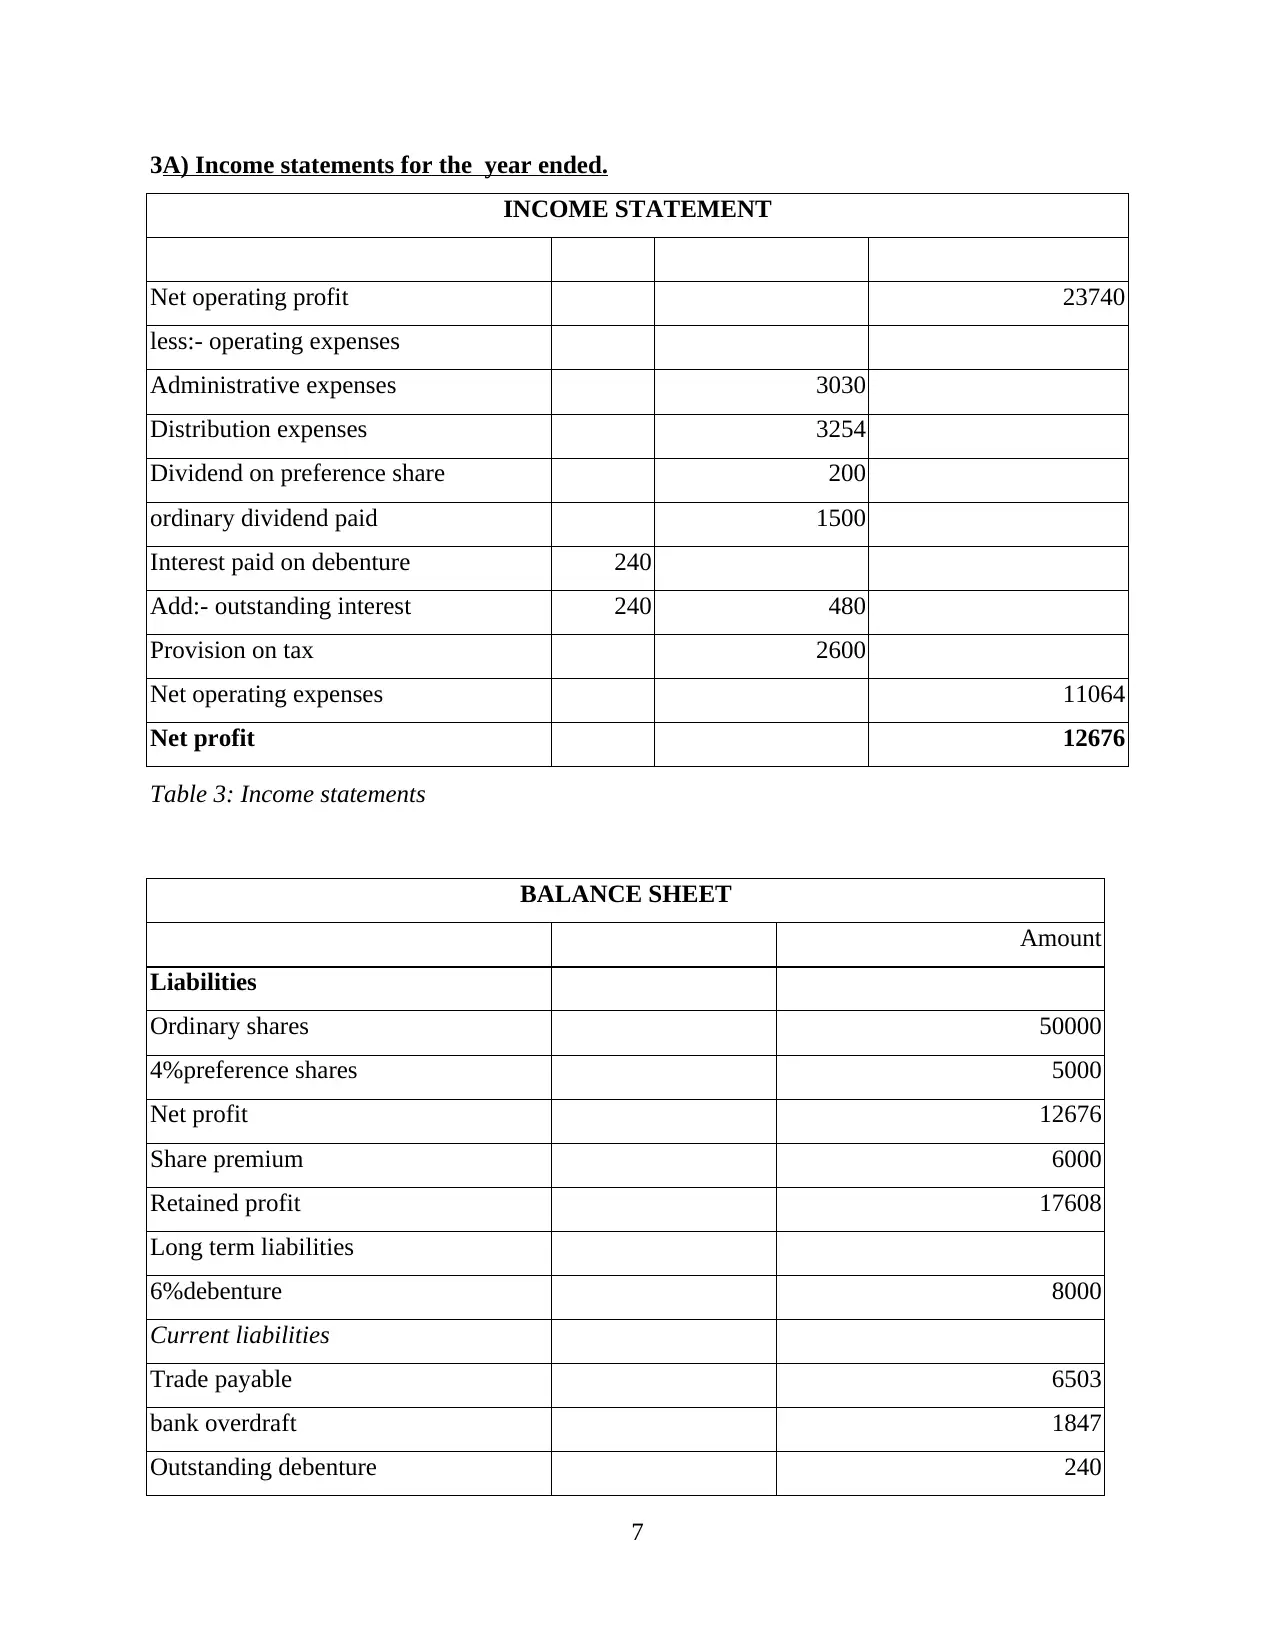
3A) Income statements for the year ended.
INCOME STATEMENT
Net operating profit 23740
less:- operating expenses
Administrative expenses 3030
Distribution expenses 3254
Dividend on preference share 200
ordinary dividend paid 1500
Interest paid on debenture 240
Add:- outstanding interest 240 480
Provision on tax 2600
Net operating expenses 11064
Net profit 12676
Table 3: Income statements
BALANCE SHEET
Amount
Liabilities
Ordinary shares 50000
4%preference shares 5000
Net profit 12676
Share premium 6000
Retained profit 17608
Long term liabilities
6%debenture 8000
Current liabilities
Trade payable 6503
bank overdraft 1847
Outstanding debenture 240
7
⊘ This is a preview!⊘
Do you want full access?
Subscribe today to unlock all pages.
Trusted by 1+ million students worldwide
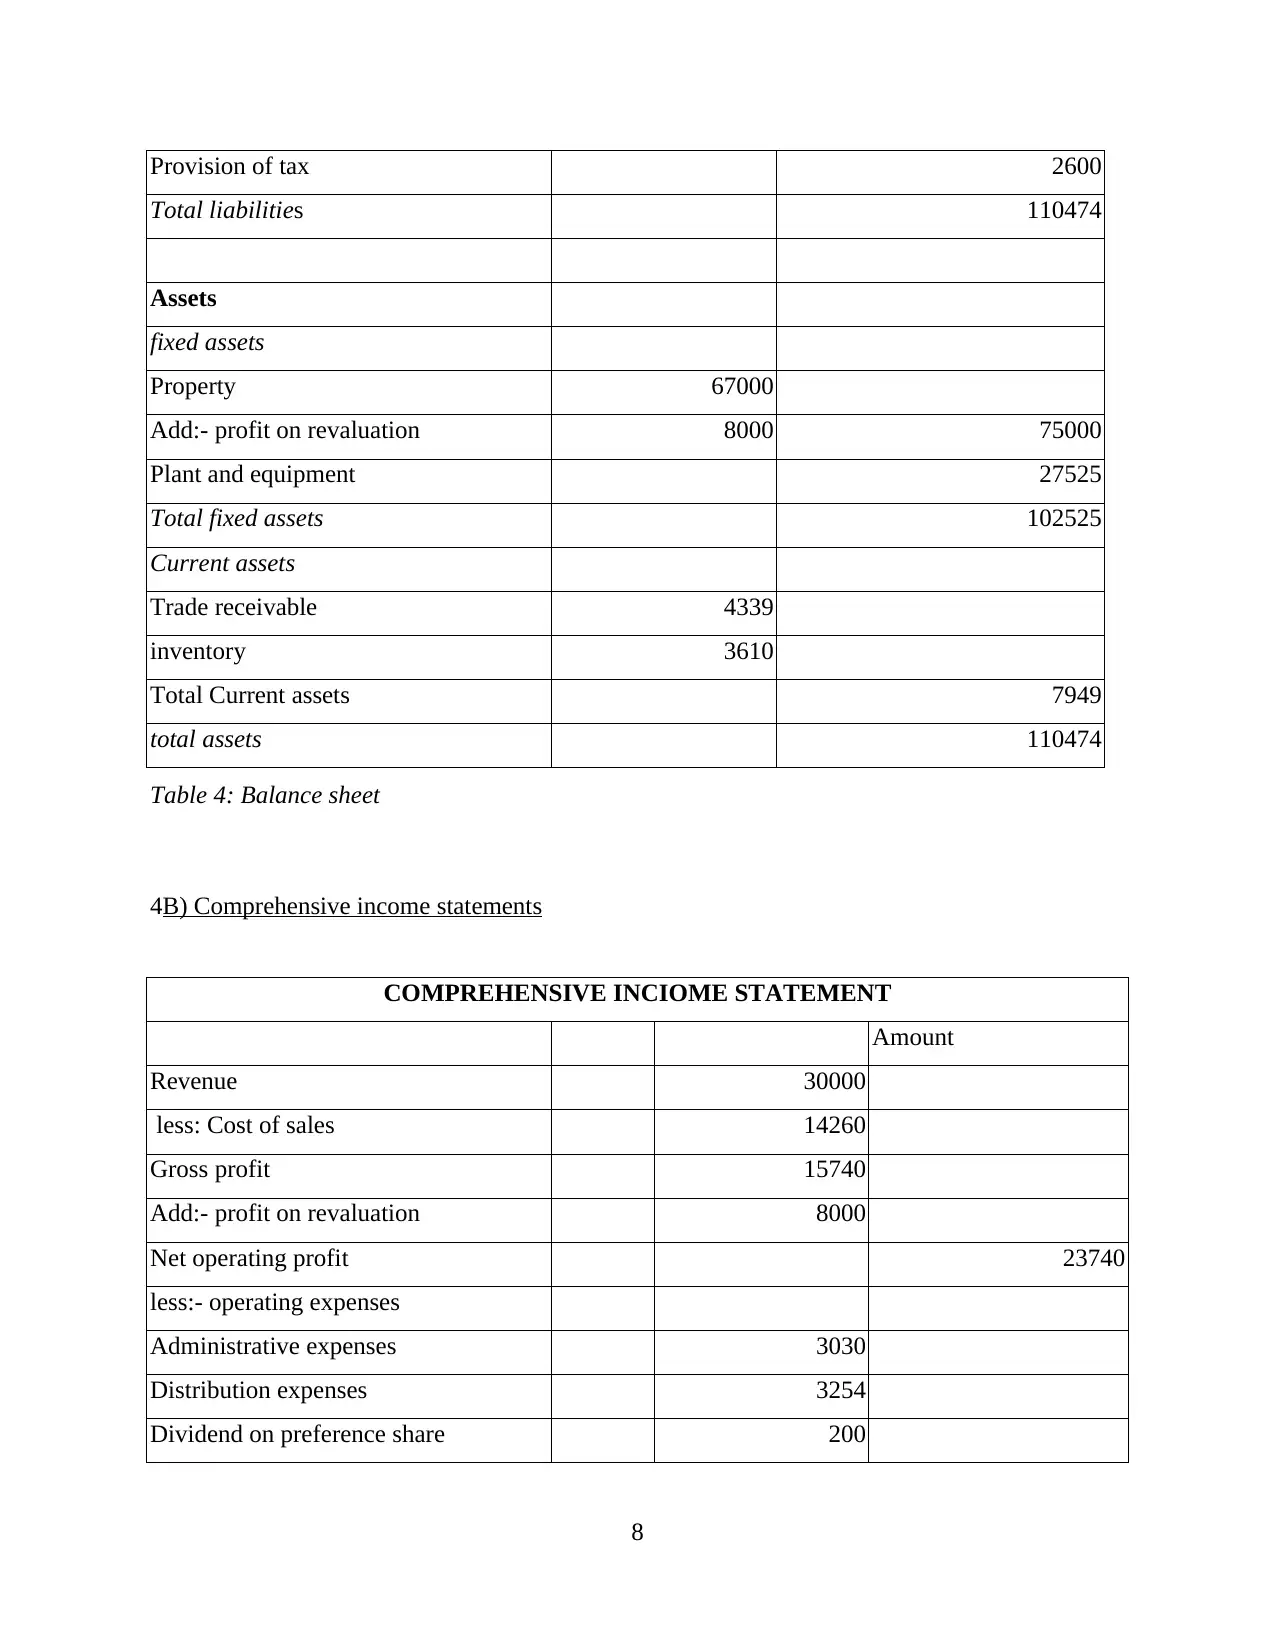
Provision of tax 2600
Total liabilities 110474
Assets
fixed assets
Property 67000
Add:- profit on revaluation 8000 75000
Plant and equipment 27525
Total fixed assets 102525
Current assets
Trade receivable 4339
inventory 3610
Total Current assets 7949
total assets 110474
Table 4: Balance sheet
4B) Comprehensive income statements
COMPREHENSIVE INCIOME STATEMENT
Amount
Revenue 30000
less: Cost of sales 14260
Gross profit 15740
Add:- profit on revaluation 8000
Net operating profit 23740
less:- operating expenses
Administrative expenses 3030
Distribution expenses 3254
Dividend on preference share 200
8
Paraphrase This Document
Need a fresh take? Get an instant paraphrase of this document with our AI Paraphraser
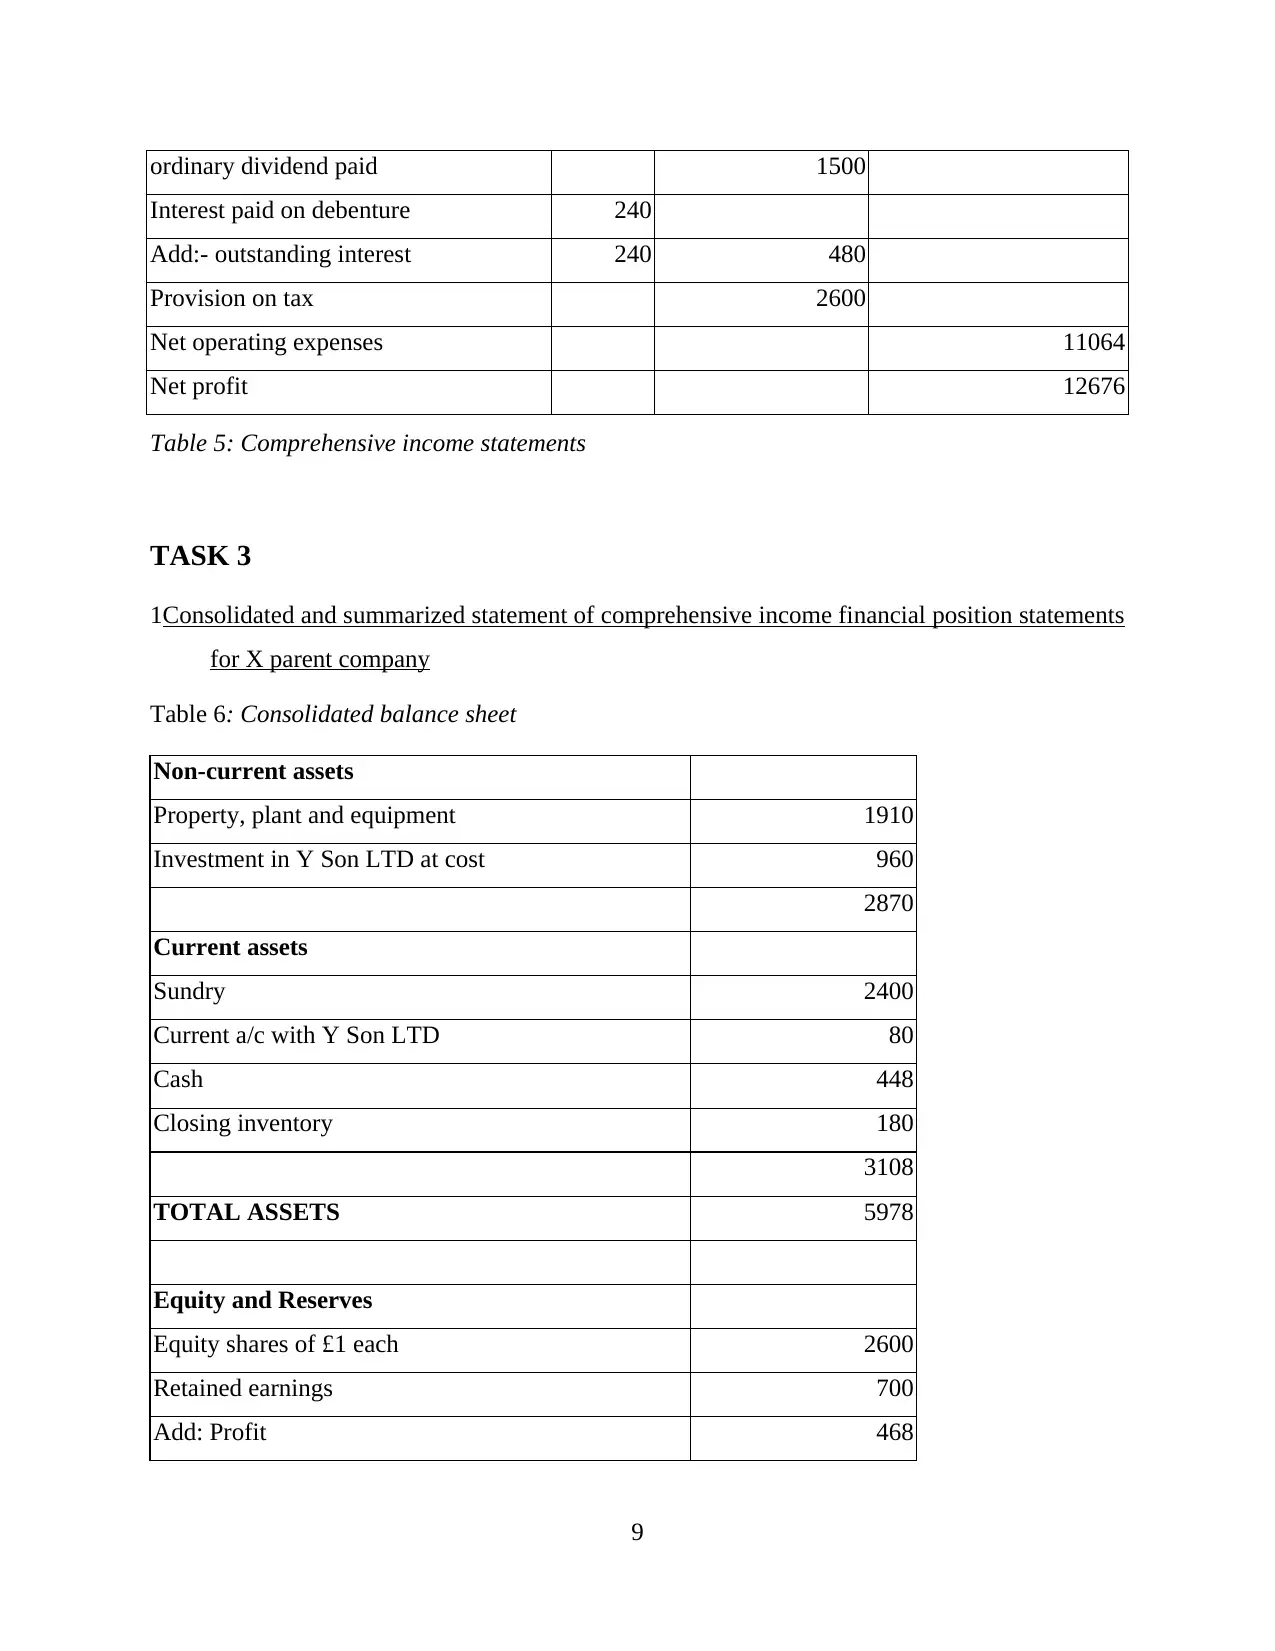
ordinary dividend paid 1500
Interest paid on debenture 240
Add:- outstanding interest 240 480
Provision on tax 2600
Net operating expenses 11064
Net profit 12676
Table 5: Comprehensive income statements
TASK 3
1Consolidated and summarized statement of comprehensive income financial position statements
for X parent company
Table 6: Consolidated balance sheet
Non-current assets
Property, plant and equipment 1910
Investment in Y Son LTD at cost 960
2870
Current assets
Sundry 2400
Current a/c with Y Son LTD 80
Cash 448
Closing inventory 180
3108
TOTAL ASSETS 5978
Equity and Reserves
Equity shares of £1 each 2600
Retained earnings 700
Add: Profit 468
9
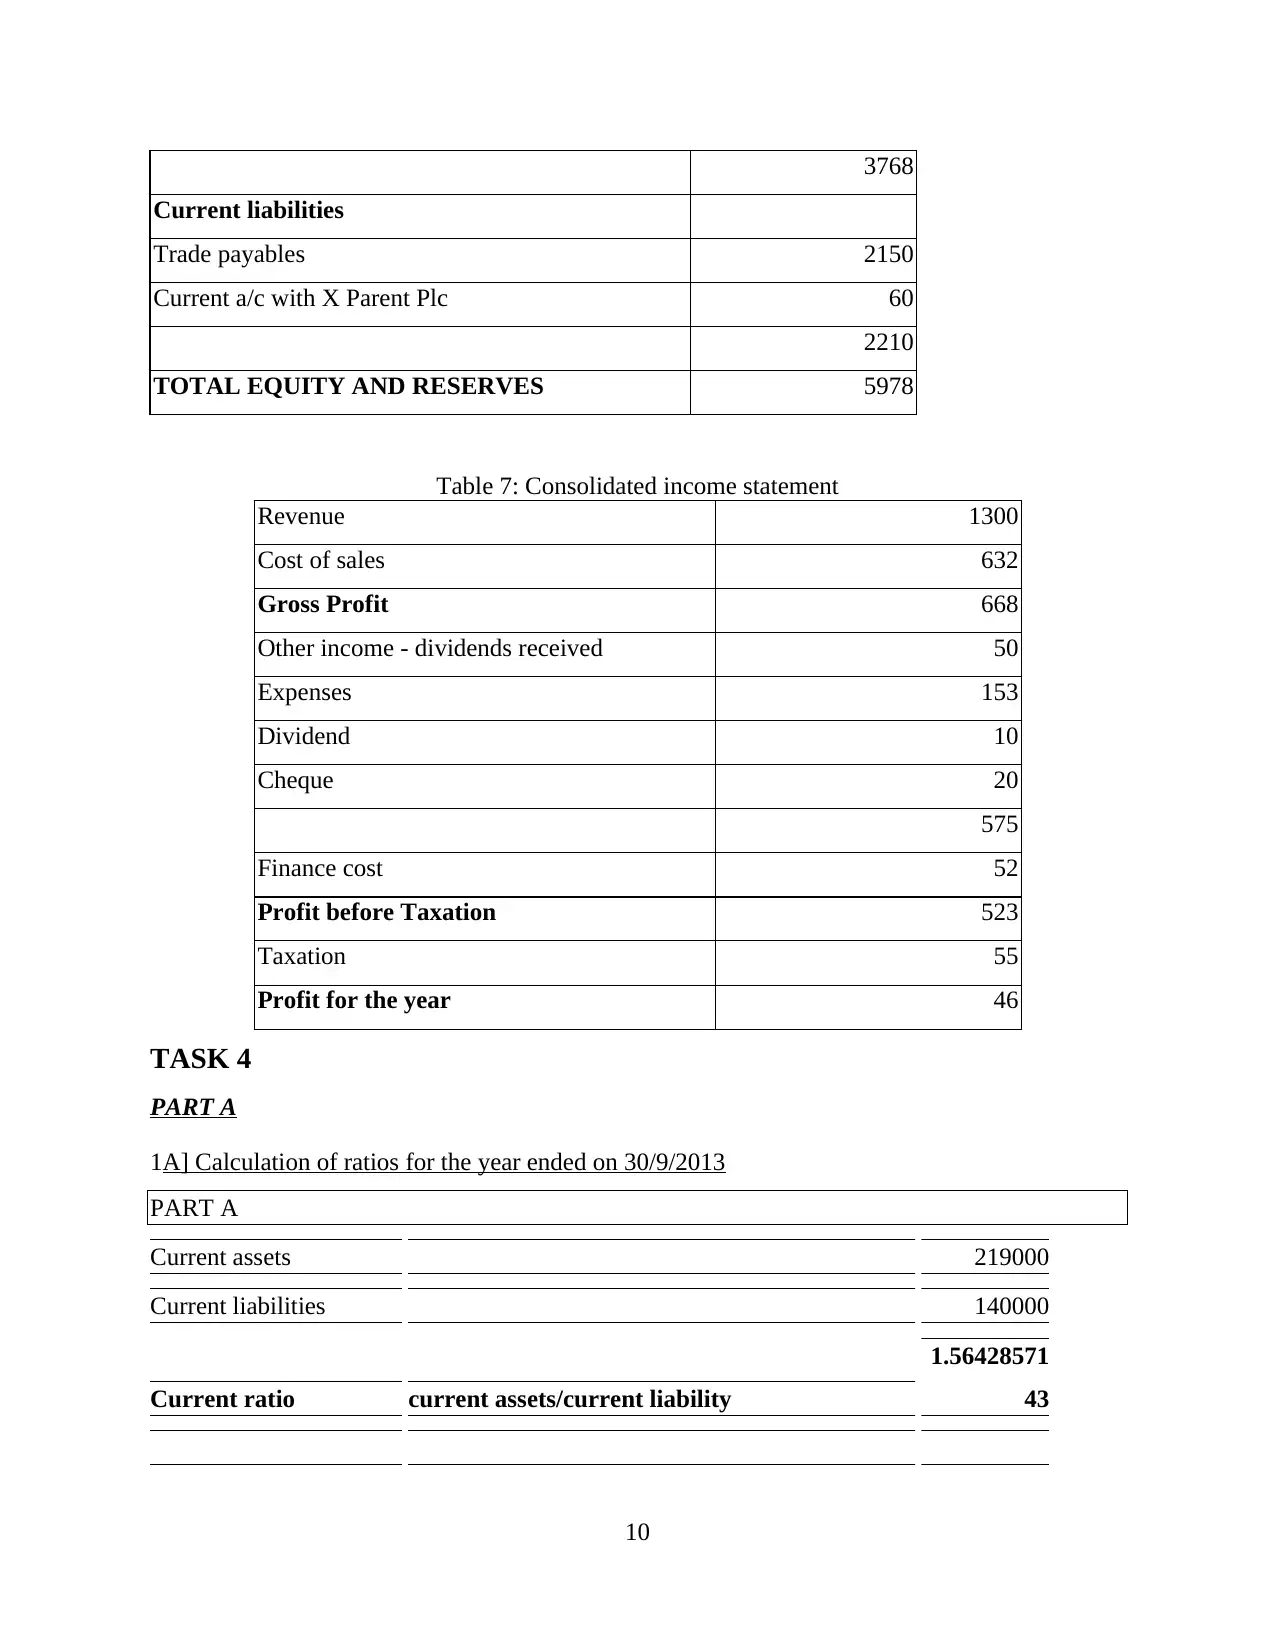
3768
Current liabilities
Trade payables 2150
Current a/c with X Parent Plc 60
2210
TOTAL EQUITY AND RESERVES 5978
Table 7: Consolidated income statement
Revenue 1300
Cost of sales 632
Gross Profit 668
Other income - dividends received 50
Expenses 153
Dividend 10
Cheque 20
575
Finance cost 52
Profit before Taxation 523
Taxation 55
Profit for the year 46
TASK 4
PART A
1A] Calculation of ratios for the year ended on 30/9/2013
PART A
Current assets 219000
Current liabilities 140000
Current ratio current assets/current liability
1.56428571
43
10
⊘ This is a preview!⊘
Do you want full access?
Subscribe today to unlock all pages.
Trusted by 1+ million students worldwide
1 out of 17
Related Documents


Your All-in-One AI-Powered Toolkit for Academic Success.
+13062052269
info@desklib.com
Available 24*7 on WhatsApp / Email
![[object Object]](/_next/static/media/star-bottom.7253800d.svg)
Unlock your academic potential
Copyright © 2020–2026 A2Z Services. All Rights Reserved. Developed and managed by ZUCOL.