Financial Management Report: Planet's Share Valuation and Investment
VerifiedAdded on 2020/12/09
|14
|4145
|326
Report
AI Summary
This financial management report delves into key aspects of corporate finance, beginning with an analysis of share valuation using the dividend growth model. The report calculates the fair price of Planet's shares under different scenarios, considering dividend growth rates and required rates of return. It examines the implications of changes in these factors on share value. The report also addresses the limitations of the dividend growth model. Furthermore, the report explores investment appraisal techniques, specifically Net Present Value (NPV) and Internal Rate of Return (IRR), to assess the economic feasibility of acquiring a machine. It provides recommendations on the project's viability and discusses the benefits and limitations of these appraisal methods, offering valuable insights for financial decision-making. The analysis includes detailed calculations and interpretations to support the recommendations.

FINANCIAL
MANAGEMENT
MANAGEMENT
Paraphrase This Document
Need a fresh take? Get an instant paraphrase of this document with our AI Paraphraser
TABLE OF CONTENTS
INTRODUCTION...........................................................................................................................1
QUESTION 1...................................................................................................................................1
(a) Calculation of fair price for Planet’s shares..........................................................................1
(b) Calculation of new price for Planet’s shares.........................................................................2
(c) Problems associated with dividend growth model as a way of valuing shares.....................3
QUESTION 3...................................................................................................................................5
(a) Recommendations related to the economic feasibility of acquiring the machine.................5
(b) Benefits and limitations of various investment appraisal techniques....................................7
CONCLUSION .............................................................................................................................10
REFERENCES..............................................................................................................................11
INTRODUCTION
Financial management is the process of planning, organizing, monitoring, directing and
controlling the financial resources of an organization. It is concerned with arrangement and
utilization of financial resources towards achievement of the organizational goals. The objectives
of financial management is profit maximization and wealth maximization of shareholders
(Schlegel, Frank and Britzelmaier, 2016)..
The purpose of this study is to make strategic business decisions with the help of
financial management. The study involves calculation of fair price of shares in different
situations. Furthermore, it involves the study of various investment appraisal techniques for
business financial and investment decision making.
QUESTION 1
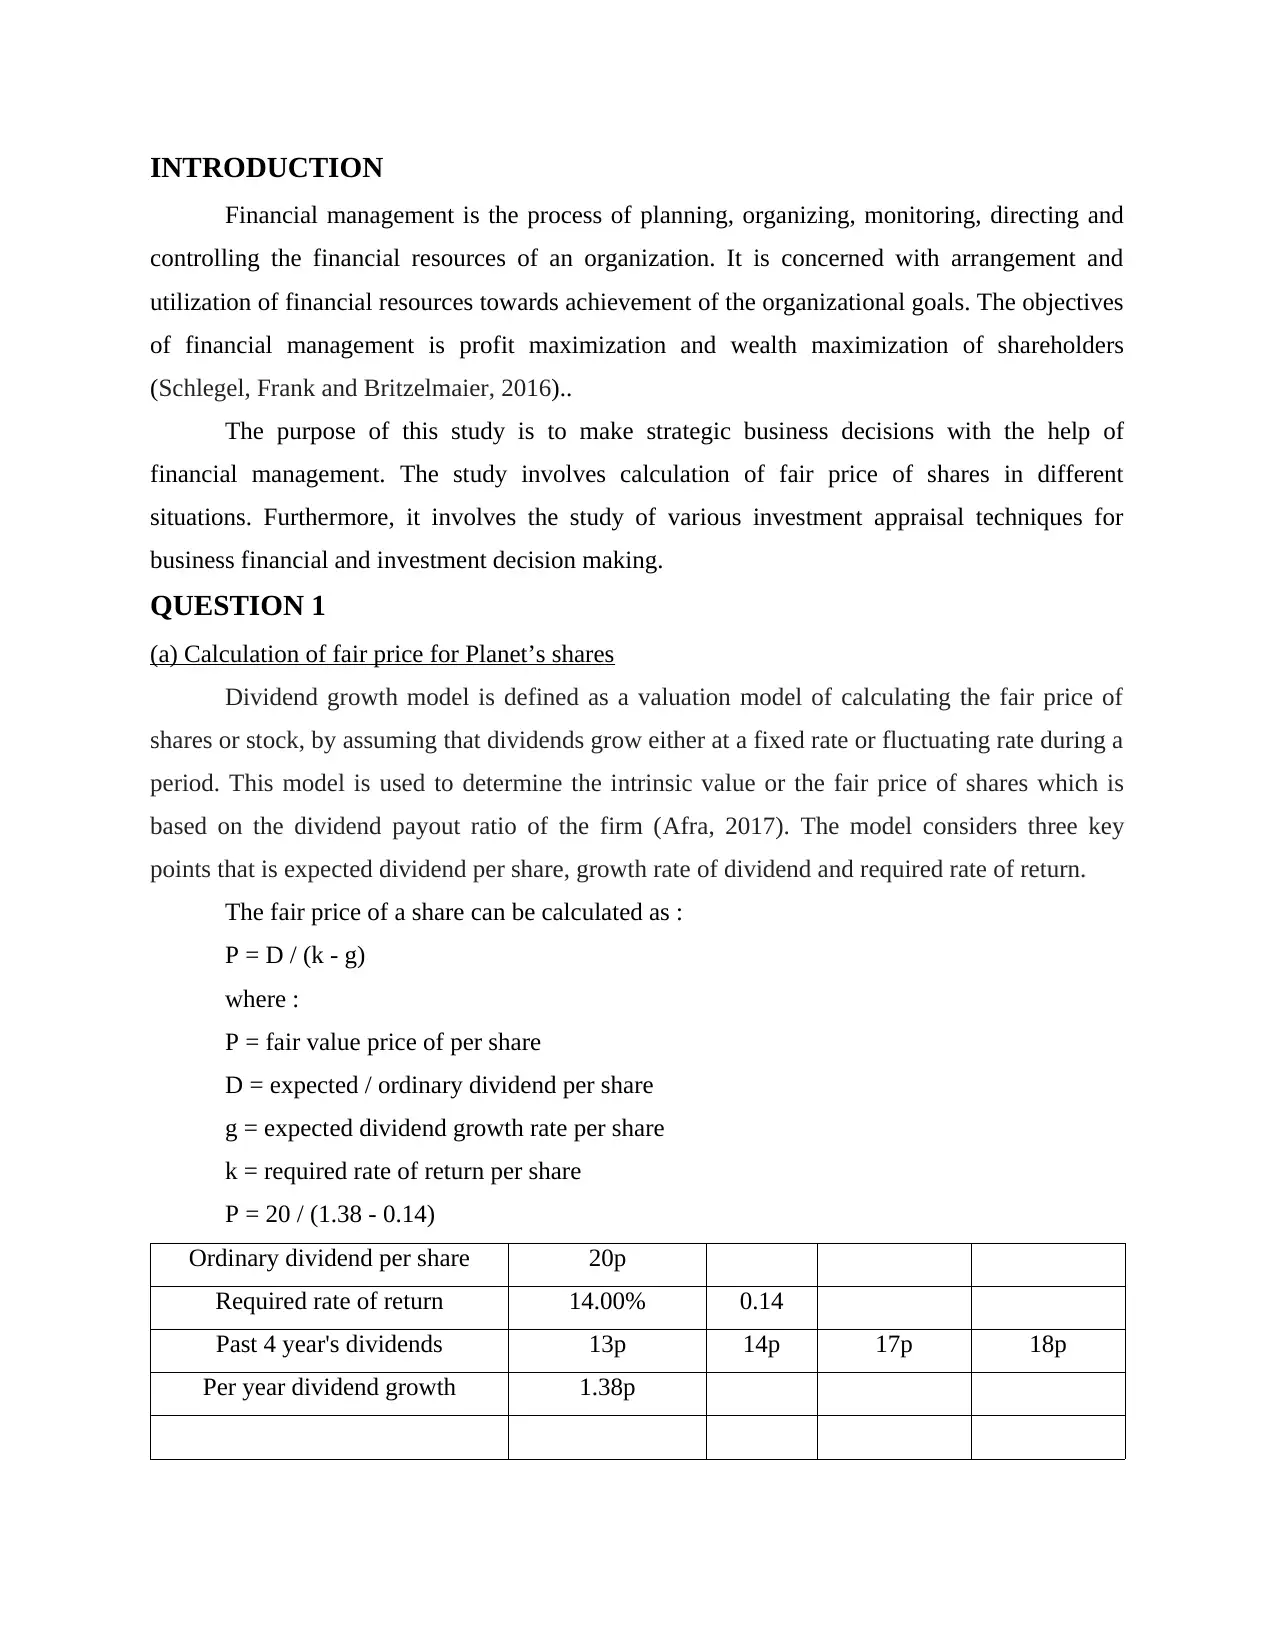
(a) Calculation of fair price for Planet’s shares
Dividend growth model is defined as a valuation model of calculating the fair price of
shares or stock, by assuming that dividends grow either at a fixed rate or fluctuating rate during a
period. This model is used to determine the intrinsic value or the fair price of shares which is
based on the dividend payout ratio of the firm (Afra, 2017). The model considers three key
points that is expected dividend per share, growth rate of dividend and required rate of return.
The fair price of a share can be calculated as :
P = D / (k - g)
where :
P = fair value price of per share
D = expected / ordinary dividend per share
g = expected dividend growth rate per share
k = required rate of return per share
P = 20 / (1.38 - 0.14)
Ordinary dividend per share 20p
Required rate of return 14.00% 0.14
Past 4 year's dividends 13p 14p 17p 18p
Per year dividend growth 1.38p
Financial management is the process of planning, organizing, monitoring, directing and
controlling the financial resources of an organization. It is concerned with arrangement and
utilization of financial resources towards achievement of the organizational goals. The objectives
of financial management is profit maximization and wealth maximization of shareholders
(Schlegel, Frank and Britzelmaier, 2016)..
The purpose of this study is to make strategic business decisions with the help of
financial management. The study involves calculation of fair price of shares in different
situations. Furthermore, it involves the study of various investment appraisal techniques for
business financial and investment decision making.
QUESTION 1
(a) Calculation of fair price for Planet’s shares
Dividend growth model is defined as a valuation model of calculating the fair price of
shares or stock, by assuming that dividends grow either at a fixed rate or fluctuating rate during a
period. This model is used to determine the intrinsic value or the fair price of shares which is
based on the dividend payout ratio of the firm (Afra, 2017). The model considers three key
points that is expected dividend per share, growth rate of dividend and required rate of return.
The fair price of a share can be calculated as :
P = D / (k - g)
where :
P = fair value price of per share
D = expected / ordinary dividend per share
g = expected dividend growth rate per share
k = required rate of return per share
P = 20 / (1.38 - 0.14)
Ordinary dividend per share 20p
Required rate of return 14.00% 0.14
Past 4 year's dividends 13p 14p 17p 18p
Per year dividend growth 1.38p
⊘ This is a preview!⊘
Do you want full access?
Subscribe today to unlock all pages.
Trusted by 1+ million students worldwide
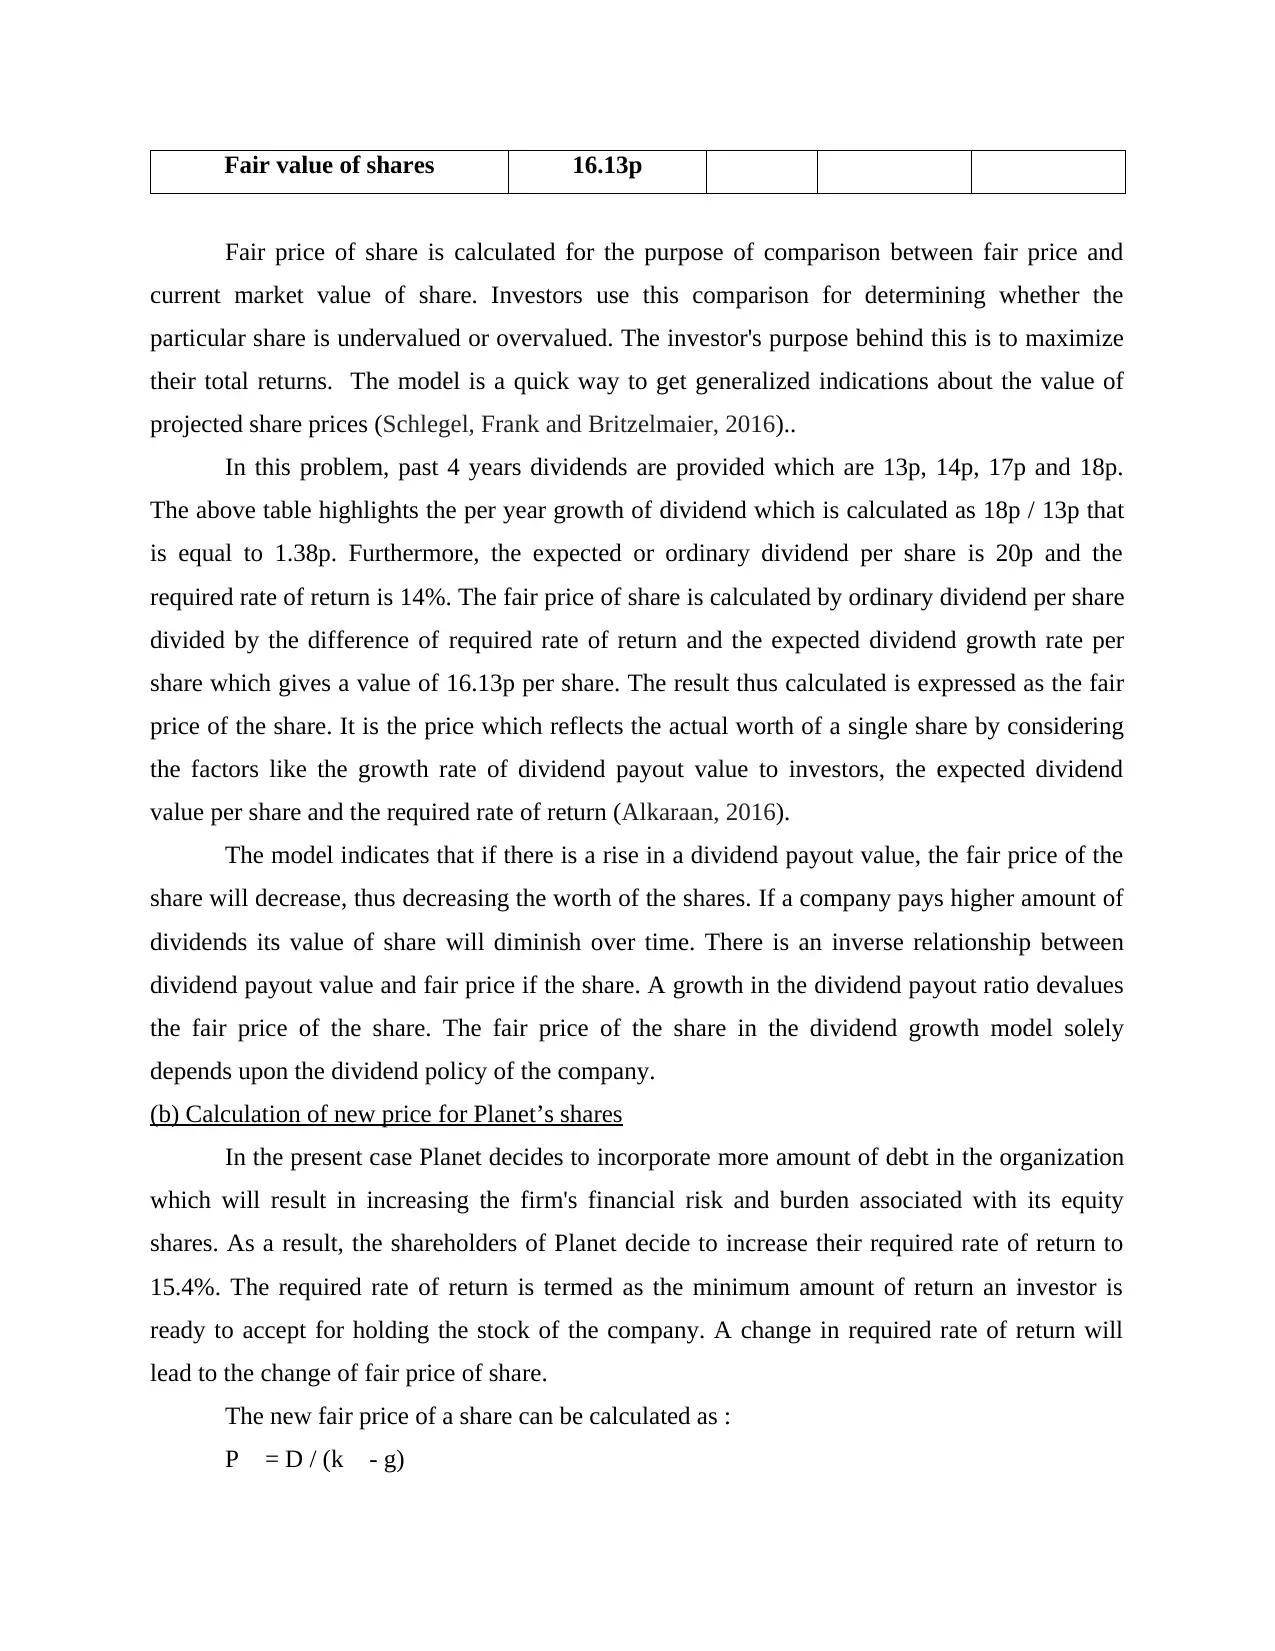
Fair value of shares 16.13p
Fair price of share is calculated for the purpose of comparison between fair price and
current market value of share. Investors use this comparison for determining whether the
particular share is undervalued or overvalued. The investor's purpose behind this is to maximize
their total returns. The model is a quick way to get generalized indications about the value of
projected share prices (Schlegel, Frank and Britzelmaier, 2016)..
In this problem, past 4 years dividends are provided which are 13p, 14p, 17p and 18p.
The above table highlights the per year growth of dividend which is calculated as 18p / 13p that
is equal to 1.38p. Furthermore, the expected or ordinary dividend per share is 20p and the
required rate of return is 14%. The fair price of share is calculated by ordinary dividend per share
divided by the difference of required rate of return and the expected dividend growth rate per
share which gives a value of 16.13p per share. The result thus calculated is expressed as the fair
price of the share. It is the price which reflects the actual worth of a single share by considering
the factors like the growth rate of dividend payout value to investors, the expected dividend
value per share and the required rate of return (Alkaraan, 2016).
The model indicates that if there is a rise in a dividend payout value, the fair price of the
share will decrease, thus decreasing the worth of the shares. If a company pays higher amount of
dividends its value of share will diminish over time. There is an inverse relationship between
dividend payout value and fair price if the share. A growth in the dividend payout ratio devalues
the fair price of the share. The fair price of the share in the dividend growth model solely
depends upon the dividend policy of the company.
(b) Calculation of new price for Planet’s shares
In the present case Planet decides to incorporate more amount of debt in the organization
which will result in increasing the firm's financial risk and burden associated with its equity
shares. As a result, the shareholders of Planet decide to increase their required rate of return to
15.4%. The required rate of return is termed as the minimum amount of return an investor is
ready to accept for holding the stock of the company. A change in required rate of return will
lead to the change of fair price of share.
The new fair price of a share can be calculated as :
P = D / (k - g)
Paraphrase This Document
Need a fresh take? Get an instant paraphrase of this document with our AI Paraphraser
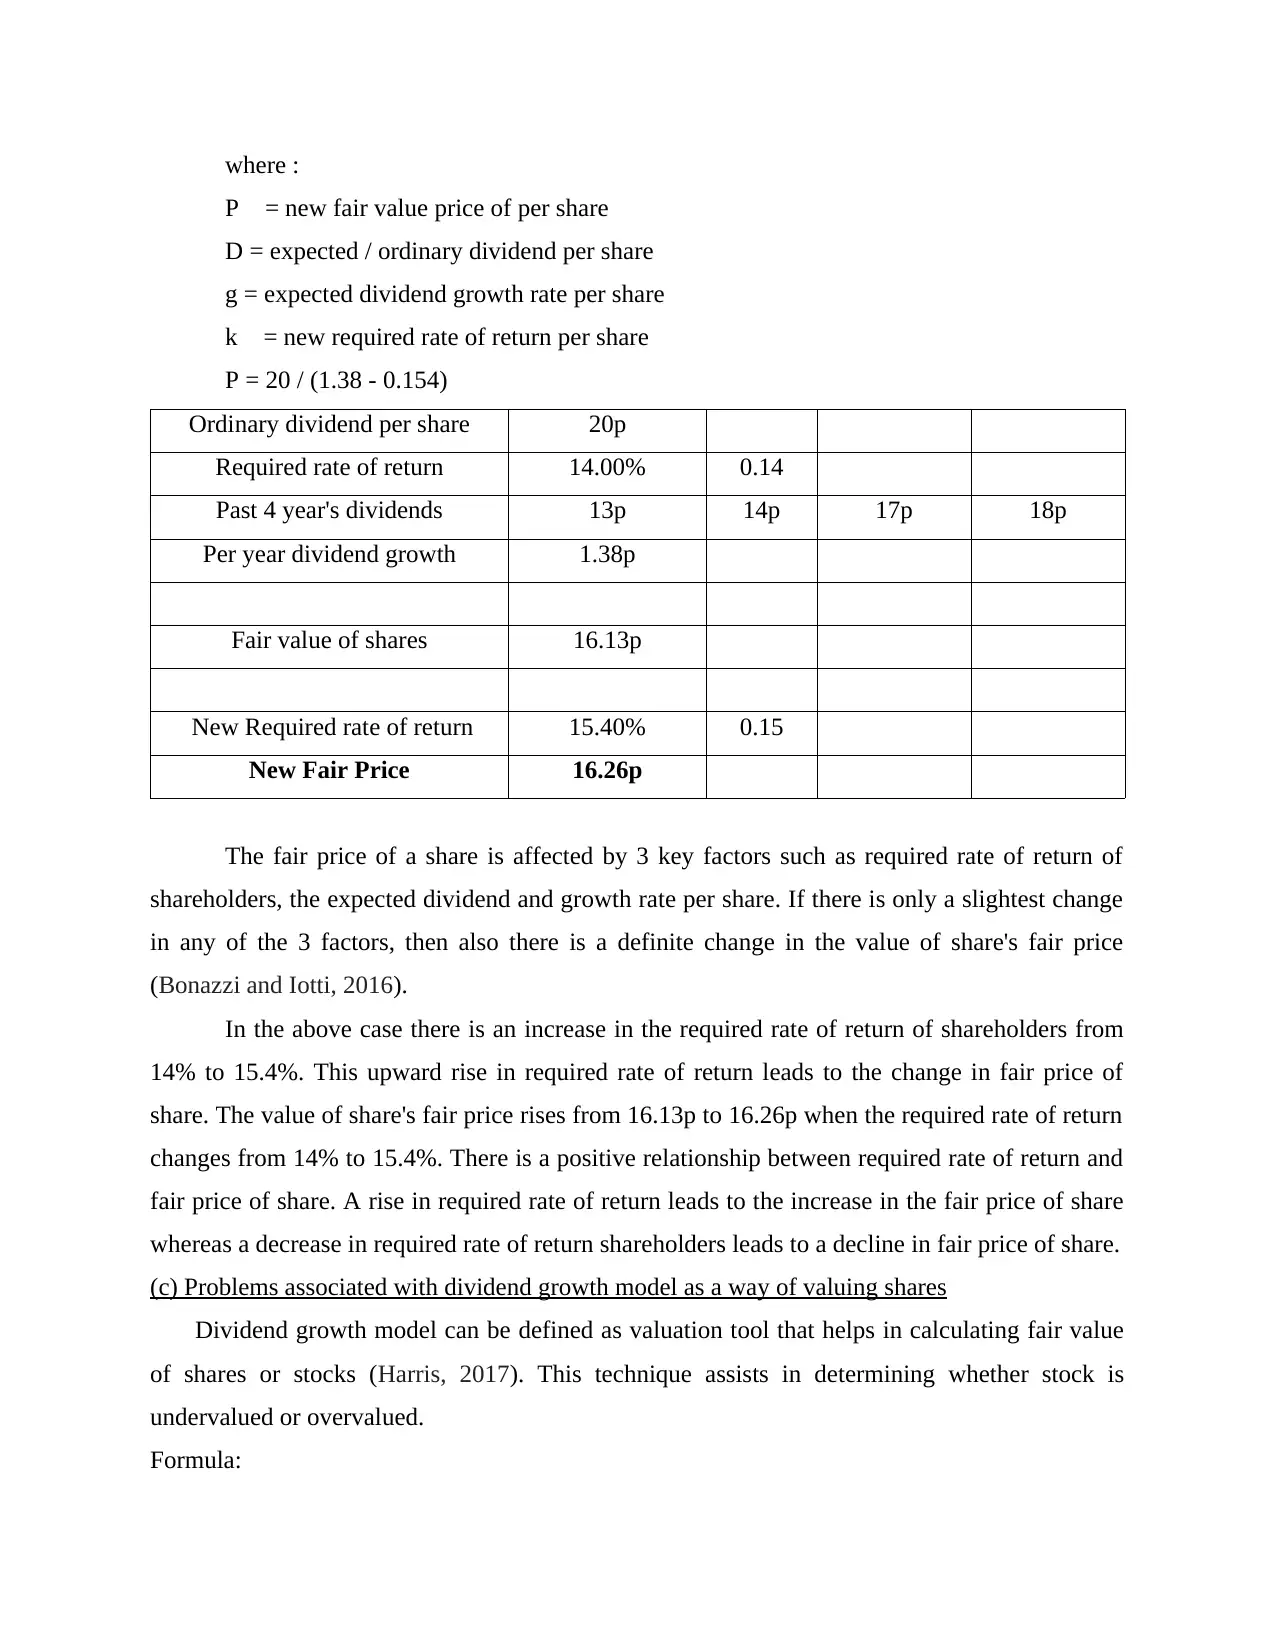
where :
P = new fair value price of per share
D = expected / ordinary dividend per share
g = expected dividend growth rate per share
k = new required rate of return per share
P = 20 / (1.38 - 0.154)
Ordinary dividend per share 20p
Required rate of return 14.00% 0.14
Past 4 year's dividends 13p 14p 17p 18p
Per year dividend growth 1.38p
Fair value of shares 16.13p
New Required rate of return 15.40% 0.15
New Fair Price 16.26p
The fair price of a share is affected by 3 key factors such as required rate of return of
shareholders, the expected dividend and growth rate per share. If there is only a slightest change
in any of the 3 factors, then also there is a definite change in the value of share's fair price
(Bonazzi and Iotti, 2016).
In the above case there is an increase in the required rate of return of shareholders from
14% to 15.4%. This upward rise in required rate of return leads to the change in fair price of
share. The value of share's fair price rises from 16.13p to 16.26p when the required rate of return
changes from 14% to 15.4%. There is a positive relationship between required rate of return and
fair price of share. A rise in required rate of return leads to the increase in the fair price of share
whereas a decrease in required rate of return shareholders leads to a decline in fair price of share.
(c) Problems associated with dividend growth model as a way of valuing shares
Dividend growth model can be defined as valuation tool that helps in calculating fair value
of shares or stocks (Harris, 2017). This technique assists in determining whether stock is
undervalued or overvalued.
Formula:
P = D1 / (R-G)
Here, P = fair share price
G = Constant growth rate
R = Constant cost of equity
D1 = Next year dividend’s value
Dividend growth model is most commonly used tool for calculating share prices. It is
simple and easily understandable (Brisley and et.al., 2016). By applying this technique
companies can compare share prices of other firms or competitors. There are many problems
associated with this model, these are explained as below:
Dividend growth model is very simple but very sensitive. As company cannot make
changes in rate of return or growth rate, small changes in these values can creates huge
changes in resultant terminal value. Hence, it is very important to forecast input very
carefully (Alkaraan, 2016). This tool much more depended upon the assumption that
growth rate of dividend per share is constant. But it is not always possible or it is rare
that firms have constant growth in dividend. Many financial difficulties can be faced by
organization that affect profitability of business to great extent thus, it is not possible to
have constant dividend growth rate. By using this technique companies cannot determine
stable growth rates (Gordon Growth Model: Pros and Cons, 2019).
Another major problem associated with dividend growth model is related with discount
factor and growth rate relationship. If rate of return < growth rate of dividend per share
then company may get negative results, in such condition it would be very difficult to
manage financial constraints and run company successfully. On other hand if rate of
return = growth rate then value per share would be infinity (Jorge-Calderón, 2016).
Non dividend factors are being ignored in calculation of share prices. These components
are such as brand loyalty, intangible asset's ownership, customer retention etc. These are
such elements that have high impact of dividend growth rate. If brand loyalty is not good
or consumers are switching the brand then in such condition it would be difficult for
business to generate profit or paying dividend to its shareholders Thus, it is essential to
considered these non-dividend factors for calculating the correct fair price of shares
otherwise results may be very (Mahmoud, 2016).
⊘ This is a preview!⊘
Do you want full access?
Subscribe today to unlock all pages.
Trusted by 1+ million students worldwide
If company is not distributing dividend (which happens many times in big organisation
whose stocks are growing well) in such condition it is very difficult to calculate dividend
growth rate thus, this model cannot apply in such kind of conditions. It is essential to
have constant growth rate, constant cost of equity, next year dividend’s value, otherwise
fair value of shares cannot be calculated by using dividend growth model (Schlegel,
Frank and Britzelmaier, 2016).
QUESTION 3
(a) Recommendations related to the economic feasibility of acquiring the machine
Net present Value
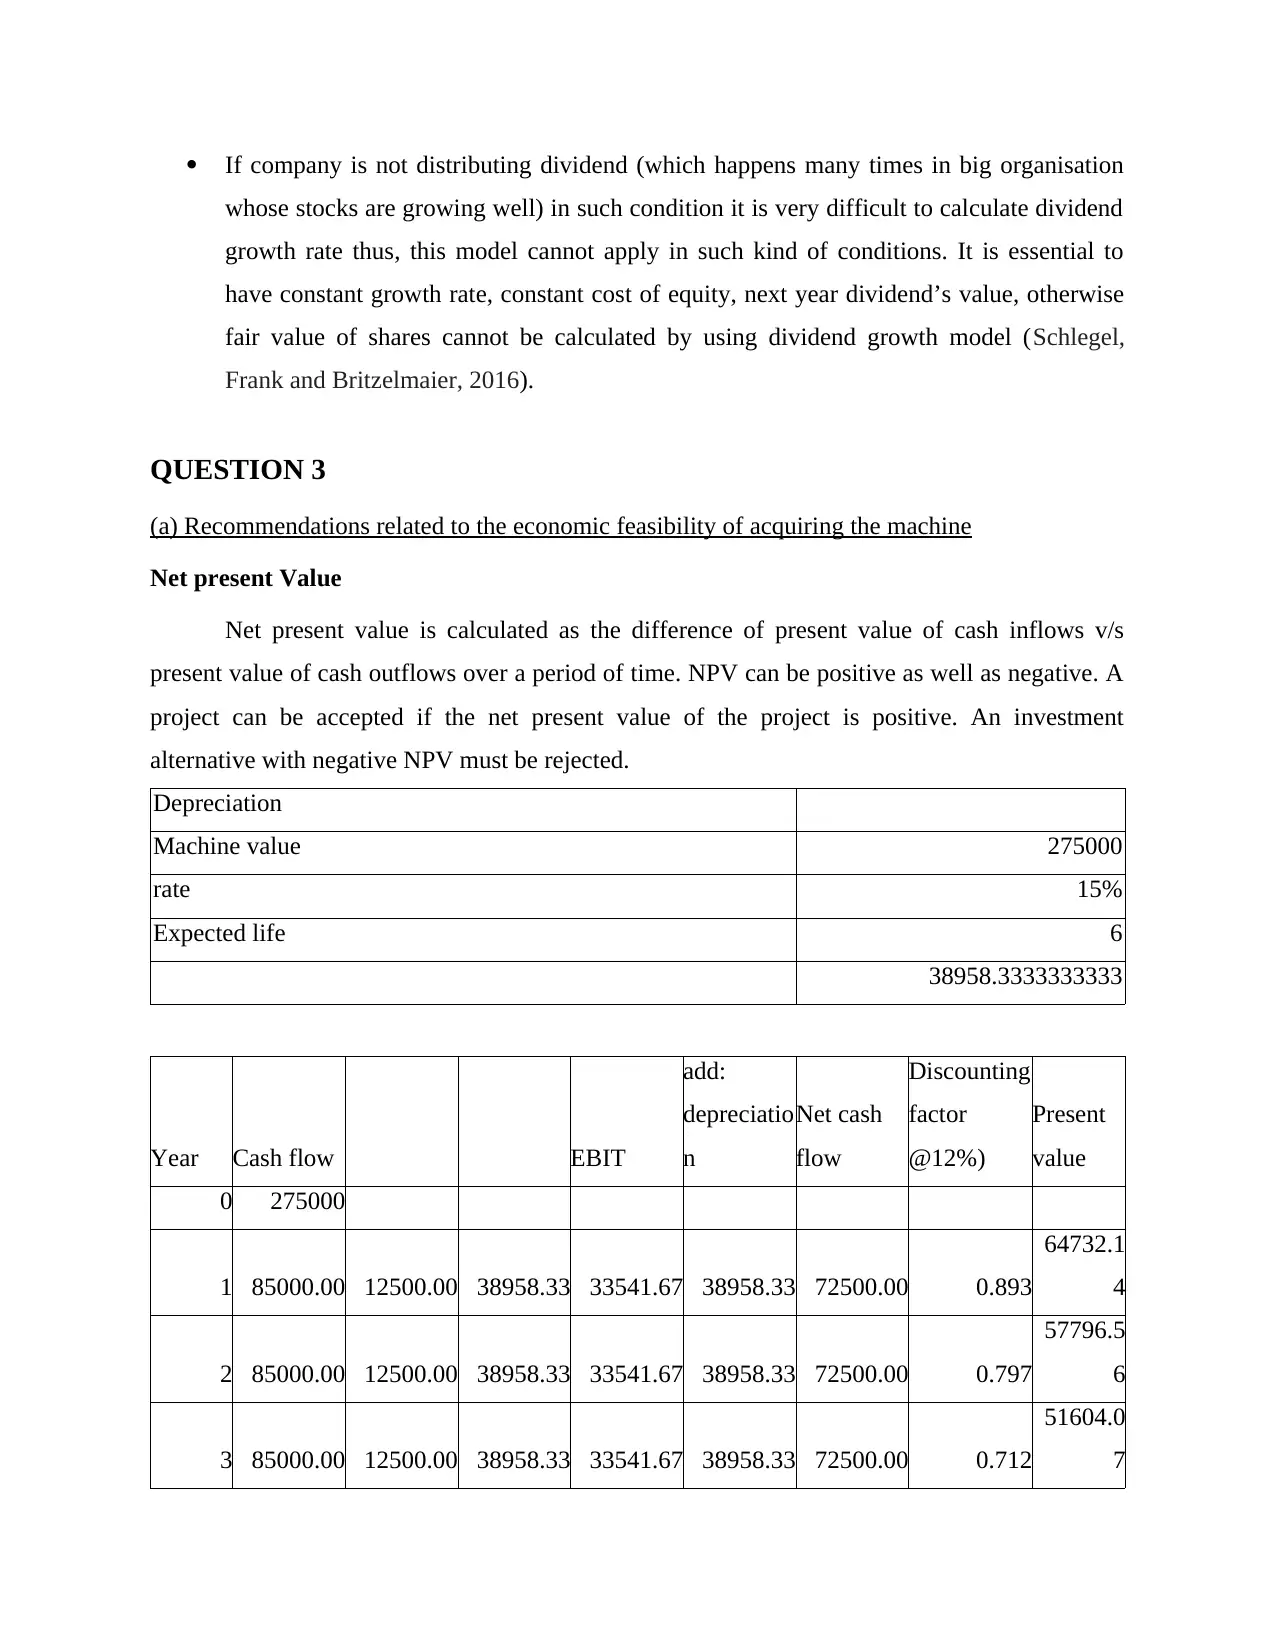
Net present value is calculated as the difference of present value of cash inflows v/s
present value of cash outflows over a period of time. NPV can be positive as well as negative. A
project can be accepted if the net present value of the project is positive. An investment
alternative with negative NPV must be rejected.
Depreciation
Machine value 275000
rate 15%
Expected life 6
38958.3333333333
Year Cash flow EBIT
add:
depreciatio
n
Net cash
flow
Discounting
factor
@12%)
Present
value
0 275000
1 85000.00 12500.00 38958.33 33541.67 38958.33 72500.00 0.893
64732.1
4
2 85000.00 12500.00 38958.33 33541.67 38958.33 72500.00 0.797
57796.5
6
3 85000.00 12500.00 38958.33 33541.67 38958.33 72500.00 0.712
51604.0
7
whose stocks are growing well) in such condition it is very difficult to calculate dividend
growth rate thus, this model cannot apply in such kind of conditions. It is essential to
have constant growth rate, constant cost of equity, next year dividend’s value, otherwise
fair value of shares cannot be calculated by using dividend growth model (Schlegel,
Frank and Britzelmaier, 2016).
QUESTION 3
(a) Recommendations related to the economic feasibility of acquiring the machine
Net present Value
Net present value is calculated as the difference of present value of cash inflows v/s
present value of cash outflows over a period of time. NPV can be positive as well as negative. A
project can be accepted if the net present value of the project is positive. An investment
alternative with negative NPV must be rejected.
Depreciation
Machine value 275000
rate 15%
Expected life 6
38958.3333333333
Year Cash flow EBIT
add:
depreciatio
n
Net cash
flow
Discounting
factor
@12%)
Present
value
0 275000
1 85000.00 12500.00 38958.33 33541.67 38958.33 72500.00 0.893
64732.1
4
2 85000.00 12500.00 38958.33 33541.67 38958.33 72500.00 0.797
57796.5
6
3 85000.00 12500.00 38958.33 33541.67 38958.33 72500.00 0.712
51604.0
7
Paraphrase This Document
Need a fresh take? Get an instant paraphrase of this document with our AI Paraphraser
4 85000.00 12500.00 38958.33 33541.67 38958.33 72500.00 0.636
46075.0
6
5 85000.00 12500.00 38958.33 33541.67 38958.33 72500.00 0.567
41138.4
5
6 85000.00 12500.00 38958.33 33541.67 38958.33 72500.00 0.507
36730.7
6
Total
PV
298077.
03
less:
Initial
investm
ent 72500
275000.
00
NPV 313958.33
23077.0
3
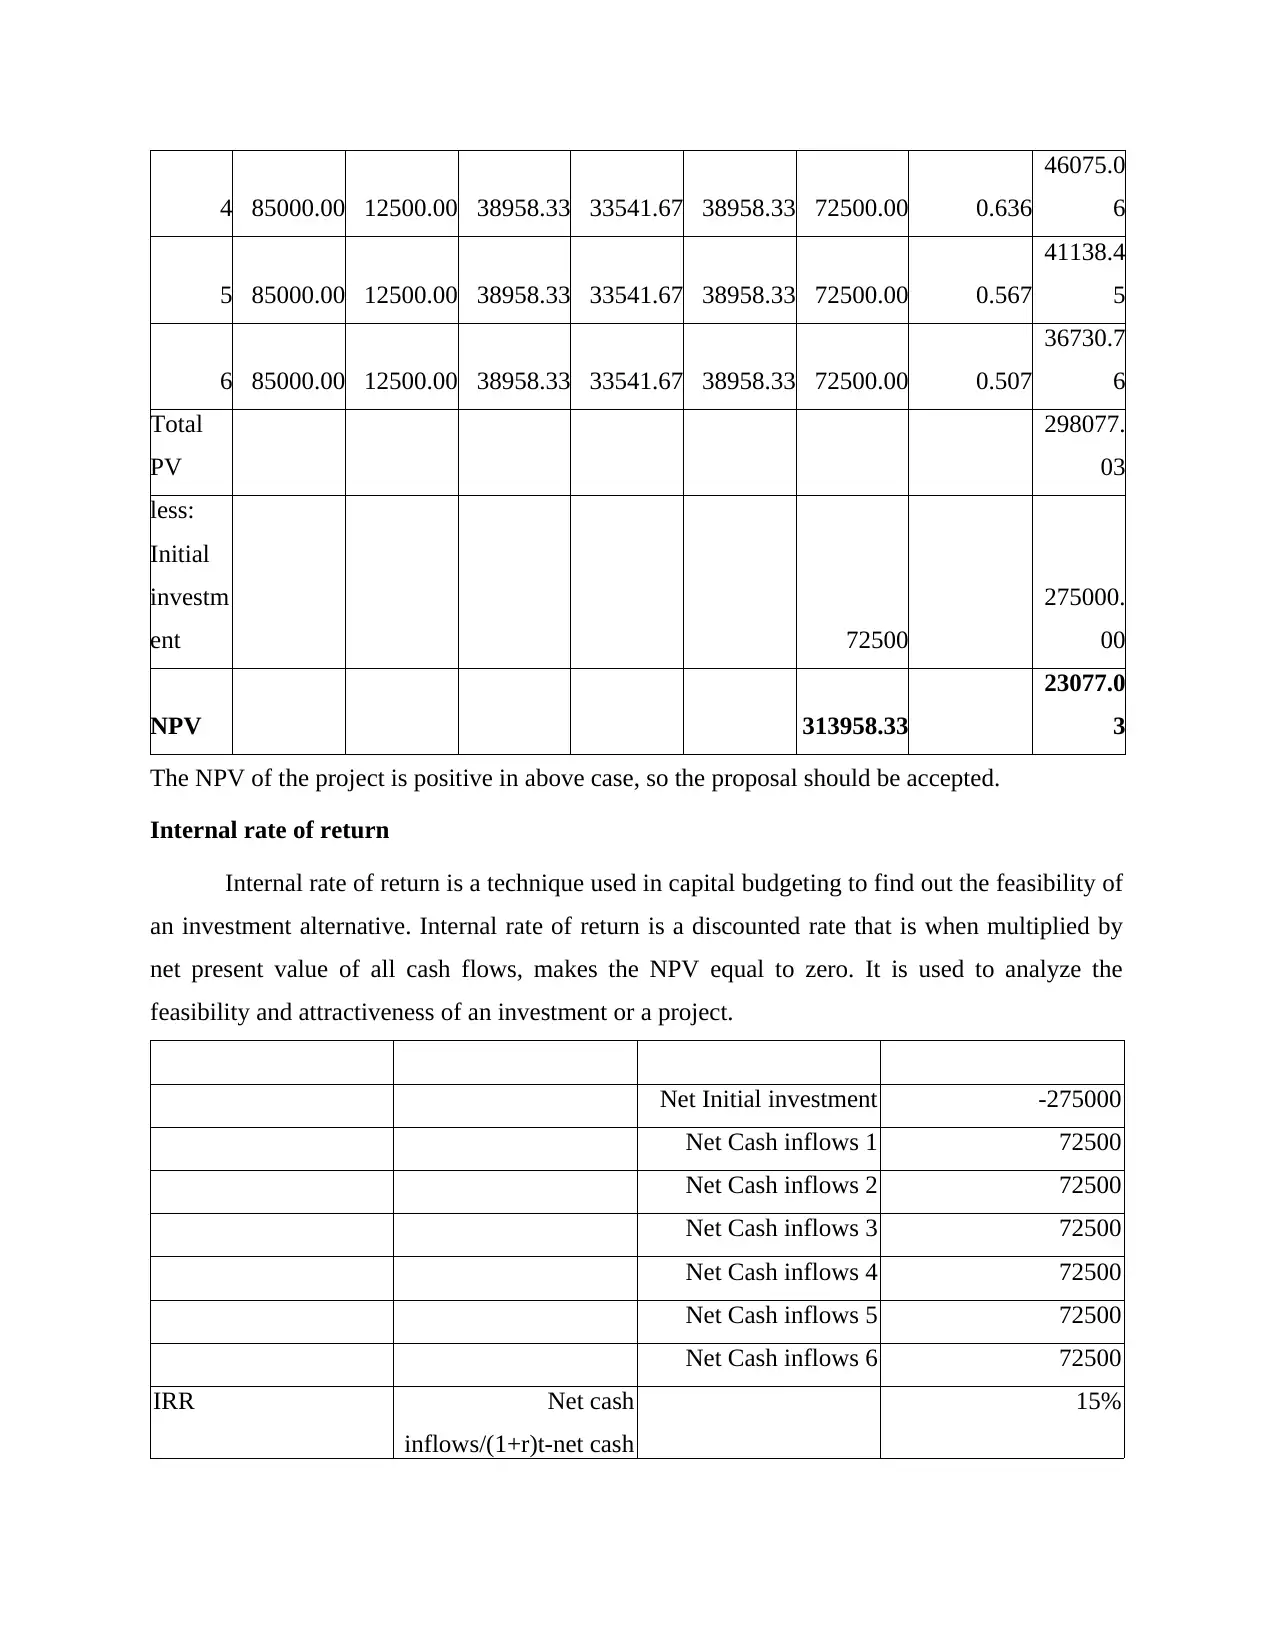
The NPV of the project is positive in above case, so the proposal should be accepted.
Internal rate of return
Internal rate of return is a technique used in capital budgeting to find out the feasibility of
an investment alternative. Internal rate of return is a discounted rate that is when multiplied by
net present value of all cash flows, makes the NPV equal to zero. It is used to analyze the
feasibility and attractiveness of an investment or a project.
Net Initial investment -275000
Net Cash inflows 1 72500
Net Cash inflows 2 72500
Net Cash inflows 3 72500
Net Cash inflows 4 72500
Net Cash inflows 5 72500
Net Cash inflows 6 72500
IRR Net cash
inflows/(1+r)t-net cash
15%
46075.0
6
5 85000.00 12500.00 38958.33 33541.67 38958.33 72500.00 0.567
41138.4
5
6 85000.00 12500.00 38958.33 33541.67 38958.33 72500.00 0.507
36730.7
6
Total
PV
298077.
03
less:
Initial
investm
ent 72500
275000.
00
NPV 313958.33
23077.0
3
The NPV of the project is positive in above case, so the proposal should be accepted.
Internal rate of return
Internal rate of return is a technique used in capital budgeting to find out the feasibility of
an investment alternative. Internal rate of return is a discounted rate that is when multiplied by
net present value of all cash flows, makes the NPV equal to zero. It is used to analyze the
feasibility and attractiveness of an investment or a project.
Net Initial investment -275000
Net Cash inflows 1 72500
Net Cash inflows 2 72500
Net Cash inflows 3 72500
Net Cash inflows 4 72500
Net Cash inflows 5 72500
Net Cash inflows 6 72500
IRR Net cash
inflows/(1+r)t-net cash
15%
outflow
Accounting rate of return
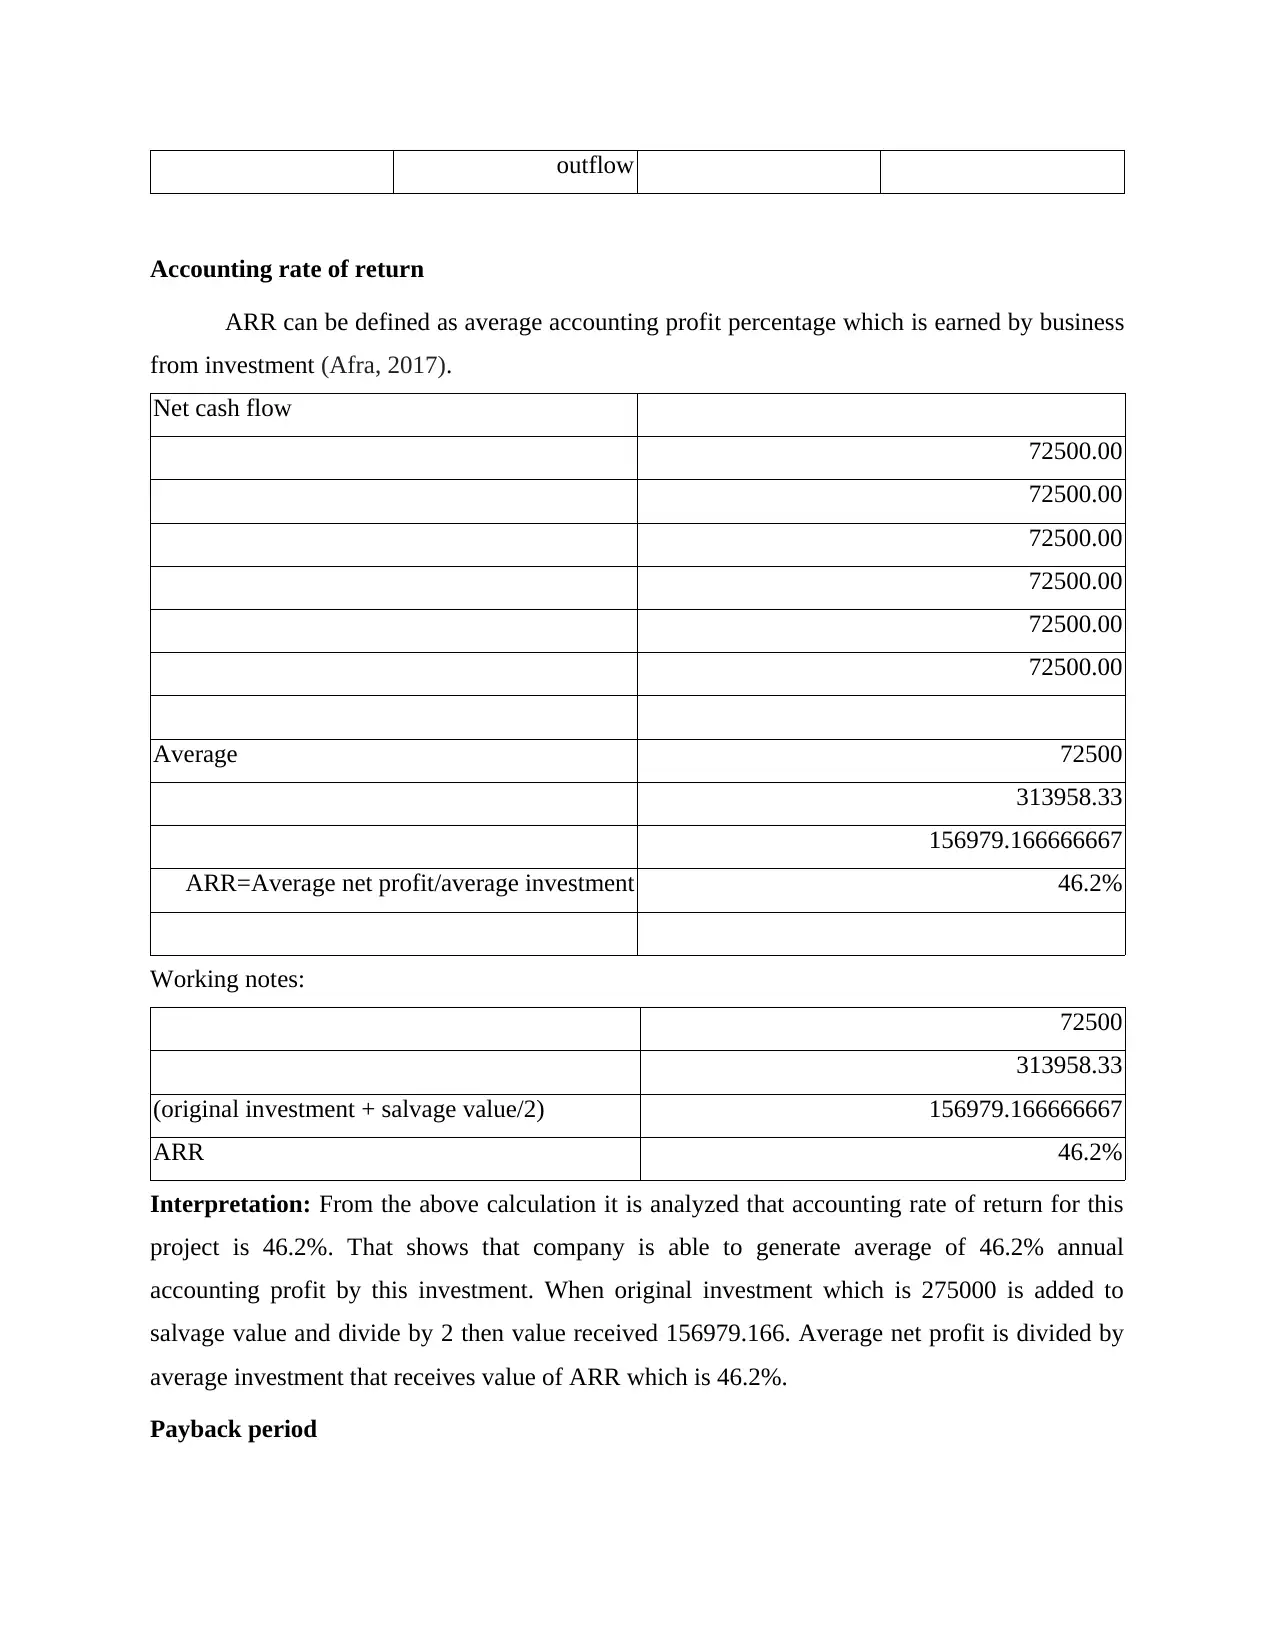
ARR can be defined as average accounting profit percentage which is earned by business
from investment (Afra, 2017).
Net cash flow
72500.00
72500.00
72500.00
72500.00
72500.00
72500.00
Average 72500
313958.33
156979.166666667
ARR=Average net profit/average investment 46.2%
Working notes:
72500
313958.33
(original investment + salvage value/2) 156979.166666667
ARR 46.2%
Interpretation: From the above calculation it is analyzed that accounting rate of return for this
project is 46.2%. That shows that company is able to generate average of 46.2% annual
accounting profit by this investment. When original investment which is 275000 is added to
salvage value and divide by 2 then value received 156979.166. Average net profit is divided by
average investment that receives value of ARR which is 46.2%.
Payback period
Accounting rate of return
ARR can be defined as average accounting profit percentage which is earned by business
from investment (Afra, 2017).
Net cash flow
72500.00
72500.00
72500.00
72500.00
72500.00
72500.00
Average 72500
313958.33
156979.166666667
ARR=Average net profit/average investment 46.2%
Working notes:
72500
313958.33
(original investment + salvage value/2) 156979.166666667
ARR 46.2%
Interpretation: From the above calculation it is analyzed that accounting rate of return for this
project is 46.2%. That shows that company is able to generate average of 46.2% annual
accounting profit by this investment. When original investment which is 275000 is added to
salvage value and divide by 2 then value received 156979.166. Average net profit is divided by
average investment that receives value of ARR which is 46.2%.
Payback period
⊘ This is a preview!⊘
Do you want full access?
Subscribe today to unlock all pages.
Trusted by 1+ million students worldwide
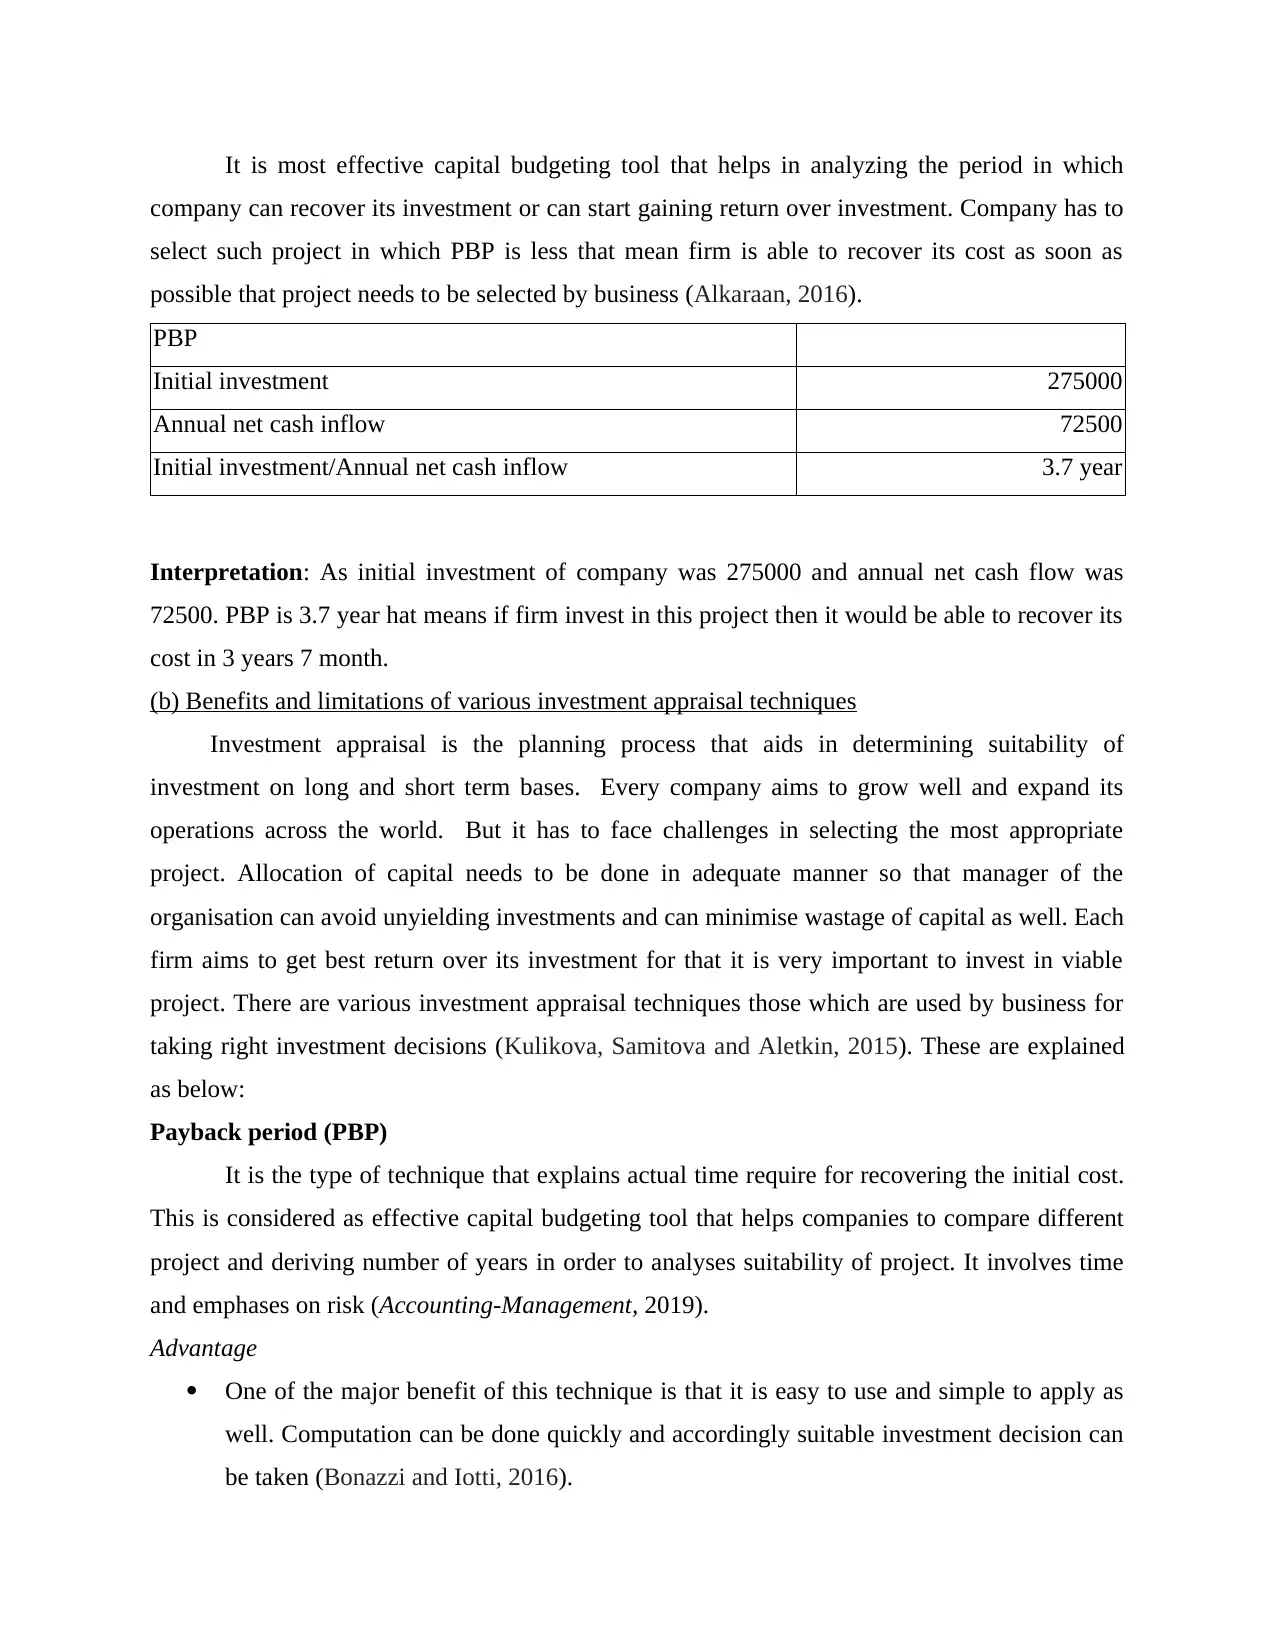
It is most effective capital budgeting tool that helps in analyzing the period in which
company can recover its investment or can start gaining return over investment. Company has to
select such project in which PBP is less that mean firm is able to recover its cost as soon as
possible that project needs to be selected by business (Alkaraan, 2016).
PBP
Initial investment 275000
Annual net cash inflow 72500
Initial investment/Annual net cash inflow 3.7 year
Interpretation: As initial investment of company was 275000 and annual net cash flow was
72500. PBP is 3.7 year hat means if firm invest in this project then it would be able to recover its
cost in 3 years 7 month.
(b) Benefits and limitations of various investment appraisal techniques
Investment appraisal is the planning process that aids in determining suitability of
investment on long and short term bases. Every company aims to grow well and expand its
operations across the world. But it has to face challenges in selecting the most appropriate
project. Allocation of capital needs to be done in adequate manner so that manager of the
organisation can avoid unyielding investments and can minimise wastage of capital as well. Each
firm aims to get best return over its investment for that it is very important to invest in viable
project. There are various investment appraisal techniques those which are used by business for
taking right investment decisions (Kulikova, Samitova and Aletkin, 2015). These are explained
as below:
Payback period (PBP)
It is the type of technique that explains actual time require for recovering the initial cost.
This is considered as effective capital budgeting tool that helps companies to compare different
project and deriving number of years in order to analyses suitability of project. It involves time
and emphases on risk (Accounting-Management, 2019).
Advantage
One of the major benefit of this technique is that it is easy to use and simple to apply as
well. Computation can be done quickly and accordingly suitable investment decision can
be taken (Bonazzi and Iotti, 2016).
Paraphrase This Document
Need a fresh take? Get an instant paraphrase of this document with our AI Paraphraser
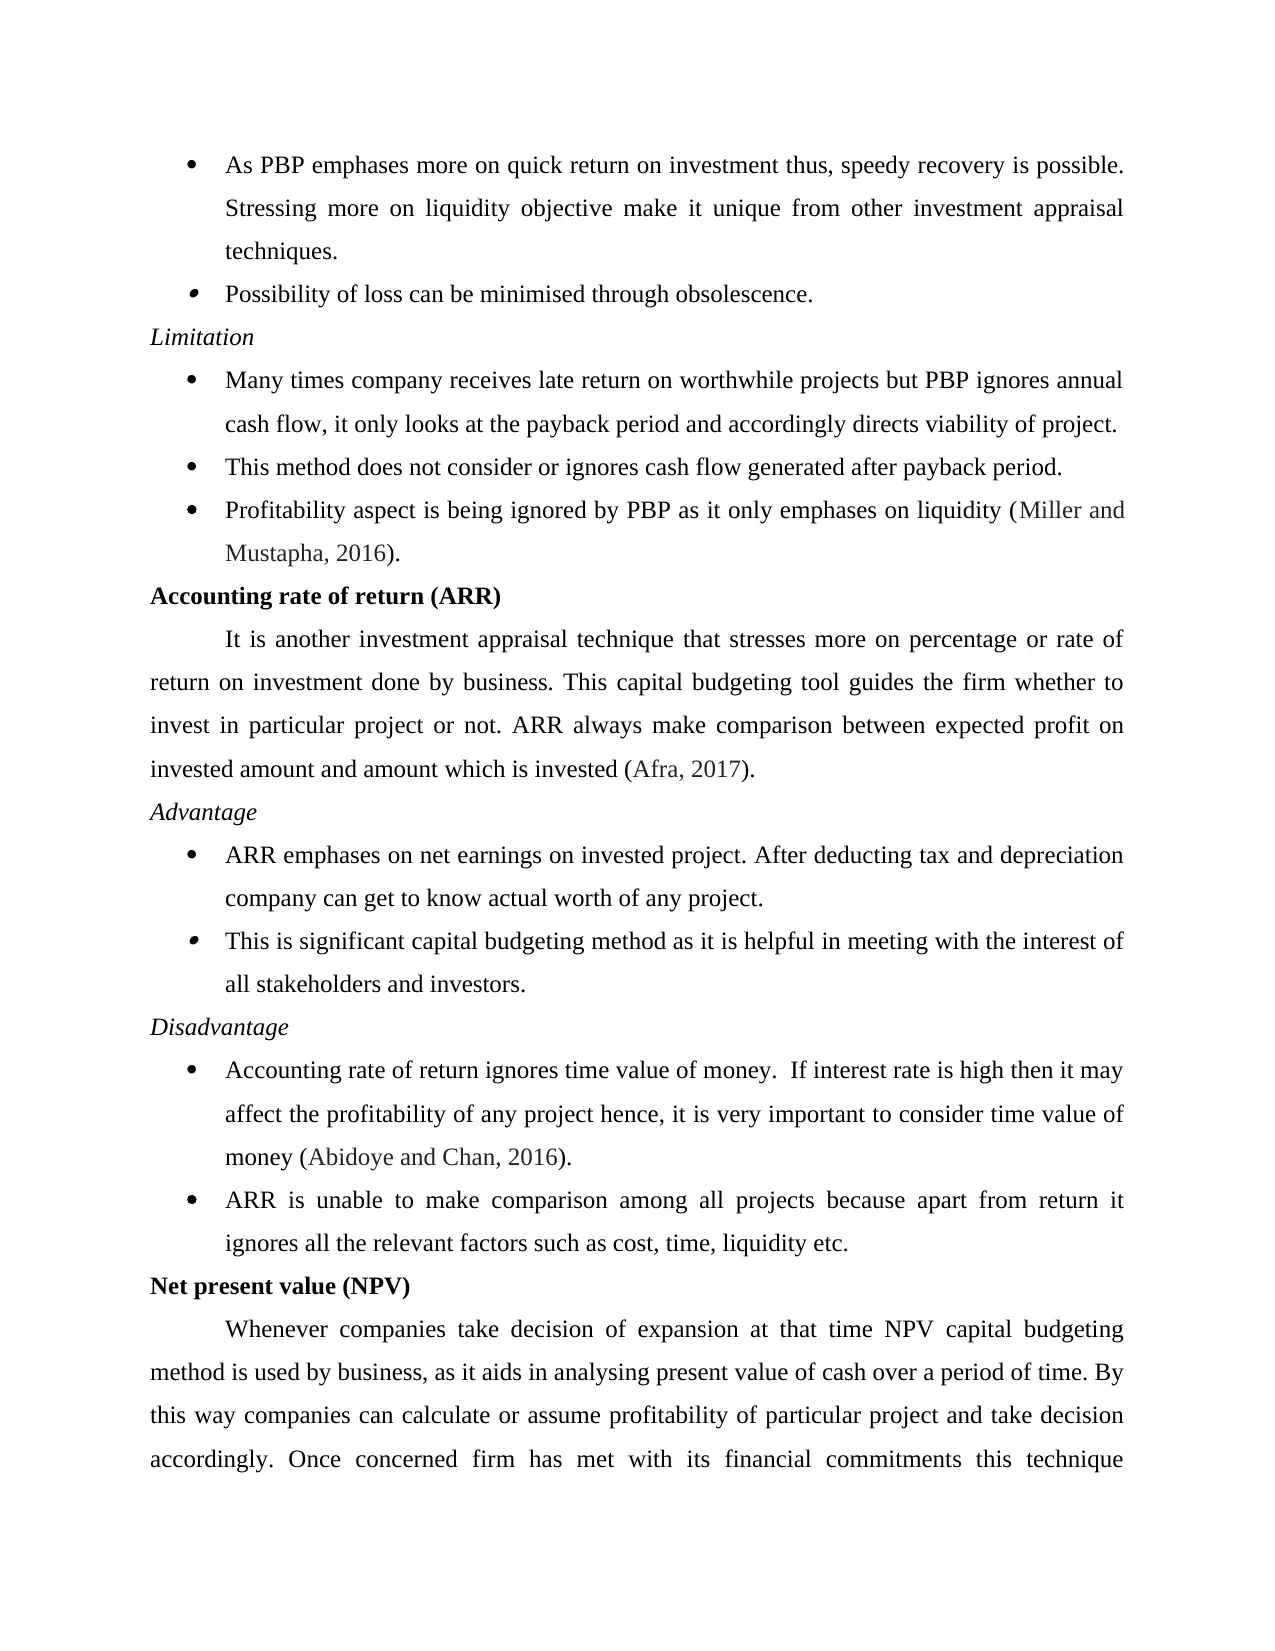
As PBP emphases more on quick return on investment thus, speedy recovery is possible.
Stressing more on liquidity objective make it unique from other investment appraisal
techniques. Possibility of loss can be minimised through obsolescence.
Limitation
Many times company receives late return on worthwhile projects but PBP ignores annual
cash flow, it only looks at the payback period and accordingly directs viability of project.
This method does not consider or ignores cash flow generated after payback period.
Profitability aspect is being ignored by PBP as it only emphases on liquidity (Miller and
Mustapha, 2016).
Accounting rate of return (ARR)
It is another investment appraisal technique that stresses more on percentage or rate of
return on investment done by business. This capital budgeting tool guides the firm whether to
invest in particular project or not. ARR always make comparison between expected profit on
invested amount and amount which is invested (Afra, 2017).
Advantage
ARR emphases on net earnings on invested project. After deducting tax and depreciation
company can get to know actual worth of any project. This is significant capital budgeting method as it is helpful in meeting with the interest of
all stakeholders and investors.
Disadvantage
Accounting rate of return ignores time value of money. If interest rate is high then it may
affect the profitability of any project hence, it is very important to consider time value of
money (Abidoye and Chan, 2016).
ARR is unable to make comparison among all projects because apart from return it
ignores all the relevant factors such as cost, time, liquidity etc.
Net present value (NPV)
Whenever companies take decision of expansion at that time NPV capital budgeting
method is used by business, as it aids in analysing present value of cash over a period of time. By
this way companies can calculate or assume profitability of particular project and take decision
accordingly. Once concerned firm has met with its financial commitments this technique
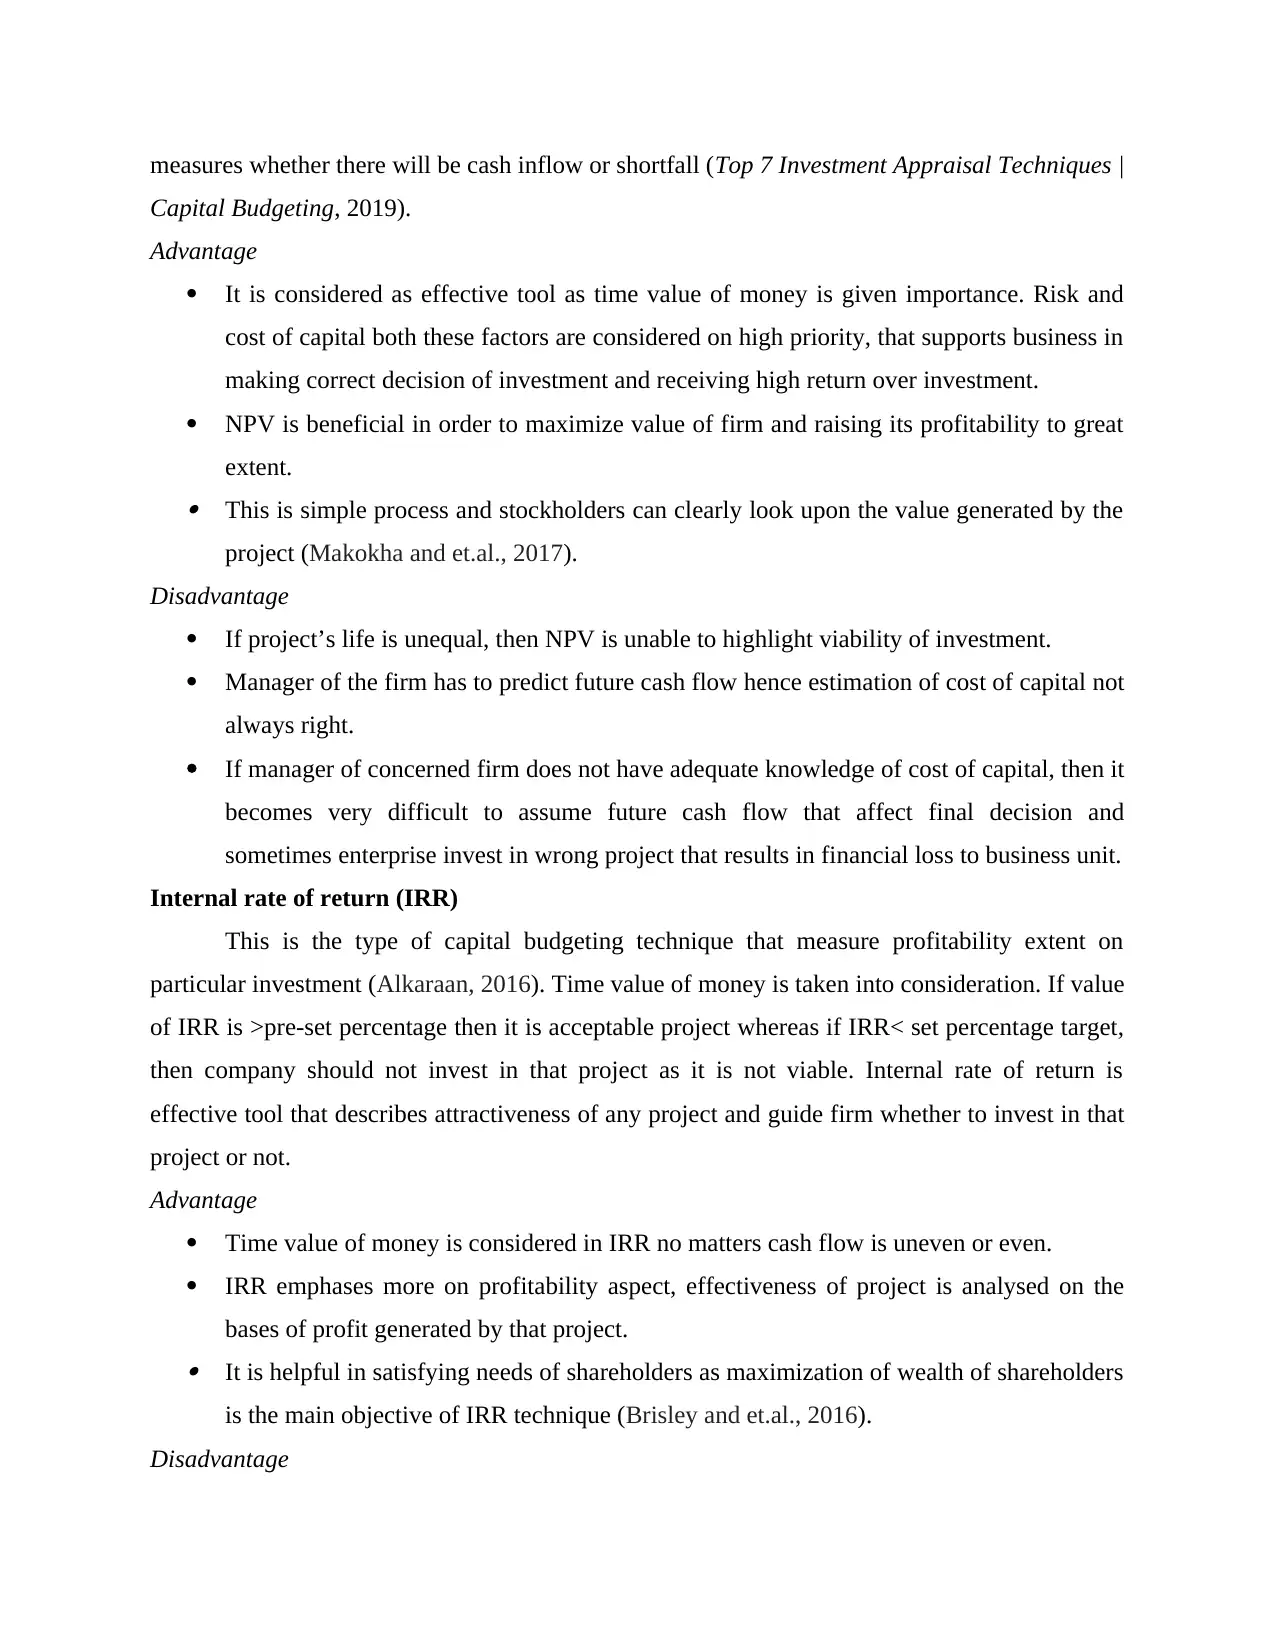
measures whether there will be cash inflow or shortfall (Top 7 Investment Appraisal Techniques |
Capital Budgeting, 2019).
Advantage
It is considered as effective tool as time value of money is given importance. Risk and
cost of capital both these factors are considered on high priority, that supports business in
making correct decision of investment and receiving high return over investment.
NPV is beneficial in order to maximize value of firm and raising its profitability to great
extent. This is simple process and stockholders can clearly look upon the value generated by the
project (Makokha and et.al., 2017).
Disadvantage
If project’s life is unequal, then NPV is unable to highlight viability of investment.
Manager of the firm has to predict future cash flow hence estimation of cost of capital not
always right.
If manager of concerned firm does not have adequate knowledge of cost of capital, then it
becomes very difficult to assume future cash flow that affect final decision and
sometimes enterprise invest in wrong project that results in financial loss to business unit.
Internal rate of return (IRR)
This is the type of capital budgeting technique that measure profitability extent on
particular investment (Alkaraan, 2016). Time value of money is taken into consideration. If value
of IRR is >pre-set percentage then it is acceptable project whereas if IRR< set percentage target,
then company should not invest in that project as it is not viable. Internal rate of return is
effective tool that describes attractiveness of any project and guide firm whether to invest in that
project or not.
Advantage
Time value of money is considered in IRR no matters cash flow is uneven or even.
IRR emphases more on profitability aspect, effectiveness of project is analysed on the
bases of profit generated by that project. It is helpful in satisfying needs of shareholders as maximization of wealth of shareholders
is the main objective of IRR technique (Brisley and et.al., 2016).
Disadvantage
⊘ This is a preview!⊘
Do you want full access?
Subscribe today to unlock all pages.
Trusted by 1+ million students worldwide
1 out of 14
Related Documents


Your All-in-One AI-Powered Toolkit for Academic Success.
+13062052269
info@desklib.com
Available 24*7 on WhatsApp / Email
![[object Object]](/_next/static/media/star-bottom.7253800d.svg)
Unlock your academic potential
Copyright © 2020–2026 A2Z Services. All Rights Reserved. Developed and managed by ZUCOL.