Financial Management Assessment 2: Budgeting, Performance, and Risk
VerifiedAdded on 2020/01/16
|16
|4630
|485
Report
AI Summary
This report presents a comprehensive analysis of financial management principles, focusing on budgeting and performance evaluation for a motorcycle company. It begins with an operational budget that includes sales forecasting for 2013 and a proposed budget for 2014, along with variance analysis. The report delves into stakeholder analysis, outlining the interests of internal and external stakeholders in the budgeting process. It then explores operational budgets, covering inventory, cost of goods sold, and expense budgets by cost center, along with a comparative profit and loss statement. A key component is risk management, with a detailed risk schedule identifying potential threats and mitigation strategies. The report extends to a service business budget, calculating productive hours and break-even points. Finally, it addresses performance monitoring through revenue comparative statements, key performance indicators, forecasting concepts, and staff motivation strategies, culminating in a financial analysis section.

FINANCIAL MANAGEMENT
(ASSESSMENT 2)
1
(ASSESSMENT 2)
1
Paraphrase This Document
Need a fresh take? Get an instant paraphrase of this document with our AI Paraphraser
Table of Contents
INTRODUCTION................................................................................................................................4
TASK 1 OPERATIONAL BUDGET – SALES REVENUE................................................................4
PART A BUDGETING FOR YEAR 2014...........................................................................................4
1 Sales Forecast for each Quarter of 2013 and a Budget for each Quarter for the 2014 year........4
2 Comparative Statement of Forecast Sales Revenue for 2013 Budget for 2014 and the Variance 4
PART B REPORTING TO MANAGEMENT......................................................................................5
1. Expected Outcomes and Assumptions.........................................................................................5
2.Internal and External stakeholders................................................................................................5
3.Approaches and Factors for preparing the Budgets......................................................................6
TASK 2 – OPERATIONAL BUDGETS..............................................................................................6
PART A INVENTORY AND COST OF GOODS SOLD...................................................................6
PART B - EXPENSE BUDGET BY COST CENTRE.........................................................................7
1. Expense Budget by Cost Centre..................................................................................................7
2. Comparative Profit and Loss Statement......................................................................................8
PART C – RISK MANAGEMENT......................................................................................................9
Risk Schedule..................................................................................................................................9
TASK 3 Budget – SERVICE BUSINESS..........................................................................................10
PART A...............................................................................................................................................10
1. Calculation of Total Productive hours available to be charged out to the clients.....................10
2. Calculation of average charge per hour.....................................................................................11
3. Complete a brief P&L account for the business.........................................................................11
4. Calculation of productive hours to achieve break-even point...................................................12
PART B...............................................................................................................................................12
TASK 4- MONITORING PERFORMANCE....................................................................................12
1. Calculation of Revenue Comparative Statement.......................................................................12
2. Key points or questions to rise in order to gain an understanding of the business performance
.......................................................................................................................................................13
3. Concept of forecasting and its importance................................................................................13
4. Actions needs to communicate, monitor and motivate staff......................................................13
TASK 5 – MONITORING PERFORMANCE – FINANCIAL ANALYSIS.....................................14
CONCLUSION..................................................................................................................................15
REFERENCES...................................................................................................................................16
2
Index of Tables
Table 1: Forecast Sales for the year ended 31 December 2013............................................................5
Table 2: Proposed Budget for the year ended 31 December 2014.......................................................5
Table 3:Comparative Statement to be presented to Management showing Total Forecast Sales ........5
Table 4: Internal Stakeholders and interest in Budget..........................................................................6
Table 5: External Stakeholders and interest in Budget.........................................................................6
Table 6: Inventory Budget for 2014.....................................................................................................7
Table 7: Purchase Budget for 2014.......................................................................................................7
Table 8: Cost of Sales and Gross Profit Budget...................................................................................7
Table 9: Expense Budget for 2014.......................................................................................................8
Table 10: Master Budget Comparison..................................................................................................9
3
⊘ This is a preview!⊘
Do you want full access?
Subscribe today to unlock all pages.
Trusted by 1+ million students worldwide
INTRODUCTION
Budgeting is one of the most crucial and important facet of financial management that aims
at forecasting about future and helps towards developing an excellent financial plan. It also help to
evaluate the success and performance of the firm through comparison with the targets, thereby top-
quality decisions and remedial measures can be taken to ensure growth. The aim of this assignment
report is to understand the concept of budgeting through constructing various budgets. Moreover, it
will also carry out variance analysis technique to determine deviation and thereby taking corrective
actions to maximize performance.
TASK 1 OPERATIONAL BUDGET – SALES REVENUE
PART A BUDGETING FOR YEAR 2014
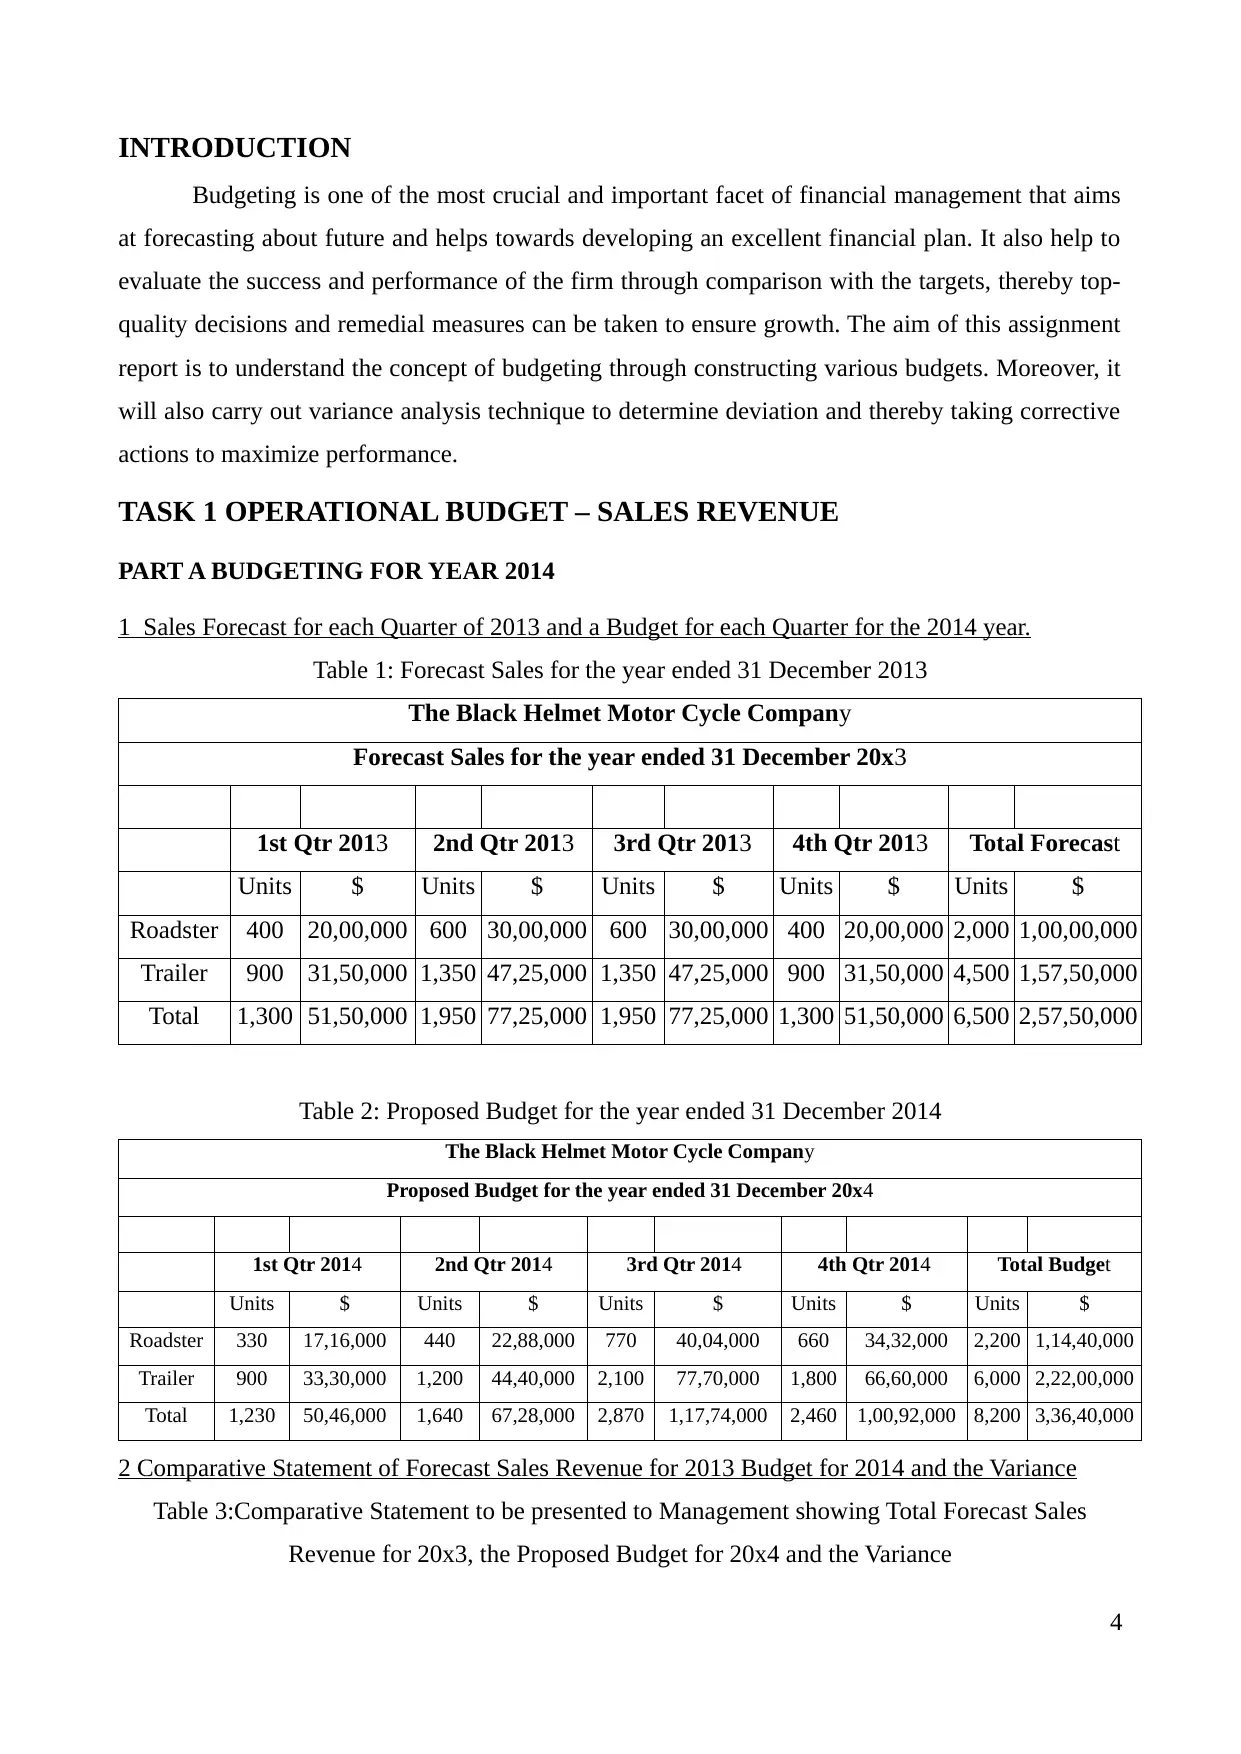
1 Sales Forecast for each Quarter of 2013 and a Budget for each Quarter for the 2014 year.
Table 1: Forecast Sales for the year ended 31 December 2013
The Black Helmet Motor Cycle Company
Forecast Sales for the year ended 31 December 20x3
1st Qtr 2013 2nd Qtr 2013 3rd Qtr 2013 4th Qtr 2013 Total Forecast
Units $ Units $ Units $ Units $ Units $
Roadster 400 20,00,000 600 30,00,000 600 30,00,000 400 20,00,000 2,000 1,00,00,000
Trailer 900 31,50,000 1,350 47,25,000 1,350 47,25,000 900 31,50,000 4,500 1,57,50,000
Total 1,300 51,50,000 1,950 77,25,000 1,950 77,25,000 1,300 51,50,000 6,500 2,57,50,000
Table 2: Proposed Budget for the year ended 31 December 2014
The Black Helmet Motor Cycle Company
Proposed Budget for the year ended 31 December 20x4
1st Qtr 2014 2nd Qtr 2014 3rd Qtr 2014 4th Qtr 2014 Total Budget
Units $ Units $ Units $ Units $ Units $
Roadster 330 17,16,000 440 22,88,000 770 40,04,000 660 34,32,000 2,200 1,14,40,000
Trailer 900 33,30,000 1,200 44,40,000 2,100 77,70,000 1,800 66,60,000 6,000 2,22,00,000
Total 1,230 50,46,000 1,640 67,28,000 2,870 1,17,74,000 2,460 1,00,92,000 8,200 3,36,40,000
2 Comparative Statement of Forecast Sales Revenue for 2013 Budget for 2014 and the Variance
Table 3:Comparative Statement to be presented to Management showing Total Forecast Sales
Revenue for 20x3, the Proposed Budget for 20x4 and the Variance
4
Budgeting is one of the most crucial and important facet of financial management that aims
at forecasting about future and helps towards developing an excellent financial plan. It also help to
evaluate the success and performance of the firm through comparison with the targets, thereby top-
quality decisions and remedial measures can be taken to ensure growth. The aim of this assignment
report is to understand the concept of budgeting through constructing various budgets. Moreover, it
will also carry out variance analysis technique to determine deviation and thereby taking corrective
actions to maximize performance.
TASK 1 OPERATIONAL BUDGET – SALES REVENUE
PART A BUDGETING FOR YEAR 2014
1 Sales Forecast for each Quarter of 2013 and a Budget for each Quarter for the 2014 year.
Table 1: Forecast Sales for the year ended 31 December 2013
The Black Helmet Motor Cycle Company
Forecast Sales for the year ended 31 December 20x3
1st Qtr 2013 2nd Qtr 2013 3rd Qtr 2013 4th Qtr 2013 Total Forecast
Units $ Units $ Units $ Units $ Units $
Roadster 400 20,00,000 600 30,00,000 600 30,00,000 400 20,00,000 2,000 1,00,00,000
Trailer 900 31,50,000 1,350 47,25,000 1,350 47,25,000 900 31,50,000 4,500 1,57,50,000
Total 1,300 51,50,000 1,950 77,25,000 1,950 77,25,000 1,300 51,50,000 6,500 2,57,50,000
Table 2: Proposed Budget for the year ended 31 December 2014
The Black Helmet Motor Cycle Company
Proposed Budget for the year ended 31 December 20x4
1st Qtr 2014 2nd Qtr 2014 3rd Qtr 2014 4th Qtr 2014 Total Budget
Units $ Units $ Units $ Units $ Units $
Roadster 330 17,16,000 440 22,88,000 770 40,04,000 660 34,32,000 2,200 1,14,40,000
Trailer 900 33,30,000 1,200 44,40,000 2,100 77,70,000 1,800 66,60,000 6,000 2,22,00,000
Total 1,230 50,46,000 1,640 67,28,000 2,870 1,17,74,000 2,460 1,00,92,000 8,200 3,36,40,000
2 Comparative Statement of Forecast Sales Revenue for 2013 Budget for 2014 and the Variance
Table 3:Comparative Statement to be presented to Management showing Total Forecast Sales
Revenue for 20x3, the Proposed Budget for 20x4 and the Variance
4
Paraphrase This Document
Need a fresh take? Get an instant paraphrase of this document with our AI Paraphraser
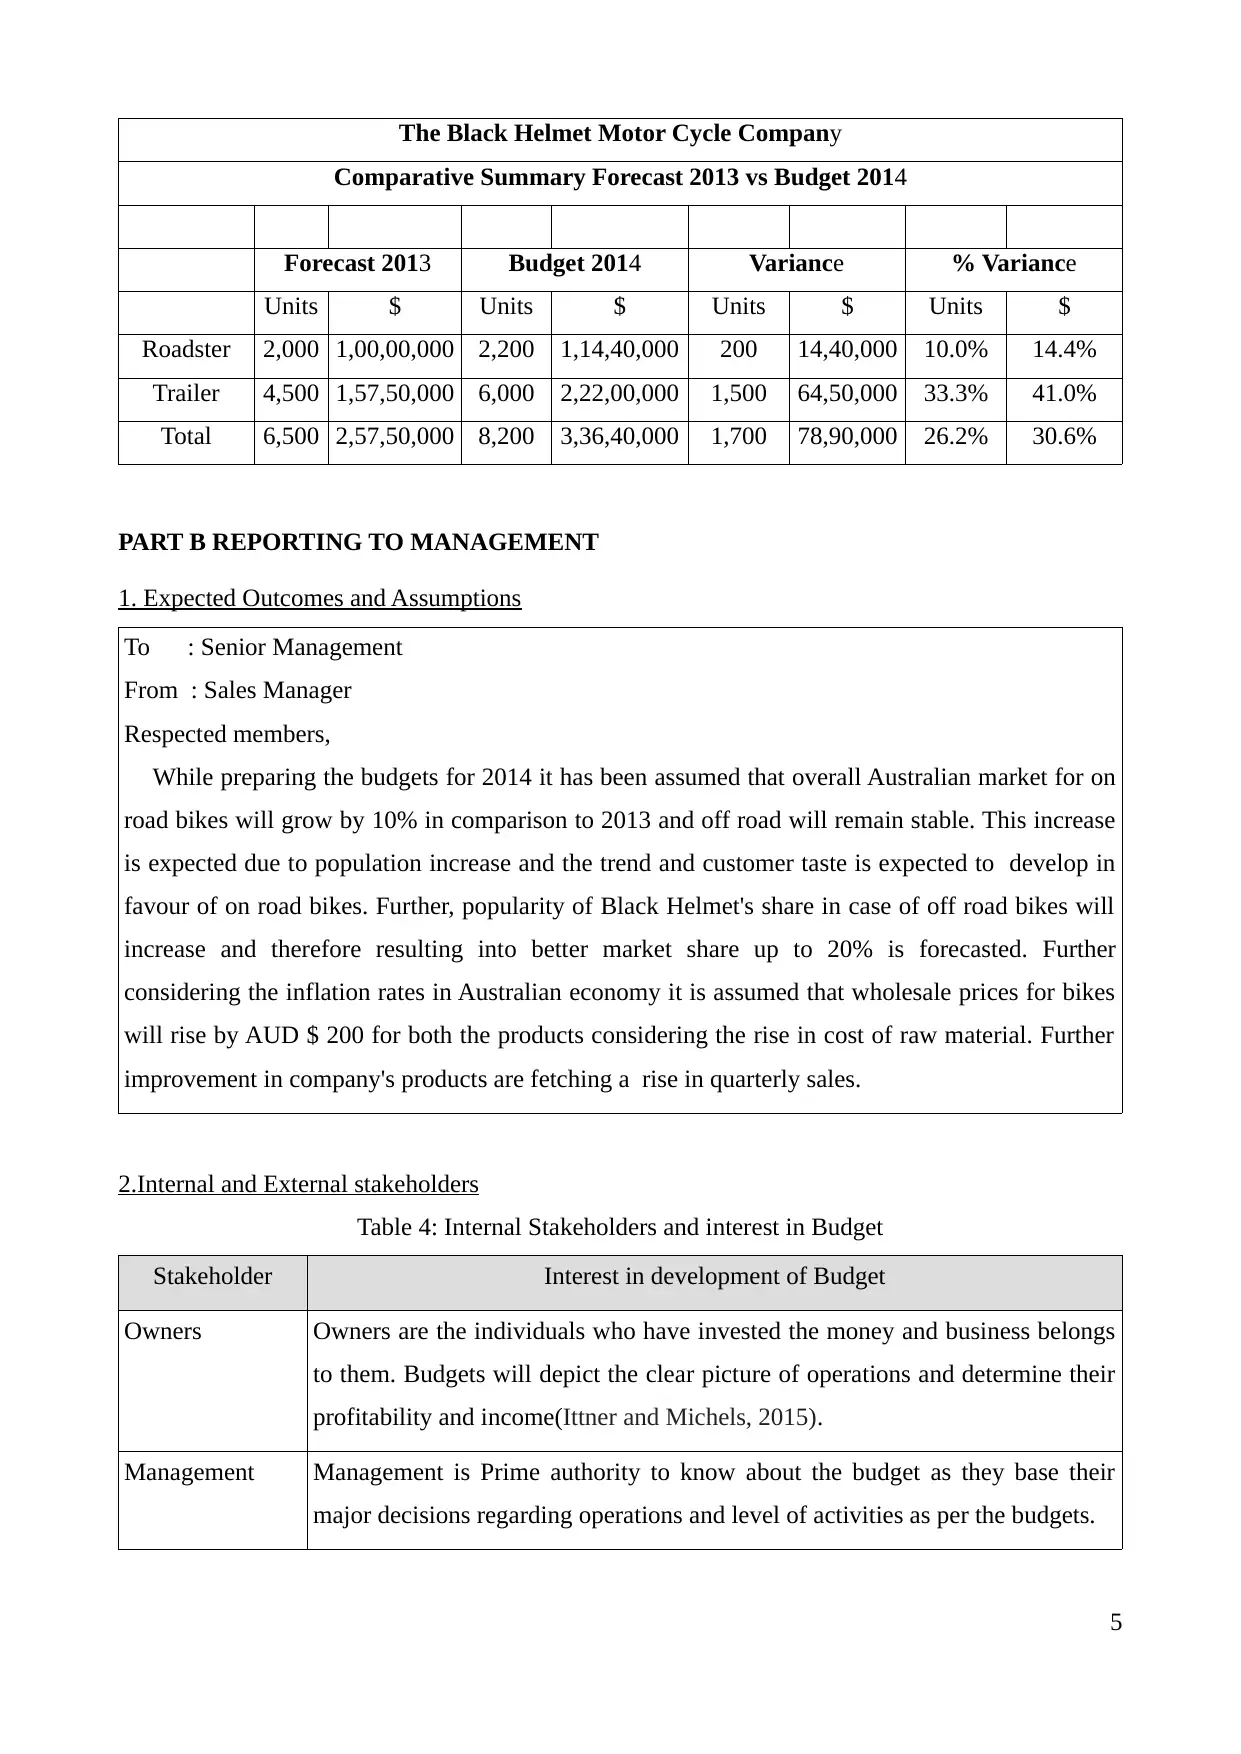
The Black Helmet Motor Cycle Company
Comparative Summary Forecast 2013 vs Budget 2014
Forecast 2013 Budget 2014 Variance % Variance
Units $ Units $ Units $ Units $
Roadster 2,000 1,00,00,000 2,200 1,14,40,000 200 14,40,000 10.0% 14.4%
Trailer 4,500 1,57,50,000 6,000 2,22,00,000 1,500 64,50,000 33.3% 41.0%
Total 6,500 2,57,50,000 8,200 3,36,40,000 1,700 78,90,000 26.2% 30.6%
PART B REPORTING TO MANAGEMENT
1. Expected Outcomes and Assumptions
To : Senior Management
From : Sales Manager
Respected members,
While preparing the budgets for 2014 it has been assumed that overall Australian market for on
road bikes will grow by 10% in comparison to 2013 and off road will remain stable. This increase
is expected due to population increase and the trend and customer taste is expected to develop in
favour of on road bikes. Further, popularity of Black Helmet's share in case of off road bikes will
increase and therefore resulting into better market share up to 20% is forecasted. Further
considering the inflation rates in Australian economy it is assumed that wholesale prices for bikes
will rise by AUD $ 200 for both the products considering the rise in cost of raw material. Further
improvement in company's products are fetching a rise in quarterly sales.
2.Internal and External stakeholders
Table 4: Internal Stakeholders and interest in Budget
Stakeholder Interest in development of Budget
Owners Owners are the individuals who have invested the money and business belongs
to them. Budgets will depict the clear picture of operations and determine their
profitability and income(Ittner and Michels, 2015).
Management Management is Prime authority to know about the budget as they base their
major decisions regarding operations and level of activities as per the budgets.
5
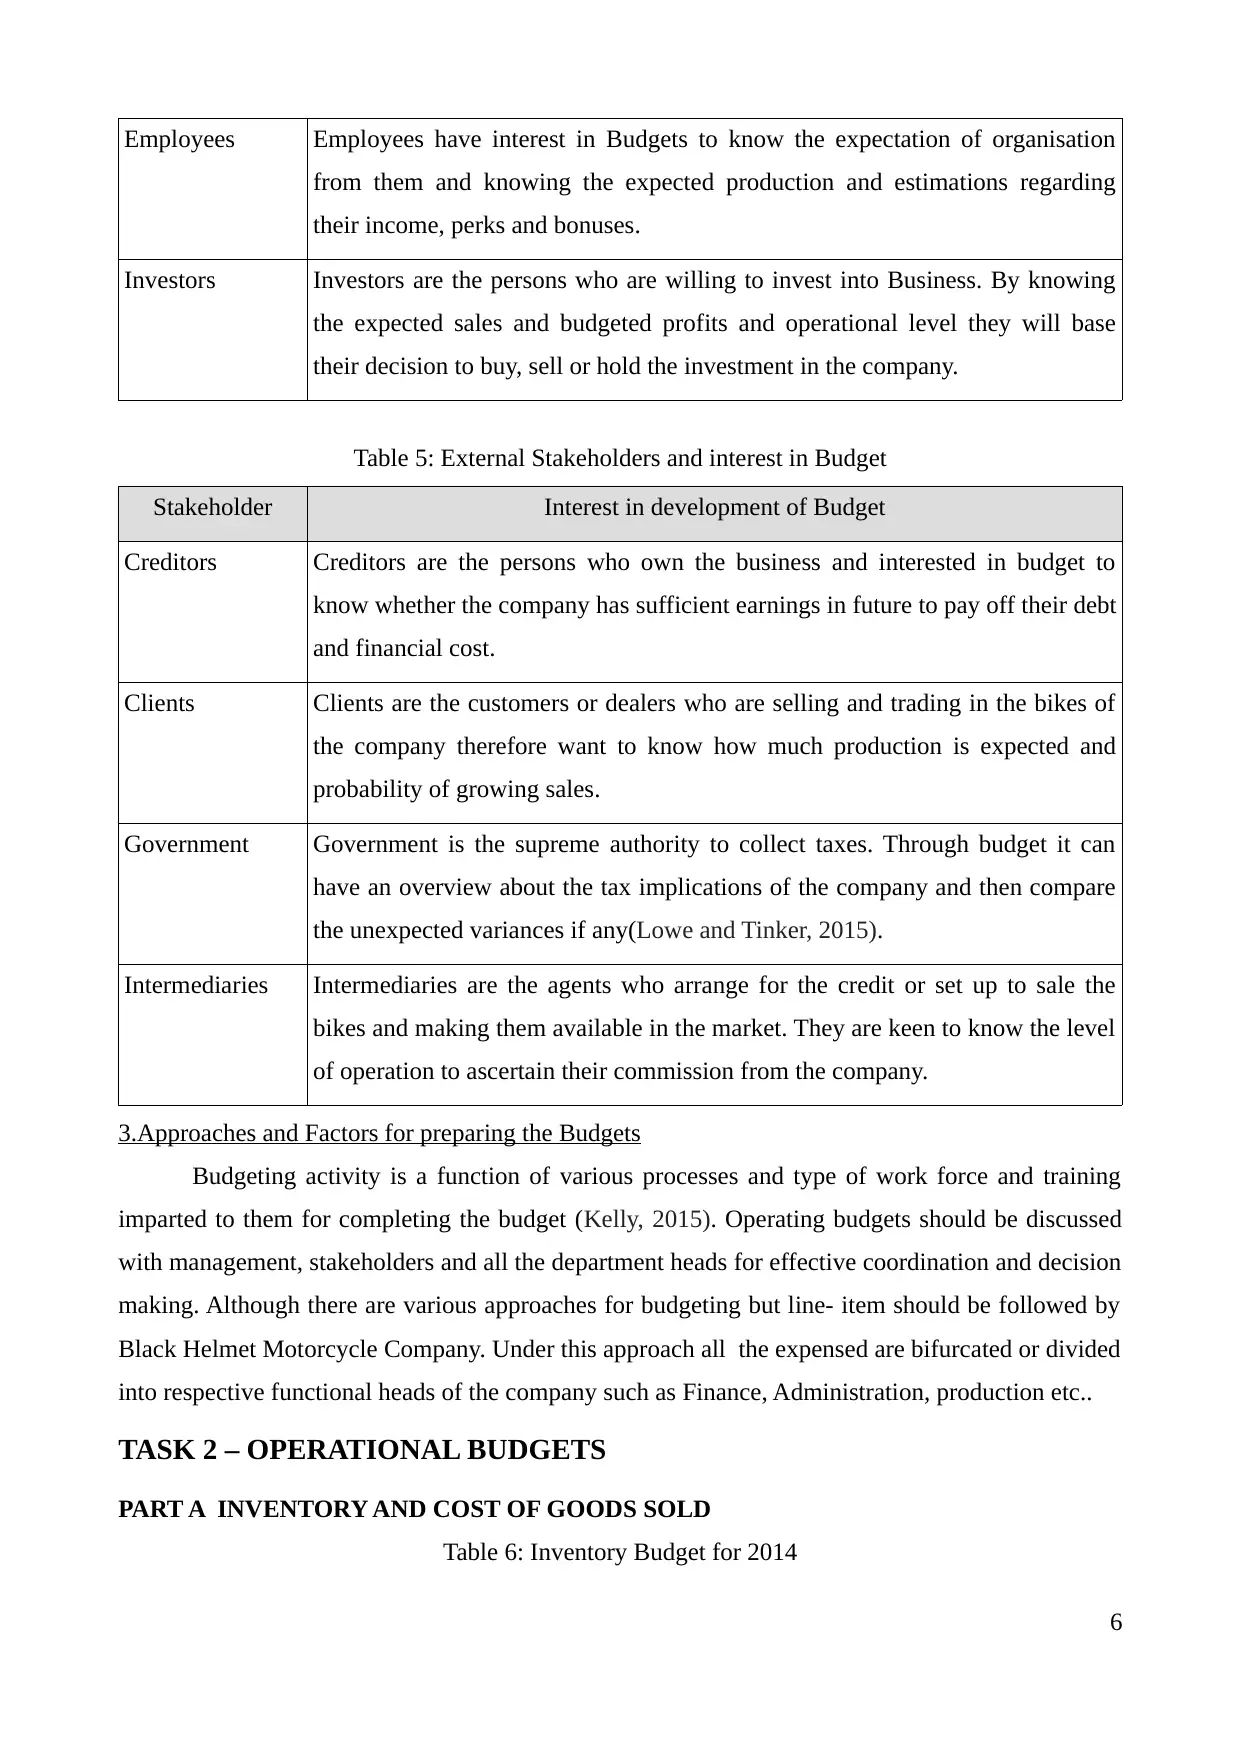
Employees Employees have interest in Budgets to know the expectation of organisation
from them and knowing the expected production and estimations regarding
their income, perks and bonuses.
Investors Investors are the persons who are willing to invest into Business. By knowing
the expected sales and budgeted profits and operational level they will base
their decision to buy, sell or hold the investment in the company.
Table 5: External Stakeholders and interest in Budget
Stakeholder Interest in development of Budget
Creditors Creditors are the persons who own the business and interested in budget to
know whether the company has sufficient earnings in future to pay off their debt
and financial cost.
Clients Clients are the customers or dealers who are selling and trading in the bikes of
the company therefore want to know how much production is expected and
probability of growing sales.
Government Government is the supreme authority to collect taxes. Through budget it can
have an overview about the tax implications of the company and then compare
the unexpected variances if any(Lowe and Tinker, 2015).
Intermediaries Intermediaries are the agents who arrange for the credit or set up to sale the
bikes and making them available in the market. They are keen to know the level
of operation to ascertain their commission from the company.
3.Approaches and Factors for preparing the Budgets
Budgeting activity is a function of various processes and type of work force and training
imparted to them for completing the budget (Kelly, 2015). Operating budgets should be discussed
with management, stakeholders and all the department heads for effective coordination and decision
making. Although there are various approaches for budgeting but line- item should be followed by
Black Helmet Motorcycle Company. Under this approach all the expensed are bifurcated or divided
into respective functional heads of the company such as Finance, Administration, production etc..
TASK 2 – OPERATIONAL BUDGETS
PART A INVENTORY AND COST OF GOODS SOLD
Table 6: Inventory Budget for 2014
6
⊘ This is a preview!⊘
Do you want full access?
Subscribe today to unlock all pages.
Trusted by 1+ million students worldwide
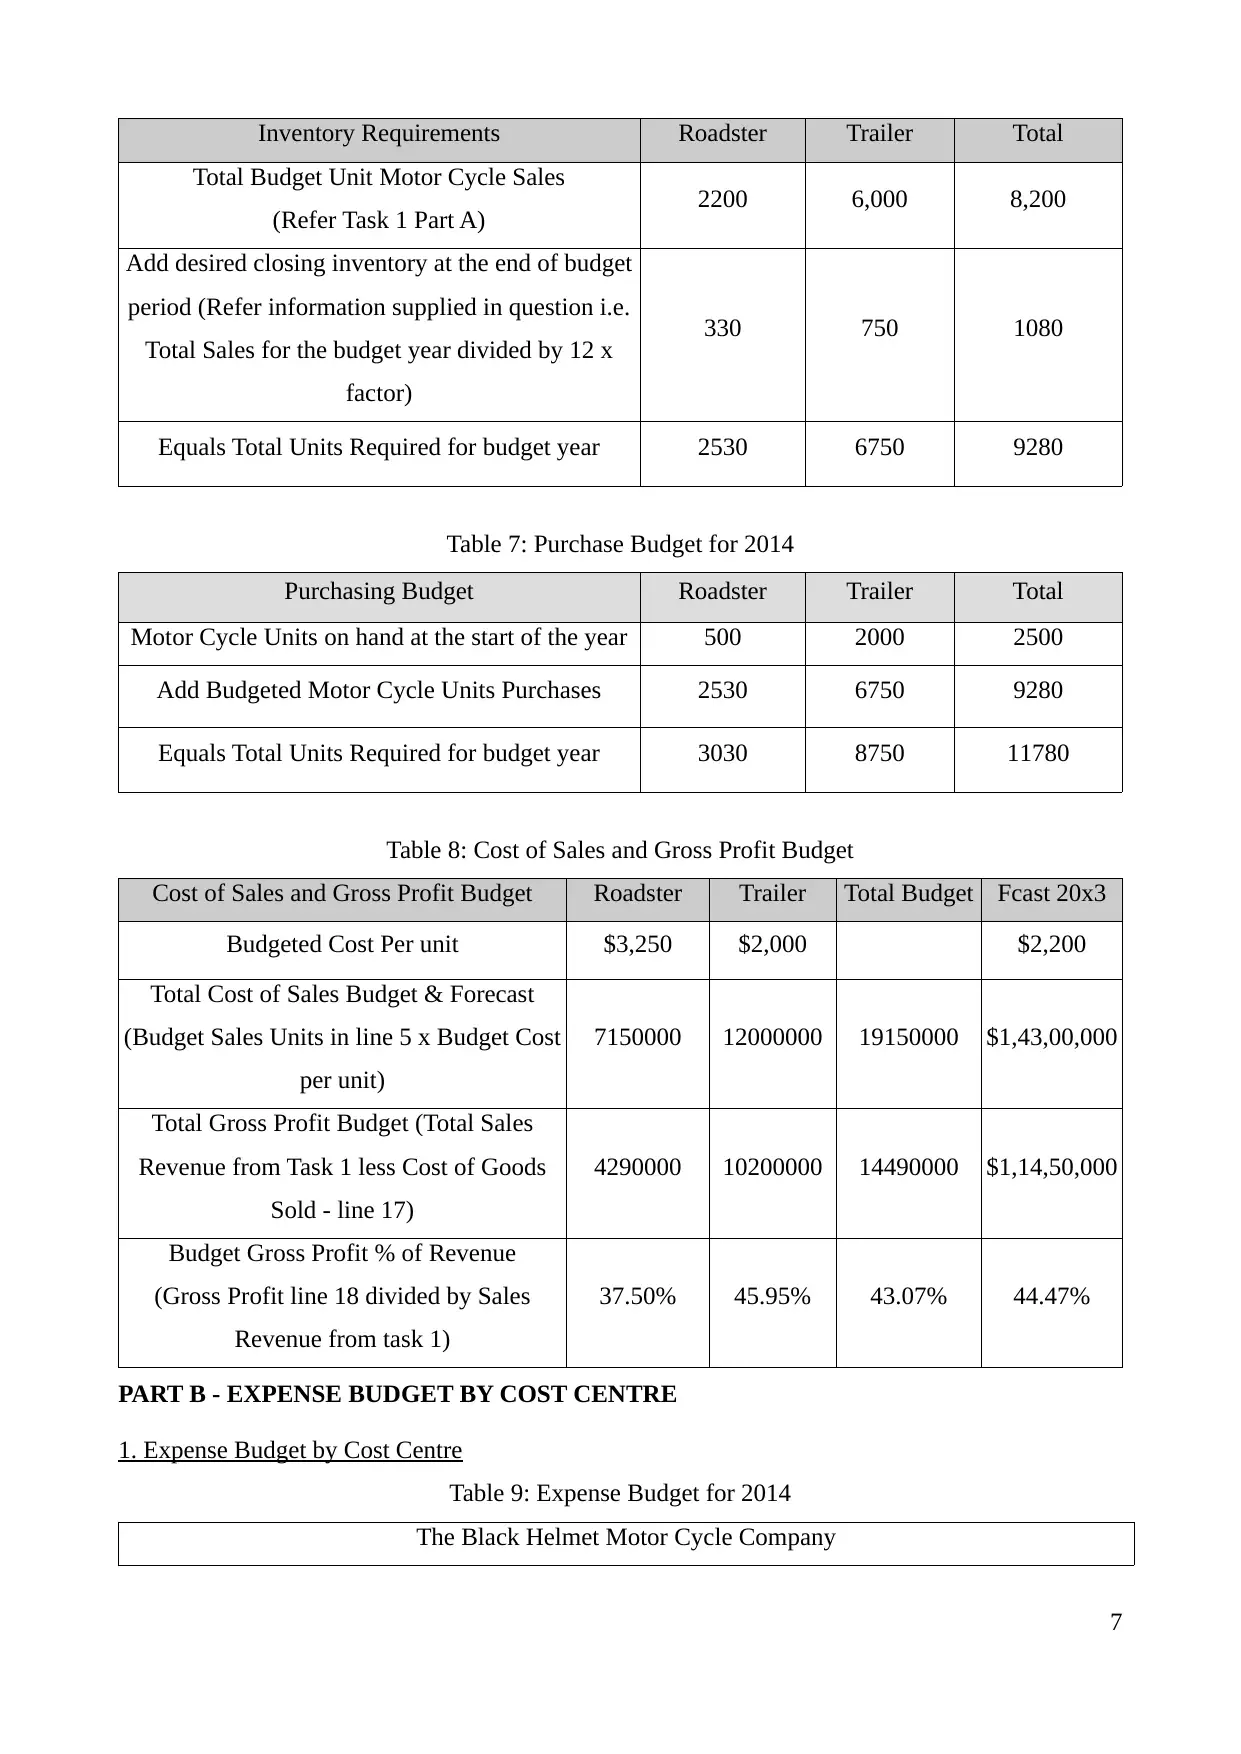
Inventory Requirements Roadster Trailer Total
Total Budget Unit Motor Cycle Sales
(Refer Task 1 Part A) 2200 6,000 8,200
Add desired closing inventory at the end of budget
period (Refer information supplied in question i.e.
Total Sales for the budget year divided by 12 x
factor)
330 750 1080
Equals Total Units Required for budget year 2530 6750 9280
Table 7: Purchase Budget for 2014
Purchasing Budget Roadster Trailer Total
Motor Cycle Units on hand at the start of the year 500 2000 2500
Add Budgeted Motor Cycle Units Purchases 2530 6750 9280
Equals Total Units Required for budget year 3030 8750 11780
Table 8: Cost of Sales and Gross Profit Budget
Cost of Sales and Gross Profit Budget Roadster Trailer Total Budget Fcast 20x3
Budgeted Cost Per unit $3,250 $2,000 $2,200
Total Cost of Sales Budget & Forecast
(Budget Sales Units in line 5 x Budget Cost
per unit)
7150000 12000000 19150000 $1,43,00,000
Total Gross Profit Budget (Total Sales
Revenue from Task 1 less Cost of Goods
Sold - line 17)
4290000 10200000 14490000 $1,14,50,000
Budget Gross Profit % of Revenue
(Gross Profit line 18 divided by Sales
Revenue from task 1)
37.50% 45.95% 43.07% 44.47%
PART B - EXPENSE BUDGET BY COST CENTRE
1. Expense Budget by Cost Centre
Table 9: Expense Budget for 2014
The Black Helmet Motor Cycle Company
7
Paraphrase This Document
Need a fresh take? Get an instant paraphrase of this document with our AI Paraphraser
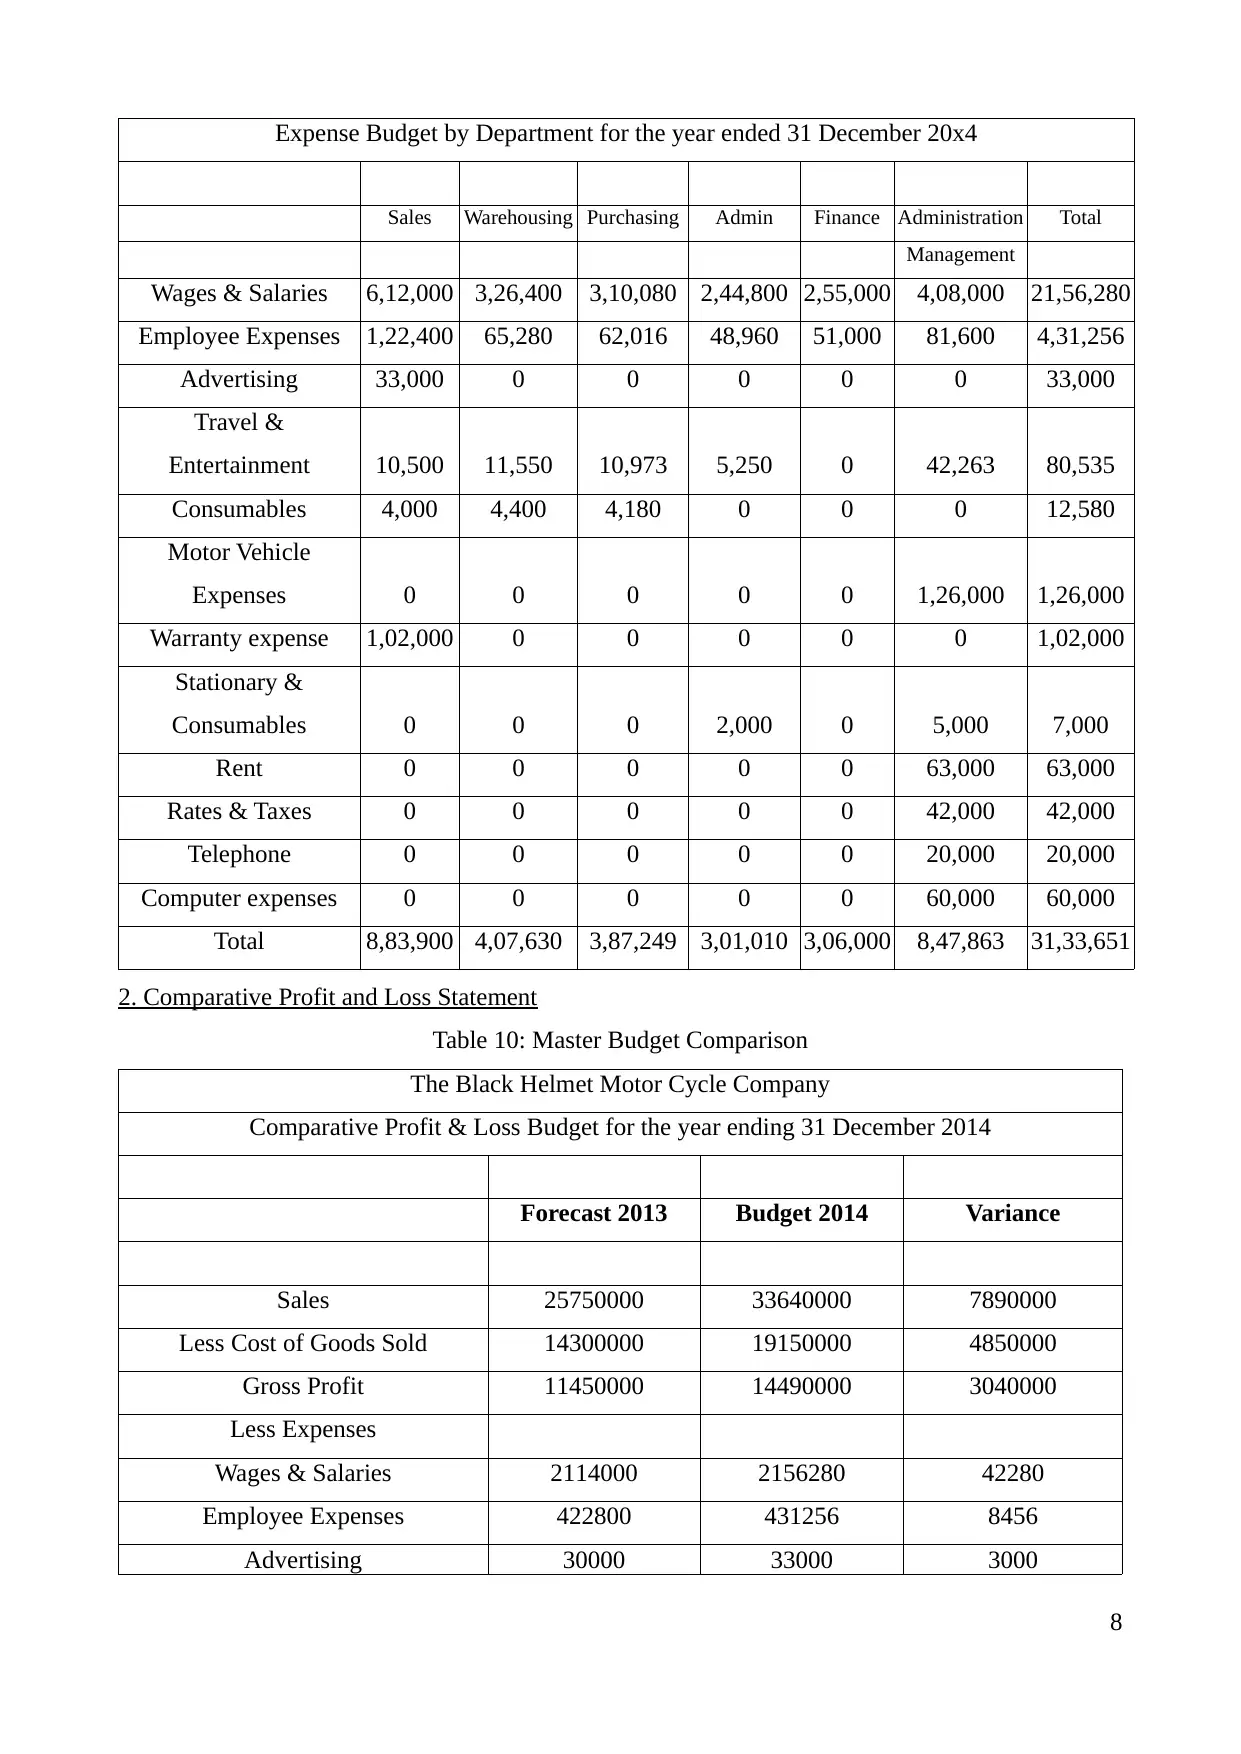
Expense Budget by Department for the year ended 31 December 20x4
Sales Warehousing Purchasing Admin Finance Administration Total
Management
Wages & Salaries 6,12,000 3,26,400 3,10,080 2,44,800 2,55,000 4,08,000 21,56,280
Employee Expenses 1,22,400 65,280 62,016 48,960 51,000 81,600 4,31,256
Advertising 33,000 0 0 0 0 0 33,000
Travel &
Entertainment 10,500 11,550 10,973 5,250 0 42,263 80,535
Consumables 4,000 4,400 4,180 0 0 0 12,580
Motor Vehicle
Expenses 0 0 0 0 0 1,26,000 1,26,000
Warranty expense 1,02,000 0 0 0 0 0 1,02,000
Stationary &
Consumables 0 0 0 2,000 0 5,000 7,000
Rent 0 0 0 0 0 63,000 63,000
Rates & Taxes 0 0 0 0 0 42,000 42,000
Telephone 0 0 0 0 0 20,000 20,000
Computer expenses 0 0 0 0 0 60,000 60,000
Total 8,83,900 4,07,630 3,87,249 3,01,010 3,06,000 8,47,863 31,33,651
2. Comparative Profit and Loss Statement
Table 10: Master Budget Comparison
The Black Helmet Motor Cycle Company
Comparative Profit & Loss Budget for the year ending 31 December 2014
Forecast 2013 Budget 2014 Variance
Sales 25750000 33640000 7890000
Less Cost of Goods Sold 14300000 19150000 4850000
Gross Profit 11450000 14490000 3040000
Less Expenses
Wages & Salaries 2114000 2156280 42280
Employee Expenses 422800 431256 8456
Advertising 30000 33000 3000
8
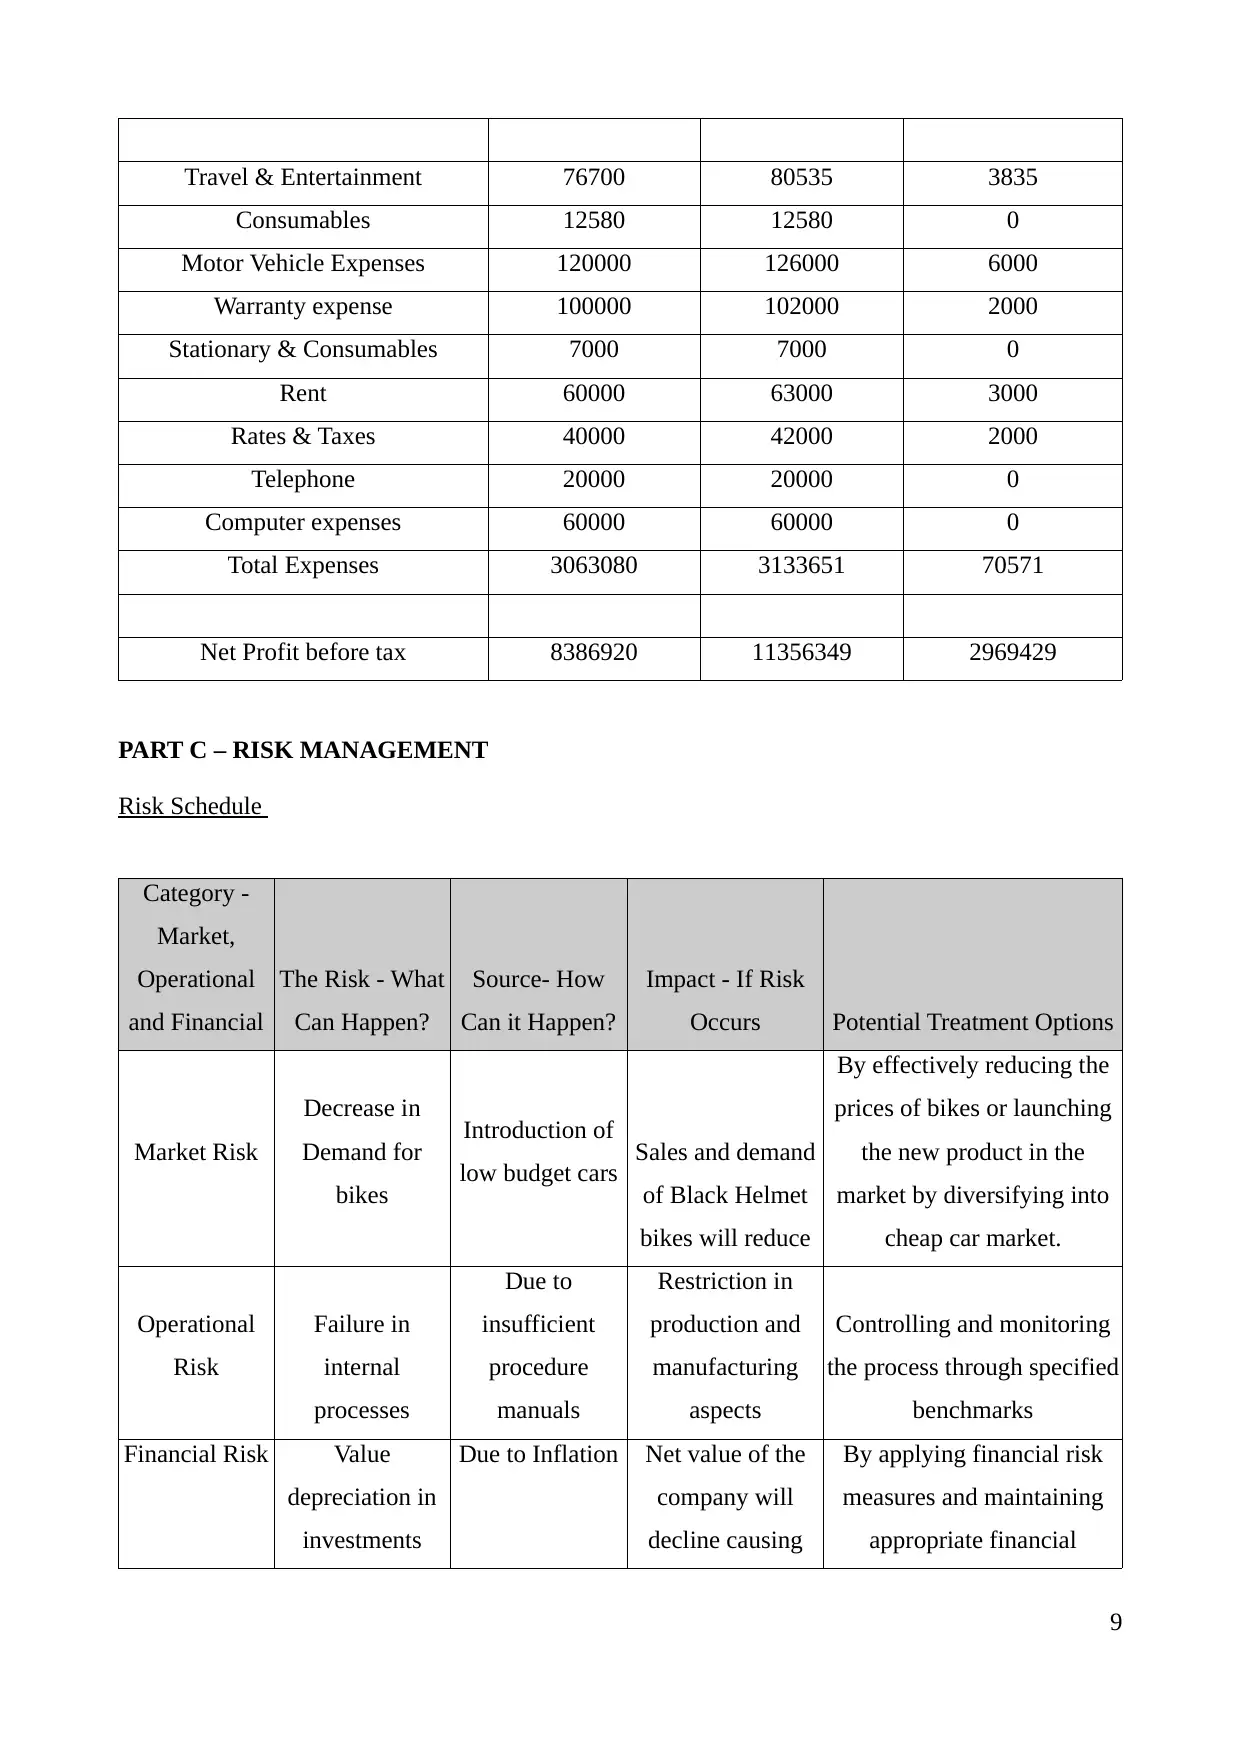
Travel & Entertainment 76700 80535 3835
Consumables 12580 12580 0
Motor Vehicle Expenses 120000 126000 6000
Warranty expense 100000 102000 2000
Stationary & Consumables 7000 7000 0
Rent 60000 63000 3000
Rates & Taxes 40000 42000 2000
Telephone 20000 20000 0
Computer expenses 60000 60000 0
Total Expenses 3063080 3133651 70571
Net Profit before tax 8386920 11356349 2969429
PART C – RISK MANAGEMENT
Risk Schedule
Category -
Market,
Operational
and Financial
The Risk - What
Can Happen?
Source- How
Can it Happen?
Impact - If Risk
Occurs Potential Treatment Options
Market Risk
Decrease in
Demand for
bikes
Introduction of
low budget cars Sales and demand
of Black Helmet
bikes will reduce
By effectively reducing the
prices of bikes or launching
the new product in the
market by diversifying into
cheap car market.
Operational
Risk
Failure in
internal
processes
Due to
insufficient
procedure
manuals
Restriction in
production and
manufacturing
aspects
Controlling and monitoring
the process through specified
benchmarks
Financial Risk Value
depreciation in
investments
Due to Inflation Net value of the
company will
decline causing
By applying financial risk
measures and maintaining
appropriate financial
9
⊘ This is a preview!⊘
Do you want full access?
Subscribe today to unlock all pages.
Trusted by 1+ million students worldwide
prices of share to
fall leverage
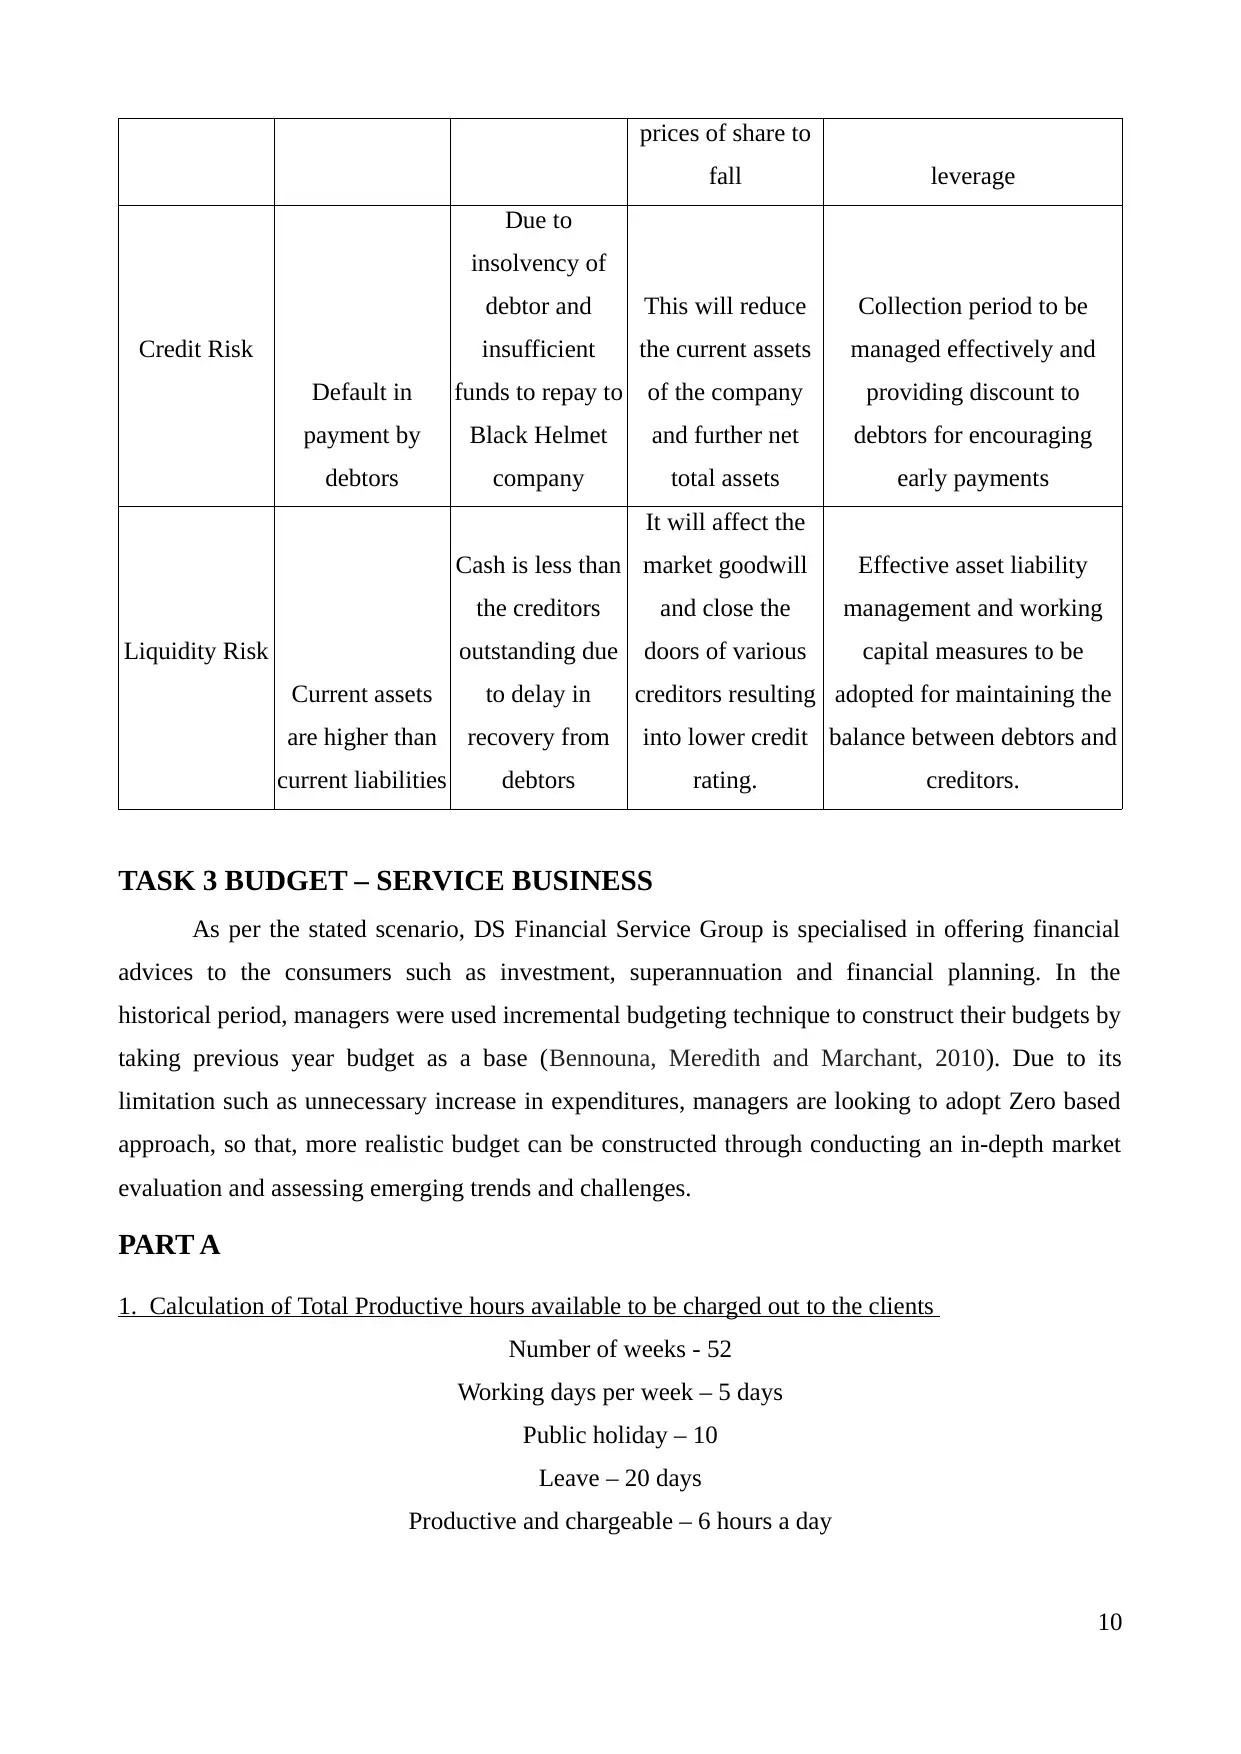
Credit Risk
Default in
payment by
debtors
Due to
insolvency of
debtor and
insufficient
funds to repay to
Black Helmet
company
This will reduce
the current assets
of the company
and further net
total assets
Collection period to be
managed effectively and
providing discount to
debtors for encouraging
early payments
Liquidity Risk
Current assets
are higher than
current liabilities
Cash is less than
the creditors
outstanding due
to delay in
recovery from
debtors
It will affect the
market goodwill
and close the
doors of various
creditors resulting
into lower credit
rating.
Effective asset liability
management and working
capital measures to be
adopted for maintaining the
balance between debtors and
creditors.
TASK 3 BUDGET – SERVICE BUSINESS
As per the stated scenario, DS Financial Service Group is specialised in offering financial
advices to the consumers such as investment, superannuation and financial planning. In the
historical period, managers were used incremental budgeting technique to construct their budgets by
taking previous year budget as a base (Bennouna, Meredith and Marchant, 2010). Due to its
limitation such as unnecessary increase in expenditures, managers are looking to adopt Zero based
approach, so that, more realistic budget can be constructed through conducting an in-depth market
evaluation and assessing emerging trends and challenges.
PART A
1. Calculation of Total Productive hours available to be charged out to the clients
Number of weeks - 52
Working days per week – 5 days
Public holiday – 10
Leave – 20 days
Productive and chargeable – 6 hours a day
10
fall leverage
Credit Risk
Default in
payment by
debtors
Due to
insolvency of
debtor and
insufficient
funds to repay to
Black Helmet
company
This will reduce
the current assets
of the company
and further net
total assets
Collection period to be
managed effectively and
providing discount to
debtors for encouraging
early payments
Liquidity Risk
Current assets
are higher than
current liabilities
Cash is less than
the creditors
outstanding due
to delay in
recovery from
debtors
It will affect the
market goodwill
and close the
doors of various
creditors resulting
into lower credit
rating.
Effective asset liability
management and working
capital measures to be
adopted for maintaining the
balance between debtors and
creditors.
TASK 3 BUDGET – SERVICE BUSINESS
As per the stated scenario, DS Financial Service Group is specialised in offering financial
advices to the consumers such as investment, superannuation and financial planning. In the
historical period, managers were used incremental budgeting technique to construct their budgets by
taking previous year budget as a base (Bennouna, Meredith and Marchant, 2010). Due to its
limitation such as unnecessary increase in expenditures, managers are looking to adopt Zero based
approach, so that, more realistic budget can be constructed through conducting an in-depth market
evaluation and assessing emerging trends and challenges.
PART A
1. Calculation of Total Productive hours available to be charged out to the clients
Number of weeks - 52
Working days per week – 5 days
Public holiday – 10
Leave – 20 days
Productive and chargeable – 6 hours a day
10
Paraphrase This Document
Need a fresh take? Get an instant paraphrase of this document with our AI Paraphraser
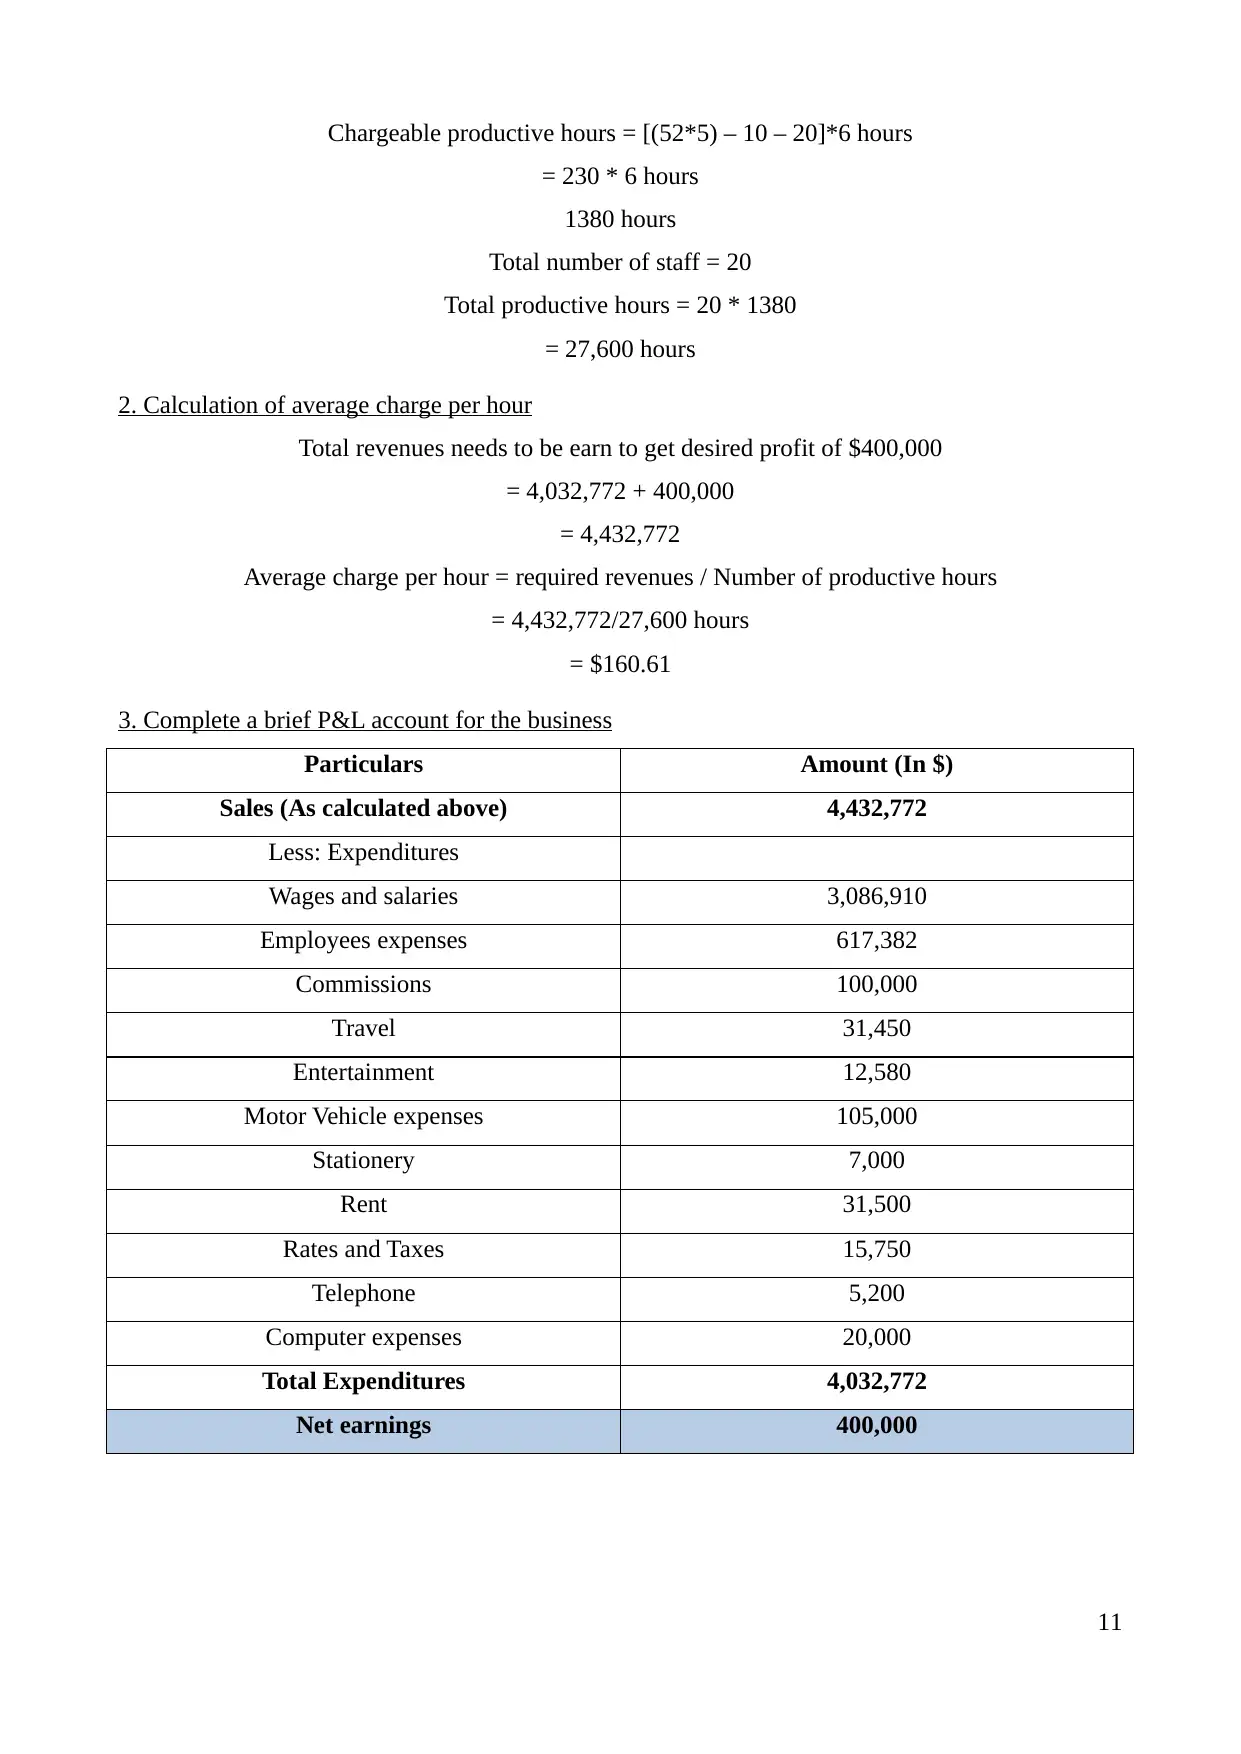
Chargeable productive hours = [(52*5) – 10 – 20]*6 hours
= 230 * 6 hours
1380 hours
Total number of staff = 20
Total productive hours = 20 * 1380
= 27,600 hours
2. Calculation of average charge per hour
Total revenues needs to be earn to get desired profit of $400,000
= 4,032,772 + 400,000
= 4,432,772
Average charge per hour = required revenues / Number of productive hours
= 4,432,772/27,600 hours
= $160.61
3. Complete a brief P&L account for the business
Particulars Amount (In $)
Sales (As calculated above) 4,432,772
Less: Expenditures
Wages and salaries 3,086,910
Employees expenses 617,382
Commissions 100,000
Travel 31,450
Entertainment 12,580
Motor Vehicle expenses 105,000
Stationery 7,000
Rent 31,500
Rates and Taxes 15,750
Telephone 5,200
Computer expenses 20,000
Total Expenditures 4,032,772
Net earnings 400,000
11
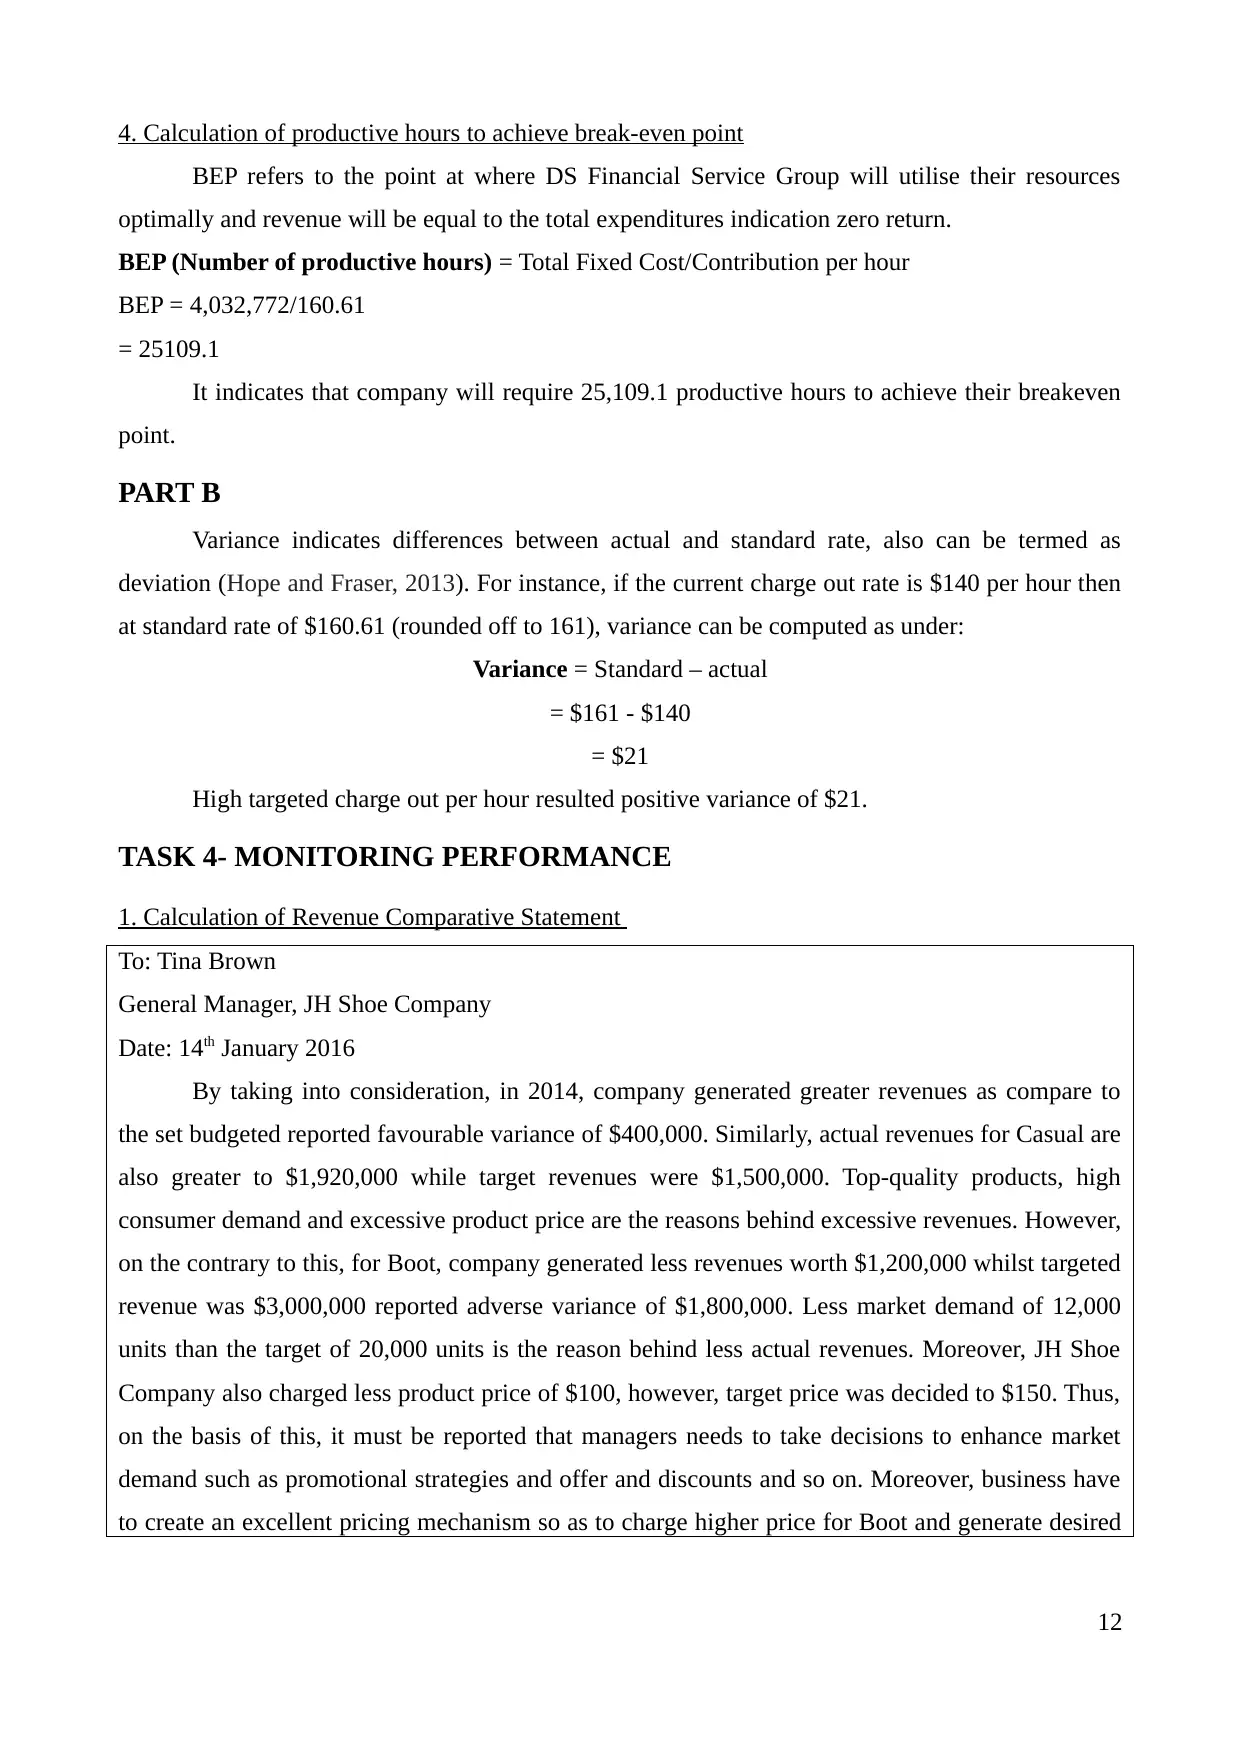
4. Calculation of productive hours to achieve break-even point
BEP refers to the point at where DS Financial Service Group will utilise their resources
optimally and revenue will be equal to the total expenditures indication zero return.
BEP (Number of productive hours) = Total Fixed Cost/Contribution per hour
BEP = 4,032,772/160.61
= 25109.1
It indicates that company will require 25,109.1 productive hours to achieve their breakeven
point.
PART B
Variance indicates differences between actual and standard rate, also can be termed as
deviation (Hope and Fraser, 2013). For instance, if the current charge out rate is $140 per hour then
at standard rate of $160.61 (rounded off to 161), variance can be computed as under:
Variance = Standard – actual
= $161 - $140
= $21
High targeted charge out per hour resulted positive variance of $21.
TASK 4- MONITORING PERFORMANCE
1. Calculation of Revenue Comparative Statement
To: Tina Brown
General Manager, JH Shoe Company
Date: 14th January 2016
By taking into consideration, in 2014, company generated greater revenues as compare to
the set budgeted reported favourable variance of $400,000. Similarly, actual revenues for Casual are
also greater to $1,920,000 while target revenues were $1,500,000. Top-quality products, high
consumer demand and excessive product price are the reasons behind excessive revenues. However,
on the contrary to this, for Boot, company generated less revenues worth $1,200,000 whilst targeted
revenue was $3,000,000 reported adverse variance of $1,800,000. Less market demand of 12,000
units than the target of 20,000 units is the reason behind less actual revenues. Moreover, JH Shoe
Company also charged less product price of $100, however, target price was decided to $150. Thus,
on the basis of this, it must be reported that managers needs to take decisions to enhance market
demand such as promotional strategies and offer and discounts and so on. Moreover, business have
to create an excellent pricing mechanism so as to charge higher price for Boot and generate desired
12
⊘ This is a preview!⊘
Do you want full access?
Subscribe today to unlock all pages.
Trusted by 1+ million students worldwide
1 out of 16
Related Documents


Your All-in-One AI-Powered Toolkit for Academic Success.
+13062052269
info@desklib.com
Available 24*7 on WhatsApp / Email
![[object Object]](/_next/static/media/star-bottom.7253800d.svg)
Unlock your academic potential
Copyright © 2020–2026 A2Z Services. All Rights Reserved. Developed and managed by ZUCOL.