Financial Management Report: Sainsbury's PLC Analysis and Appraisal
VerifiedAdded on 2019/12/03
|24
|5045
|246
Report
AI Summary
This report provides a financial analysis of Sainsbury's PLC, a company listed on the London Stock Exchange. The analysis is divided into two main parts. Part 1 focuses on the calculation and interpretation of various financial ratios, including liquidity, efficiency/turnover, profitability, and performance ratios, using data from 2010 to 2012. The report provides a detailed examination of each ratio, comparing Sainsbury's performance against industry standards and highlighting trends. Part 2 covers investment appraisal techniques, specifically Net Present Value (NPV) and Payback Period methods, applied to hypothetical projects. The report calculates and compares the financial viability of two projects, discussing the advantages and disadvantages of each method. The conclusion summarizes the key findings and offers insights into Sainsbury's financial health and investment potential.

Paraphrase This Document
Need a fresh take? Get an instant paraphrase of this document with our AI Paraphraser
Table of Contents
Introduction......................................................................................................................................4
Part 1................................................................................................................................................4
1.1: Calculation of Ratios............................................................................................................4
1.2: Ratio Analysis.......................................................................................................................7
1.3: Summarized Report..............................................................................................................9
Part 2: Investment Appraisal for PLC plc......................................................................................10
2.1: Project Appraisal...............................................................................................................10
2.2: Payback Period Method......................................................................................................14
2.3: Advantages and disadvantages of the investment appraisal methods................................15
2.4: Summarized Report............................................................................................................16
CONCLUSION..............................................................................................................................17
Reference.......................................................................................................................................18
Appendix........................................................................................................................................19
List of Tables
Table 1: Ratio Analysis of Sainsbury..............................................................................................7
Table 2 : Summarized Report..........................................................................................................9
Table 3 : Cash Flow for Two Projects...........................................................................................10
Table 4 : NPV at 10%....................................................................................................................11
Table 5 : NPV of Project 1............................................................................................................12
Table 6 : NPV of Project 2............................................................................................................12
Table 7 : Payback Period of Project 1...........................................................................................14
Table 8 : Payback Period of Project 2...........................................................................................14
⊘ This is a preview!⊘
Do you want full access?
Subscribe today to unlock all pages.
Trusted by 1+ million students worldwide
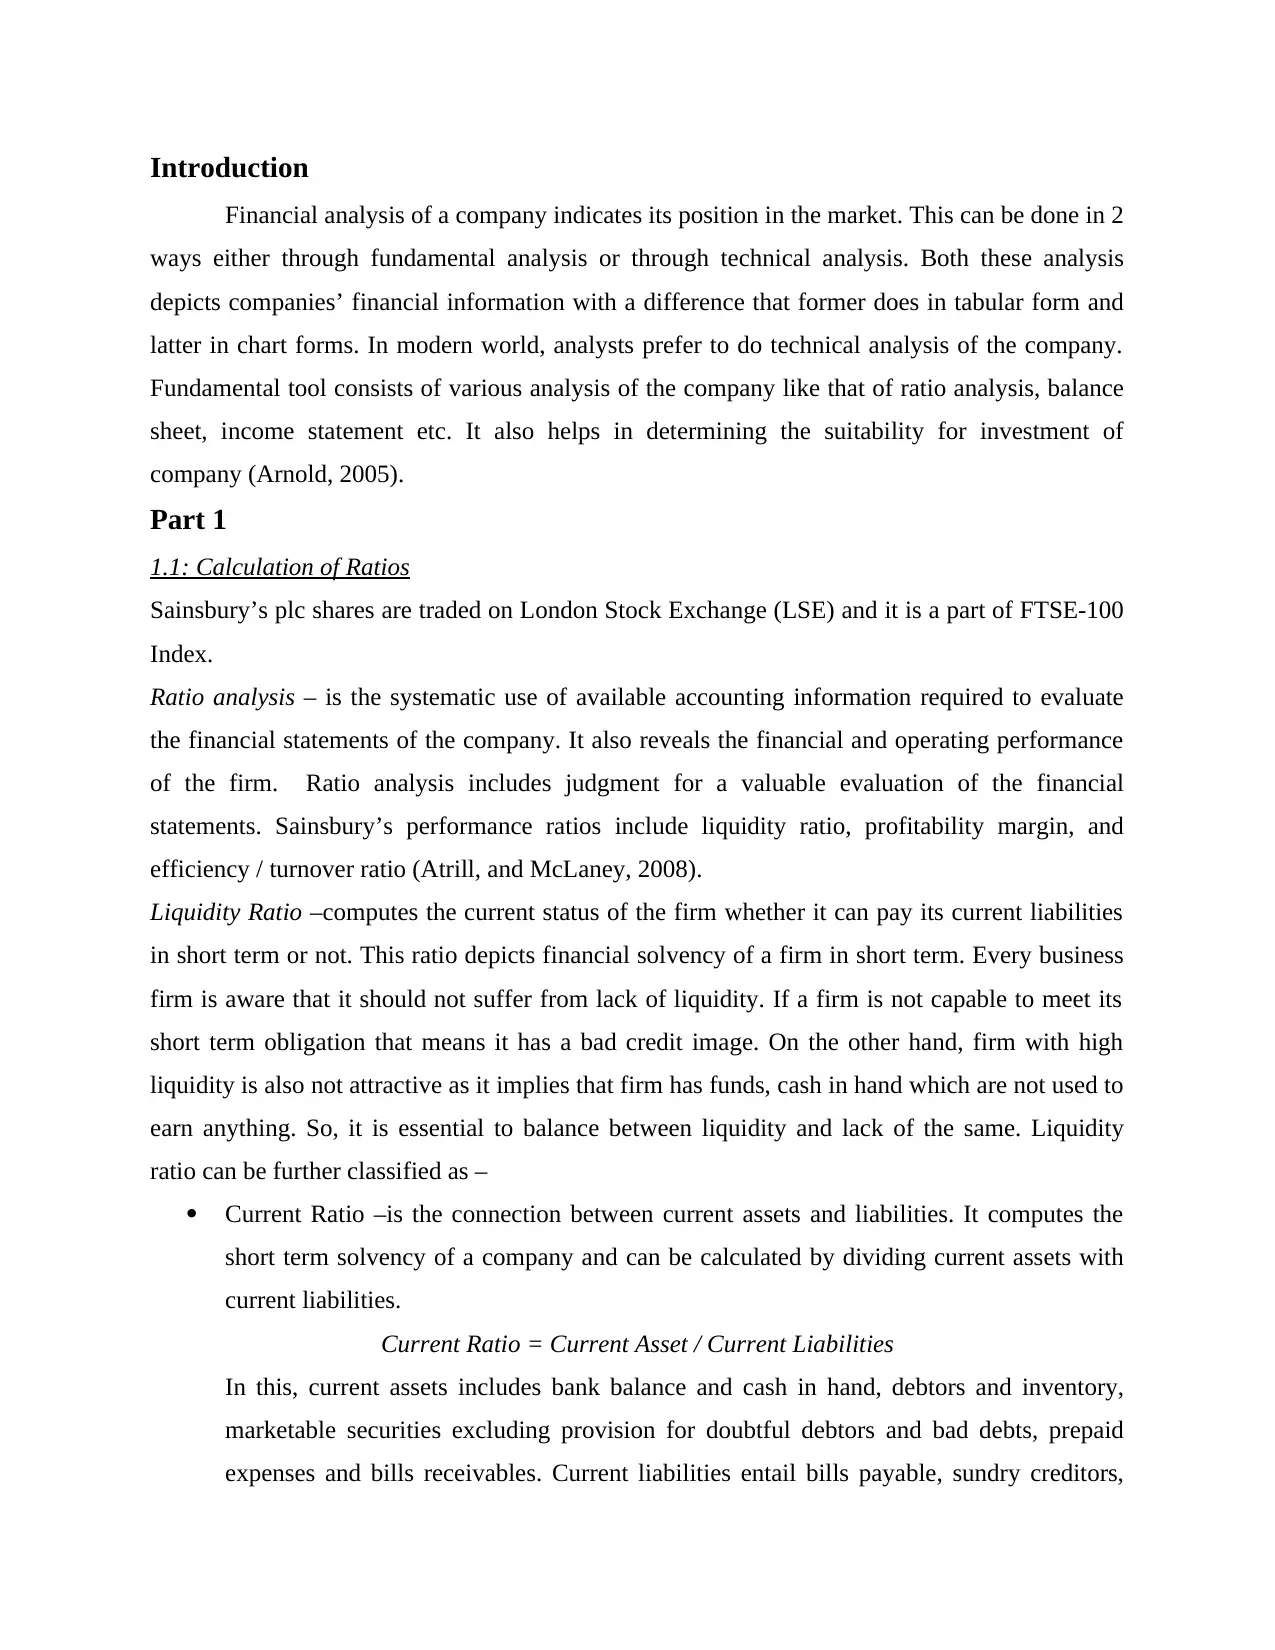
Introduction
Financial analysis of a company indicates its position in the market. This can be done in 2
ways either through fundamental analysis or through technical analysis. Both these analysis
depicts companies’ financial information with a difference that former does in tabular form and
latter in chart forms. In modern world, analysts prefer to do technical analysis of the company.
Fundamental tool consists of various analysis of the company like that of ratio analysis, balance
sheet, income statement etc. It also helps in determining the suitability for investment of
company (Arnold, 2005).
Part 1
1.1: Calculation of Ratios
Sainsbury’s plc shares are traded on London Stock Exchange (LSE) and it is a part of FTSE-100
Index.
Ratio analysis – is the systematic use of available accounting information required to evaluate
the financial statements of the company. It also reveals the financial and operating performance
of the firm. Ratio analysis includes judgment for a valuable evaluation of the financial
statements. Sainsbury’s performance ratios include liquidity ratio, profitability margin, and
efficiency / turnover ratio (Atrill, and McLaney, 2008).
Liquidity Ratio –computes the current status of the firm whether it can pay its current liabilities
in short term or not. This ratio depicts financial solvency of a firm in short term. Every business
firm is aware that it should not suffer from lack of liquidity. If a firm is not capable to meet its
short term obligation that means it has a bad credit image. On the other hand, firm with high
liquidity is also not attractive as it implies that firm has funds, cash in hand which are not used to
earn anything. So, it is essential to balance between liquidity and lack of the same. Liquidity
ratio can be further classified as –
Current Ratio –is the connection between current assets and liabilities. It computes the
short term solvency of a company and can be calculated by dividing current assets with
current liabilities.
Current Ratio = Current Asset / Current Liabilities
In this, current assets includes bank balance and cash in hand, debtors and inventory,
marketable securities excluding provision for doubtful debtors and bad debts, prepaid
expenses and bills receivables. Current liabilities entail bills payable, sundry creditors,
Paraphrase This Document
Need a fresh take? Get an instant paraphrase of this document with our AI Paraphraser
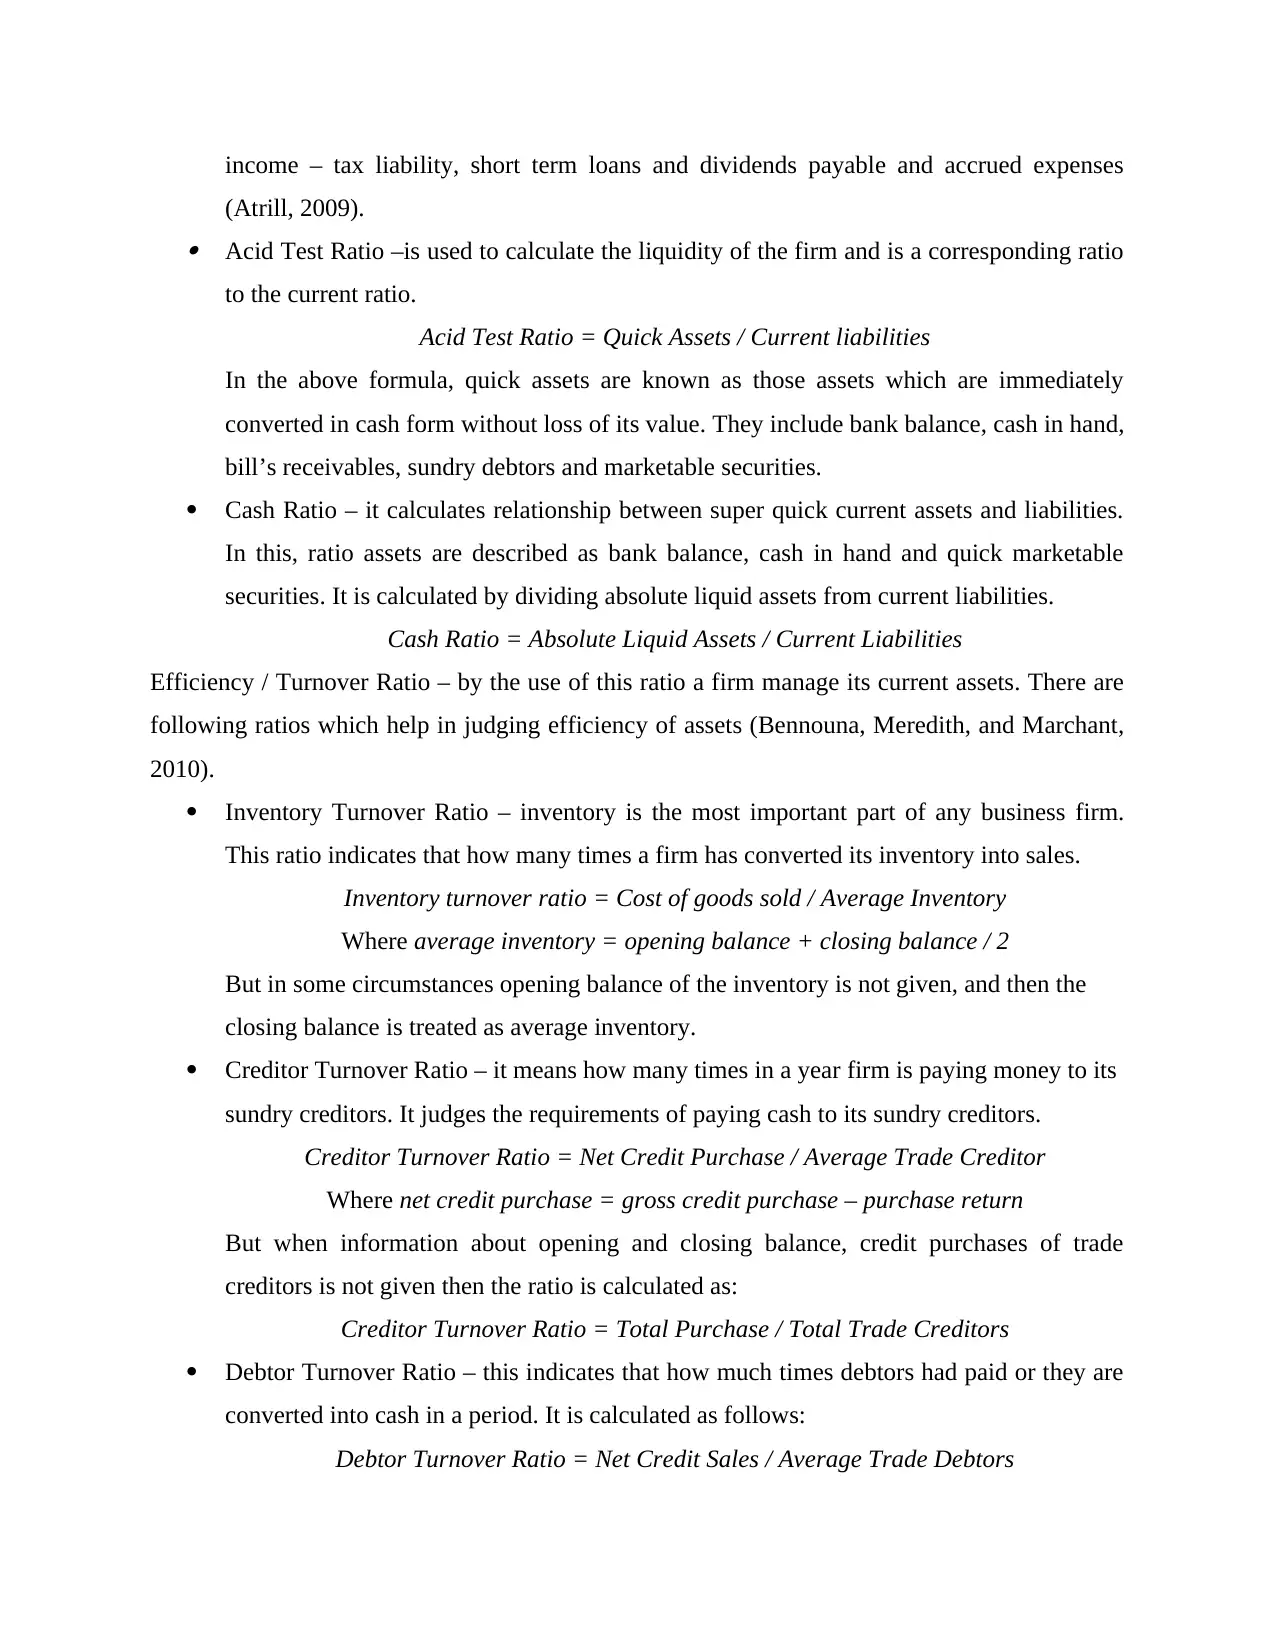
income – tax liability, short term loans and dividends payable and accrued expenses
(Atrill, 2009). Acid Test Ratio –is used to calculate the liquidity of the firm and is a corresponding ratio
to the current ratio.
Acid Test Ratio = Quick Assets / Current liabilities
In the above formula, quick assets are known as those assets which are immediately
converted in cash form without loss of its value. They include bank balance, cash in hand,
bill’s receivables, sundry debtors and marketable securities.
Cash Ratio – it calculates relationship between super quick current assets and liabilities.
In this, ratio assets are described as bank balance, cash in hand and quick marketable
securities. It is calculated by dividing absolute liquid assets from current liabilities.
Cash Ratio = Absolute Liquid Assets / Current Liabilities
Efficiency / Turnover Ratio – by the use of this ratio a firm manage its current assets. There are
following ratios which help in judging efficiency of assets (Bennouna, Meredith, and Marchant,
2010).
Inventory Turnover Ratio – inventory is the most important part of any business firm.
This ratio indicates that how many times a firm has converted its inventory into sales.
Inventory turnover ratio = Cost of goods sold / Average Inventory
Where average inventory = opening balance + closing balance / 2
But in some circumstances opening balance of the inventory is not given, and then the
closing balance is treated as average inventory.
Creditor Turnover Ratio – it means how many times in a year firm is paying money to its
sundry creditors. It judges the requirements of paying cash to its sundry creditors.
Creditor Turnover Ratio = Net Credit Purchase / Average Trade Creditor
Where net credit purchase = gross credit purchase – purchase return
But when information about opening and closing balance, credit purchases of trade
creditors is not given then the ratio is calculated as:
Creditor Turnover Ratio = Total Purchase / Total Trade Creditors
Debtor Turnover Ratio – this indicates that how much times debtors had paid or they are
converted into cash in a period. It is calculated as follows:
Debtor Turnover Ratio = Net Credit Sales / Average Trade Debtors
Where net credit sales = gross credit sale – sales return
&
Average trade debtors = opening + closing balance / 2
But when information of trade debtors is not available then it is calculated by following
method:
Debtor Turnover Ratio = Total Sales / Trade Debtors
Assets Turnover Ratio –shows the relationship between assets and sales. It is computed
by following formula:
Assets Turnover Ratio = Cost of goods sold / Average Total Assets
Profitability Raito – it measures the firms’ profitability. In the context of profitability, it
measures the operating efficiency of a firm and its ability to ensure adequate return in terms of
profits. Profitability ratio includes gross profit margin and net profit margin (Collier, 2012).
Gross Profit Margin - it measures the relationship between gross profit and sales. It is
calculated by following formula:
Gross Profit Margin = (Gross profit / Net sales) * 100
It is the difference between sales and cost of goods sold.
Net Profit Margin - it is a relationship between net profits and sales of a firm. Further, it
depicts the efficiency of firm’s management in administrating, manufacturing and selling
the products. It is calculated by the following formula:
Net Profit Margin = (Earnings after Tax / Net Sales) * 100
Performance Ratio – It provides relationship between returns of the firm and its total
investments. It is further divided in major four parts which are as follows (Dauber, 2012).
Return on Assets - it provides a relationship between net profits and net assets. To
calculate this ratio net profits and assets can be determined in various ways.
Return on Assets = (Net Profit after Tax / Average total assets) * 100
Return on Capital Employed – it provides relationship between capital employed and net
profit of the firm. Capital employed means funds are supplied by the owners and lenders.
Further it can be calculated as follows:
Return on Capital Employed = (Net Profit after Tax / Total capital Employed) * 100
⊘ This is a preview!⊘
Do you want full access?
Subscribe today to unlock all pages.
Trusted by 1+ million students worldwide
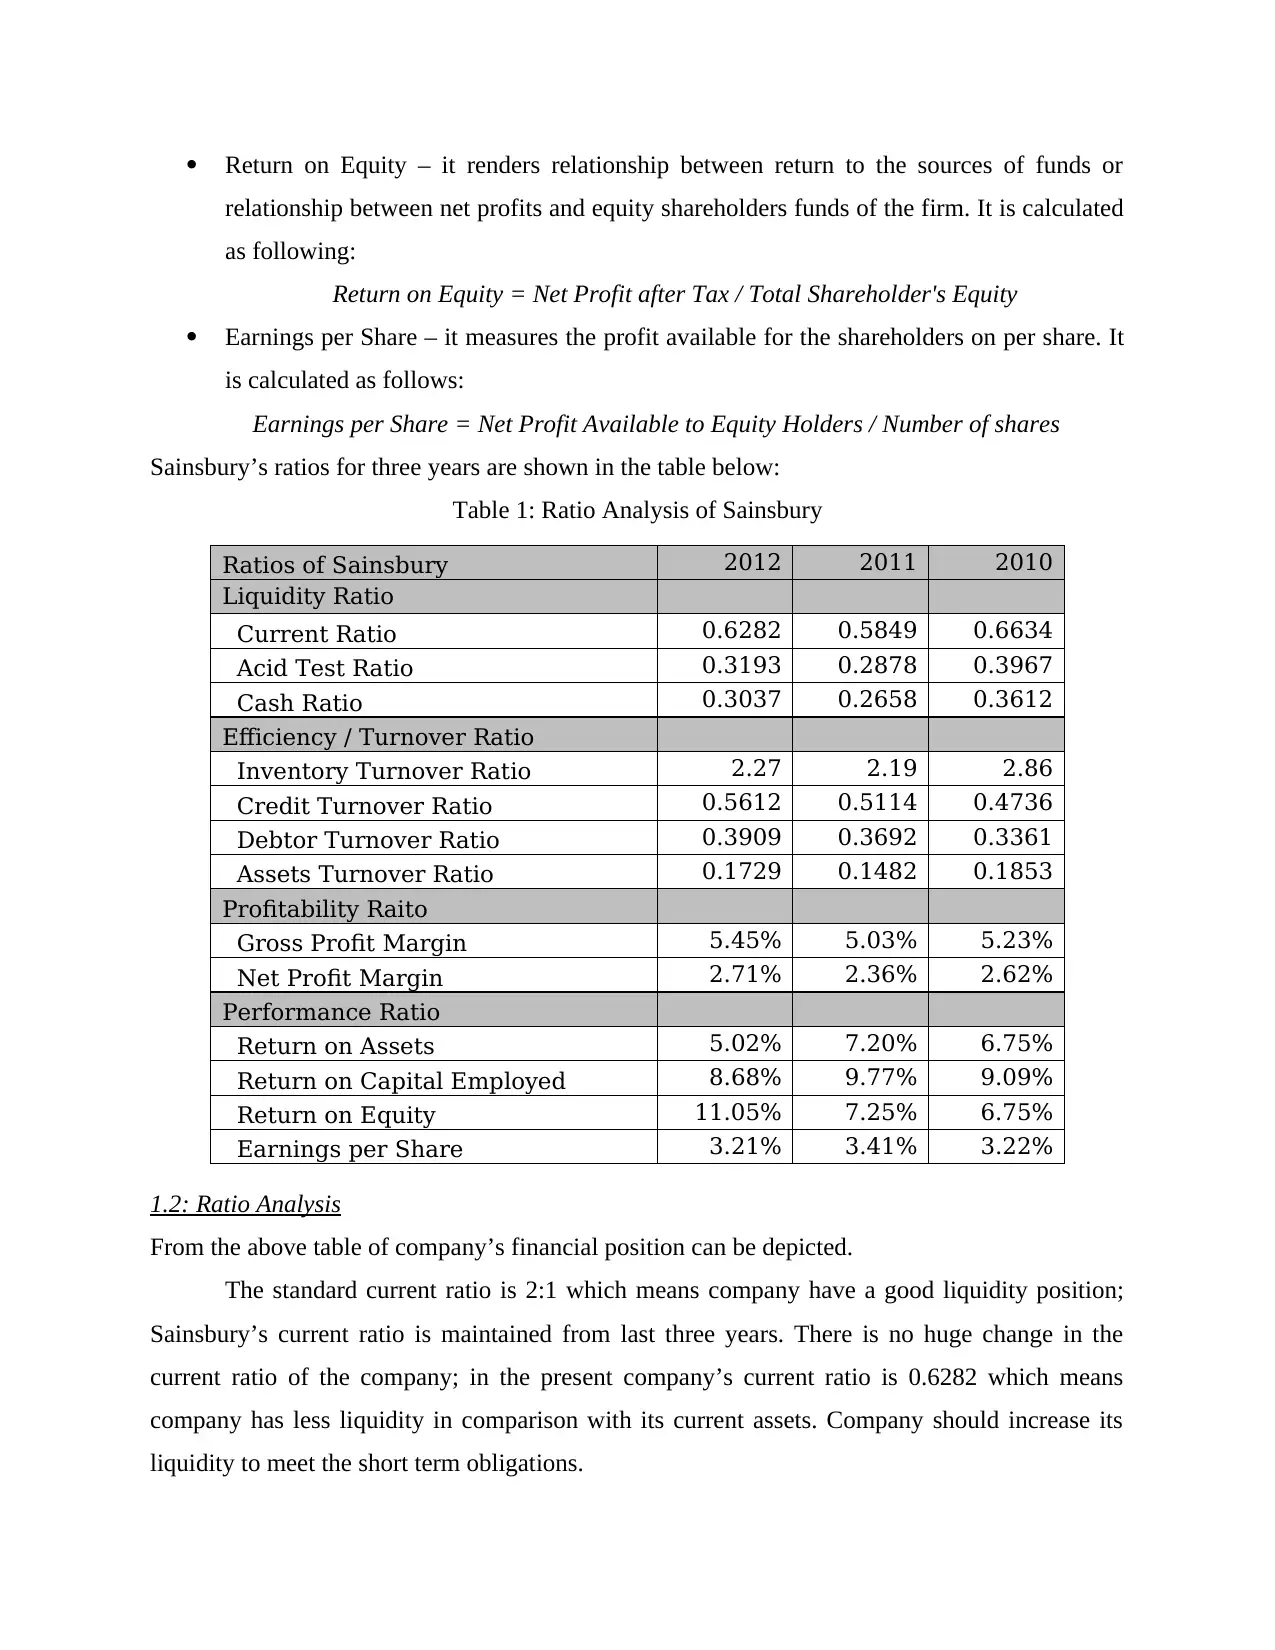
Return on Equity – it renders relationship between return to the sources of funds or
relationship between net profits and equity shareholders funds of the firm. It is calculated
as following:
Return on Equity = Net Profit after Tax / Total Shareholder's Equity
Earnings per Share – it measures the profit available for the shareholders on per share. It
is calculated as follows:
Earnings per Share = Net Profit Available to Equity Holders / Number of shares
Sainsbury’s ratios for three years are shown in the table below:
Table 1: Ratio Analysis of Sainsbury
Ratios of Sainsbury 2012 2011 2010
Liquidity Ratio
Current Ratio 0.6282 0.5849 0.6634
Acid Test Ratio 0.3193 0.2878 0.3967
Cash Ratio 0.3037 0.2658 0.3612
Efficiency / Turnover Ratio
Inventory Turnover Ratio 2.27 2.19 2.86
Credit Turnover Ratio 0.5612 0.5114 0.4736
Debtor Turnover Ratio 0.3909 0.3692 0.3361
Assets Turnover Ratio 0.1729 0.1482 0.1853
Profitability Raito
Gross Profit Margin 5.45% 5.03% 5.23%
Net Profit Margin 2.71% 2.36% 2.62%
Performance Ratio
Return on Assets 5.02% 7.20% 6.75%
Return on Capital Employed 8.68% 9.77% 9.09%
Return on Equity 11.05% 7.25% 6.75%
Earnings per Share 3.21% 3.41% 3.22%
1.2: Ratio Analysis
From the above table of company’s financial position can be depicted.
The standard current ratio is 2:1 which means company have a good liquidity position;
Sainsbury’s current ratio is maintained from last three years. There is no huge change in the
current ratio of the company; in the present company’s current ratio is 0.6282 which means
company has less liquidity in comparison with its current assets. Company should increase its
liquidity to meet the short term obligations.
Paraphrase This Document
Need a fresh take? Get an instant paraphrase of this document with our AI Paraphraser
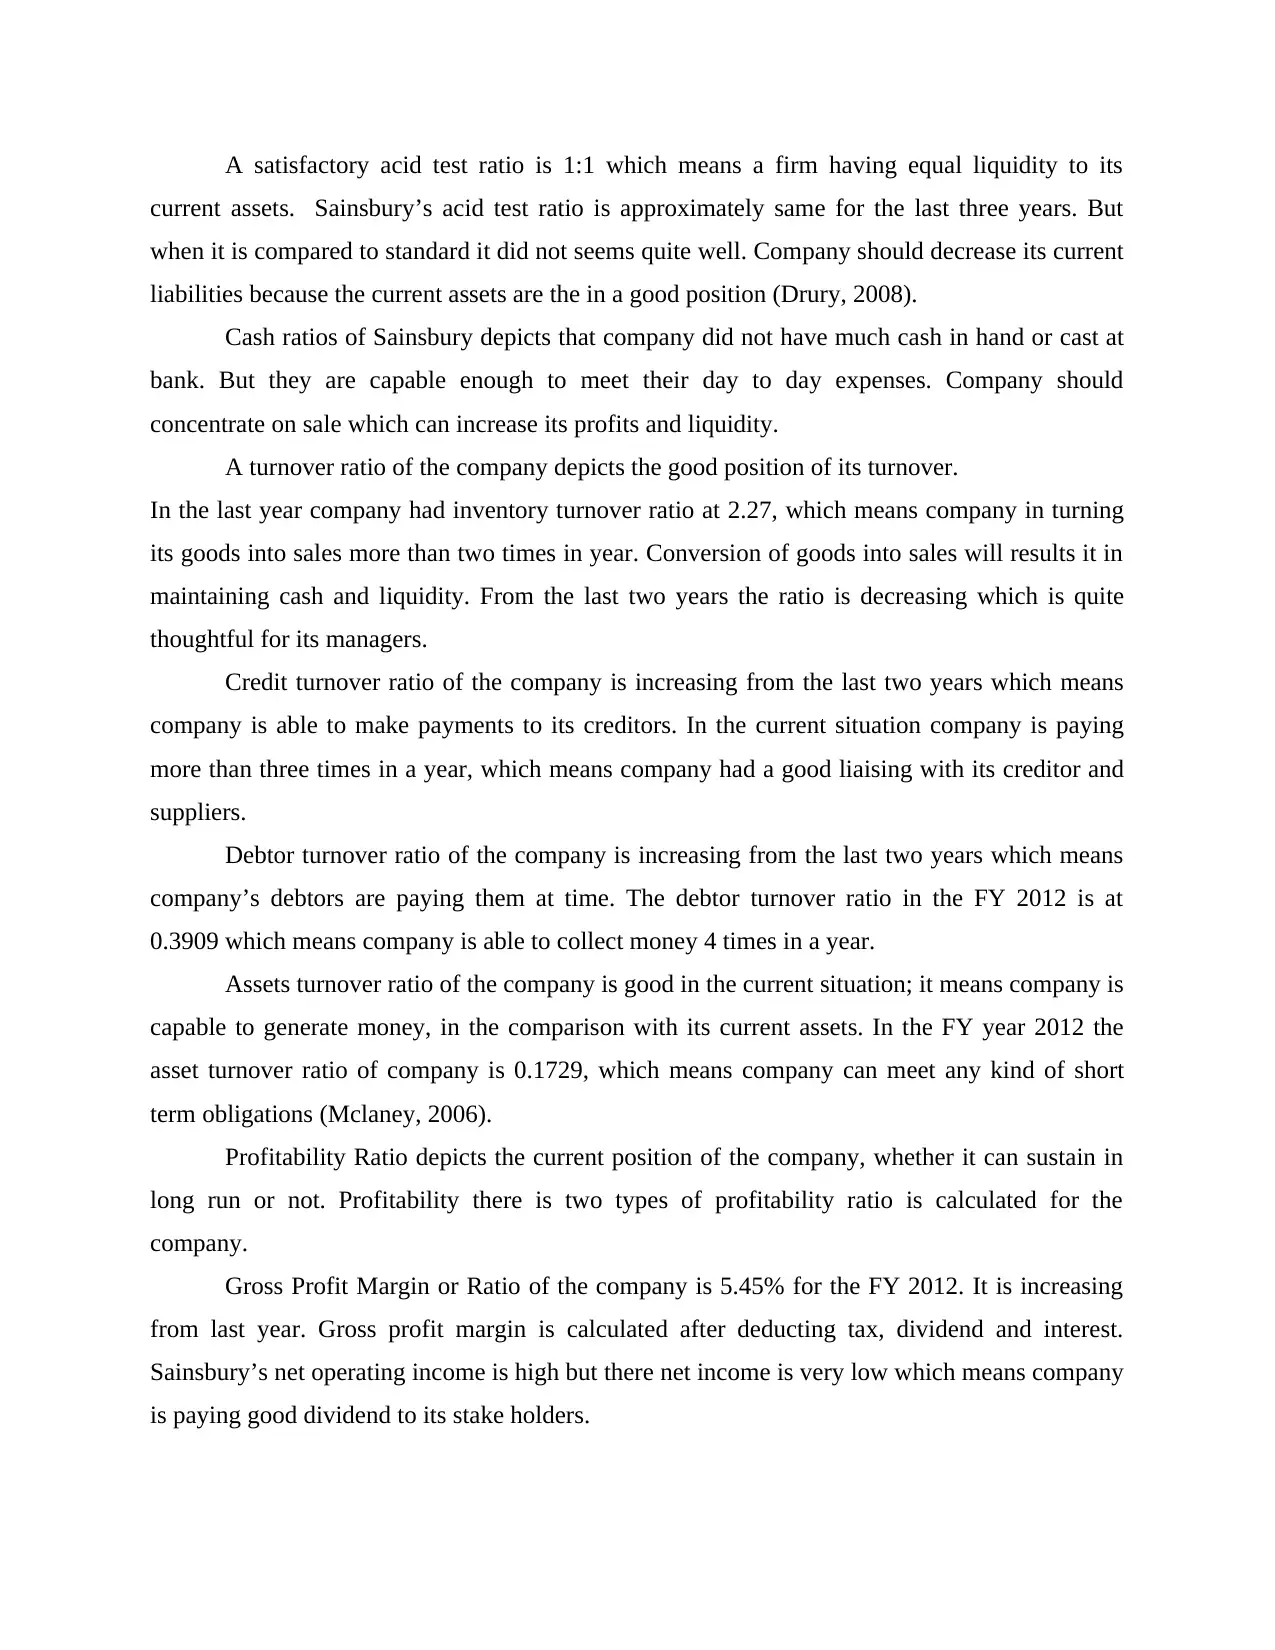
A satisfactory acid test ratio is 1:1 which means a firm having equal liquidity to its
current assets. Sainsbury’s acid test ratio is approximately same for the last three years. But
when it is compared to standard it did not seems quite well. Company should decrease its current
liabilities because the current assets are the in a good position (Drury, 2008).
Cash ratios of Sainsbury depicts that company did not have much cash in hand or cast at
bank. But they are capable enough to meet their day to day expenses. Company should
concentrate on sale which can increase its profits and liquidity.
A turnover ratio of the company depicts the good position of its turnover.
In the last year company had inventory turnover ratio at 2.27, which means company in turning
its goods into sales more than two times in year. Conversion of goods into sales will results it in
maintaining cash and liquidity. From the last two years the ratio is decreasing which is quite
thoughtful for its managers.
Credit turnover ratio of the company is increasing from the last two years which means
company is able to make payments to its creditors. In the current situation company is paying
more than three times in a year, which means company had a good liaising with its creditor and
suppliers.
Debtor turnover ratio of the company is increasing from the last two years which means
company’s debtors are paying them at time. The debtor turnover ratio in the FY 2012 is at
0.3909 which means company is able to collect money 4 times in a year.
Assets turnover ratio of the company is good in the current situation; it means company is
capable to generate money, in the comparison with its current assets. In the FY year 2012 the
asset turnover ratio of company is 0.1729, which means company can meet any kind of short
term obligations (Mclaney, 2006).
Profitability Ratio depicts the current position of the company, whether it can sustain in
long run or not. Profitability there is two types of profitability ratio is calculated for the
company.
Gross Profit Margin or Ratio of the company is 5.45% for the FY 2012. It is increasing
from last year. Gross profit margin is calculated after deducting tax, dividend and interest.
Sainsbury’s net operating income is high but there net income is very low which means company
is paying good dividend to its stake holders.
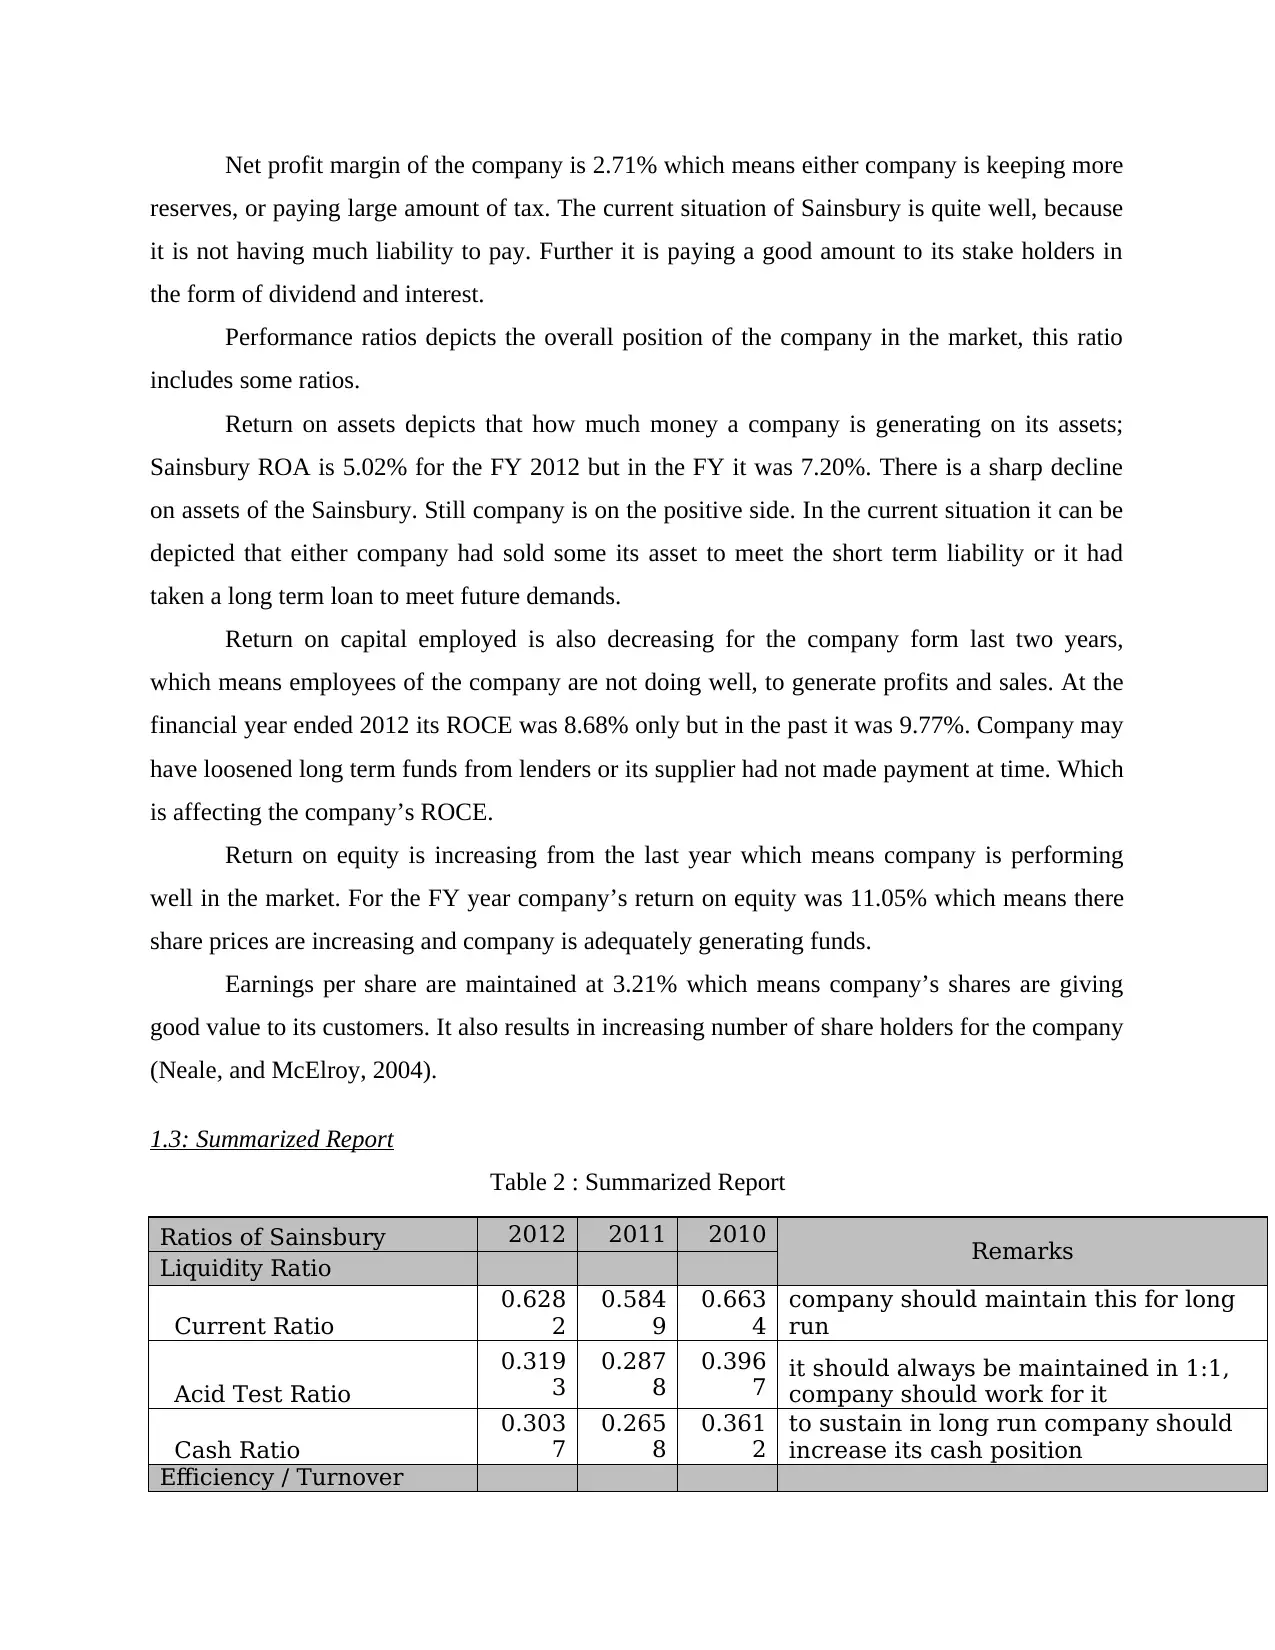
Net profit margin of the company is 2.71% which means either company is keeping more
reserves, or paying large amount of tax. The current situation of Sainsbury is quite well, because
it is not having much liability to pay. Further it is paying a good amount to its stake holders in
the form of dividend and interest.
Performance ratios depicts the overall position of the company in the market, this ratio
includes some ratios.
Return on assets depicts that how much money a company is generating on its assets;
Sainsbury ROA is 5.02% for the FY 2012 but in the FY it was 7.20%. There is a sharp decline
on assets of the Sainsbury. Still company is on the positive side. In the current situation it can be
depicted that either company had sold some its asset to meet the short term liability or it had
taken a long term loan to meet future demands.
Return on capital employed is also decreasing for the company form last two years,
which means employees of the company are not doing well, to generate profits and sales. At the
financial year ended 2012 its ROCE was 8.68% only but in the past it was 9.77%. Company may
have loosened long term funds from lenders or its supplier had not made payment at time. Which
is affecting the company’s ROCE.
Return on equity is increasing from the last year which means company is performing
well in the market. For the FY year company’s return on equity was 11.05% which means there
share prices are increasing and company is adequately generating funds.
Earnings per share are maintained at 3.21% which means company’s shares are giving
good value to its customers. It also results in increasing number of share holders for the company
(Neale, and McElroy, 2004).
1.3: Summarized Report
Table 2 : Summarized Report
Ratios of Sainsbury 2012 2011 2010 Remarks
Liquidity Ratio
Current Ratio
0.628
2
0.584
9
0.663
4
company should maintain this for long
run
Acid Test Ratio
0.319
3
0.287
8
0.396
7 it should always be maintained in 1:1,
company should work for it
Cash Ratio
0.303
7
0.265
8
0.361
2
to sustain in long run company should
increase its cash position
Efficiency / Turnover
⊘ This is a preview!⊘
Do you want full access?
Subscribe today to unlock all pages.
Trusted by 1+ million students worldwide
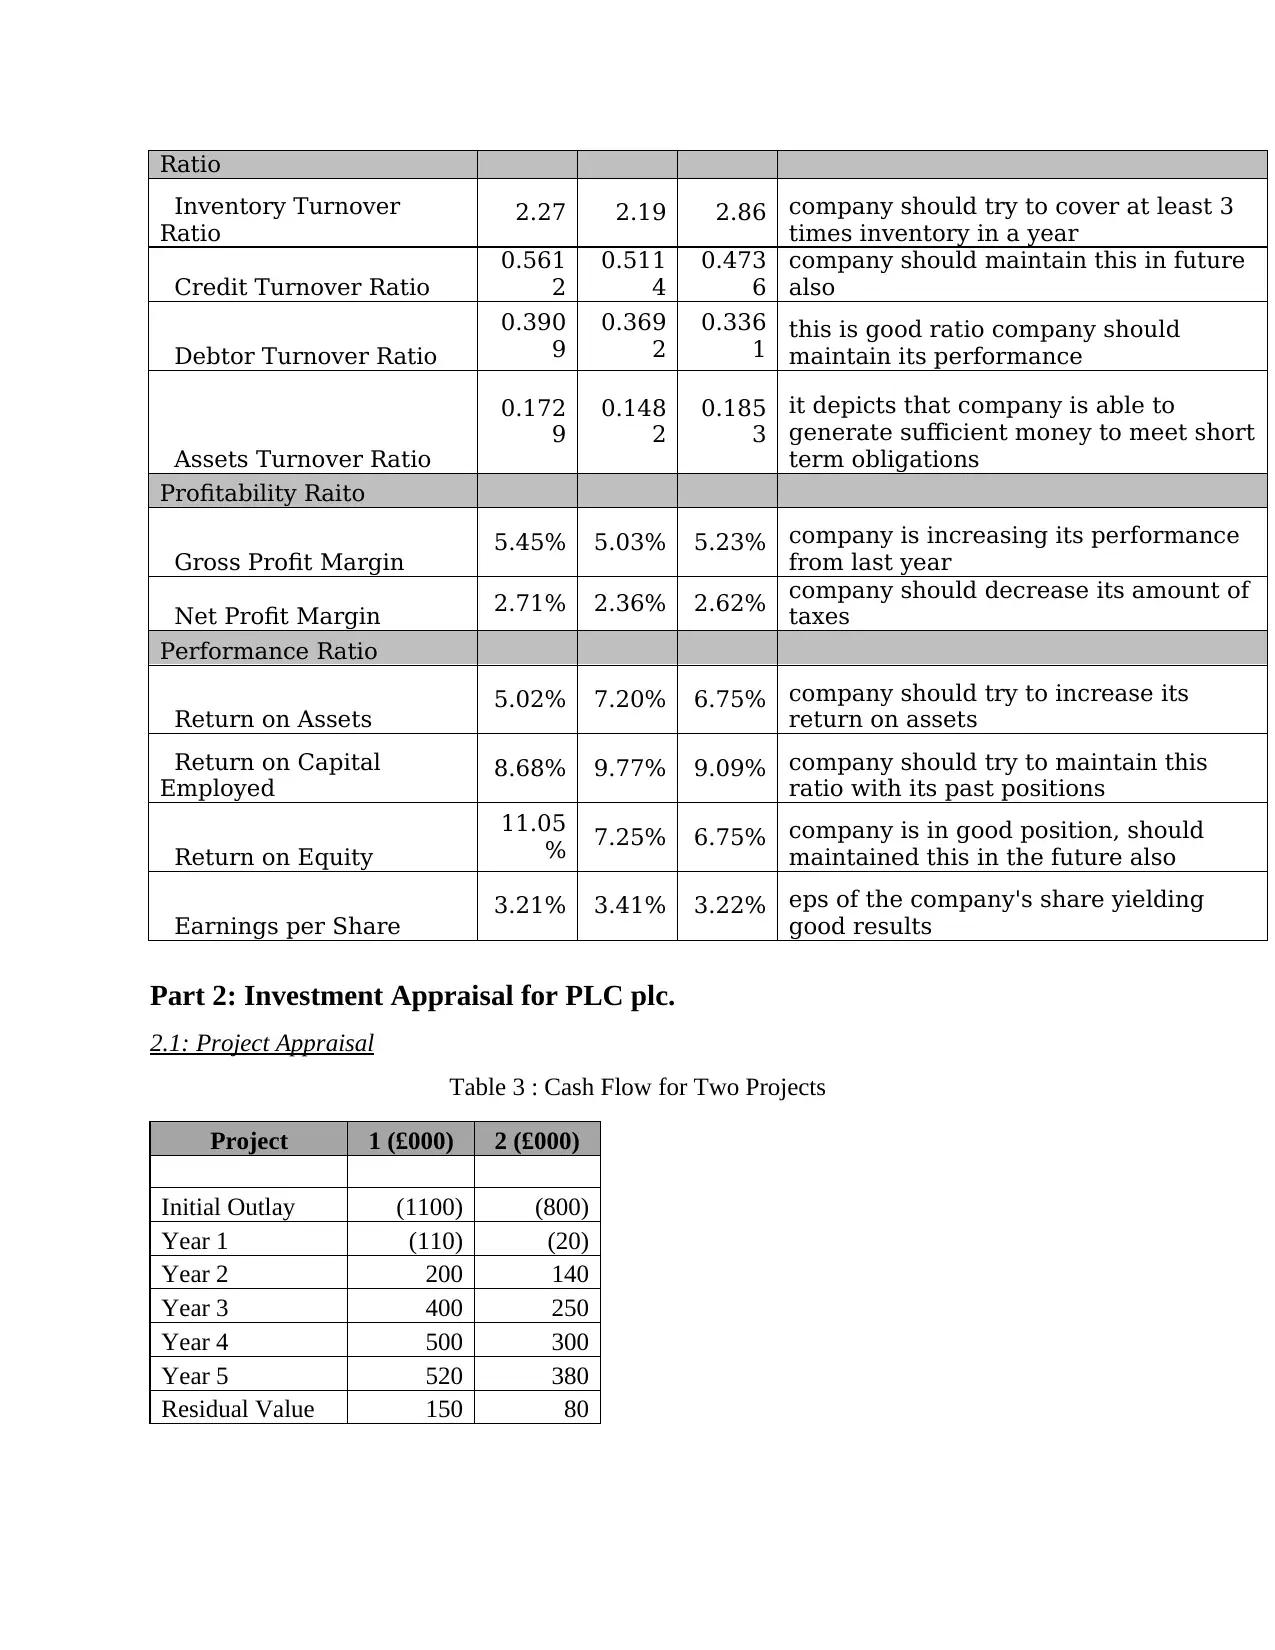
Ratio
Inventory Turnover
Ratio 2.27 2.19 2.86 company should try to cover at least 3
times inventory in a year
Credit Turnover Ratio
0.561
2
0.511
4
0.473
6
company should maintain this in future
also
Debtor Turnover Ratio
0.390
9
0.369
2
0.336
1 this is good ratio company should
maintain its performance
Assets Turnover Ratio
0.172
9
0.148
2
0.185
3
it depicts that company is able to
generate sufficient money to meet short
term obligations
Profitability Raito
Gross Profit Margin 5.45% 5.03% 5.23% company is increasing its performance
from last year
Net Profit Margin 2.71% 2.36% 2.62% company should decrease its amount of
taxes
Performance Ratio
Return on Assets 5.02% 7.20% 6.75% company should try to increase its
return on assets
Return on Capital
Employed 8.68% 9.77% 9.09% company should try to maintain this
ratio with its past positions
Return on Equity
11.05
% 7.25% 6.75% company is in good position, should
maintained this in the future also
Earnings per Share 3.21% 3.41% 3.22% eps of the company's share yielding
good results
Part 2: Investment Appraisal for PLC plc.
2.1: Project Appraisal
Table 3 : Cash Flow for Two Projects
Project 1 (£000) 2 (£000)
Initial Outlay (1100) (800)
Year 1 (110) (20)
Year 2 200 140
Year 3 400 250
Year 4 500 300
Year 5 520 380
Residual Value 150 80
Paraphrase This Document
Need a fresh take? Get an instant paraphrase of this document with our AI Paraphraser
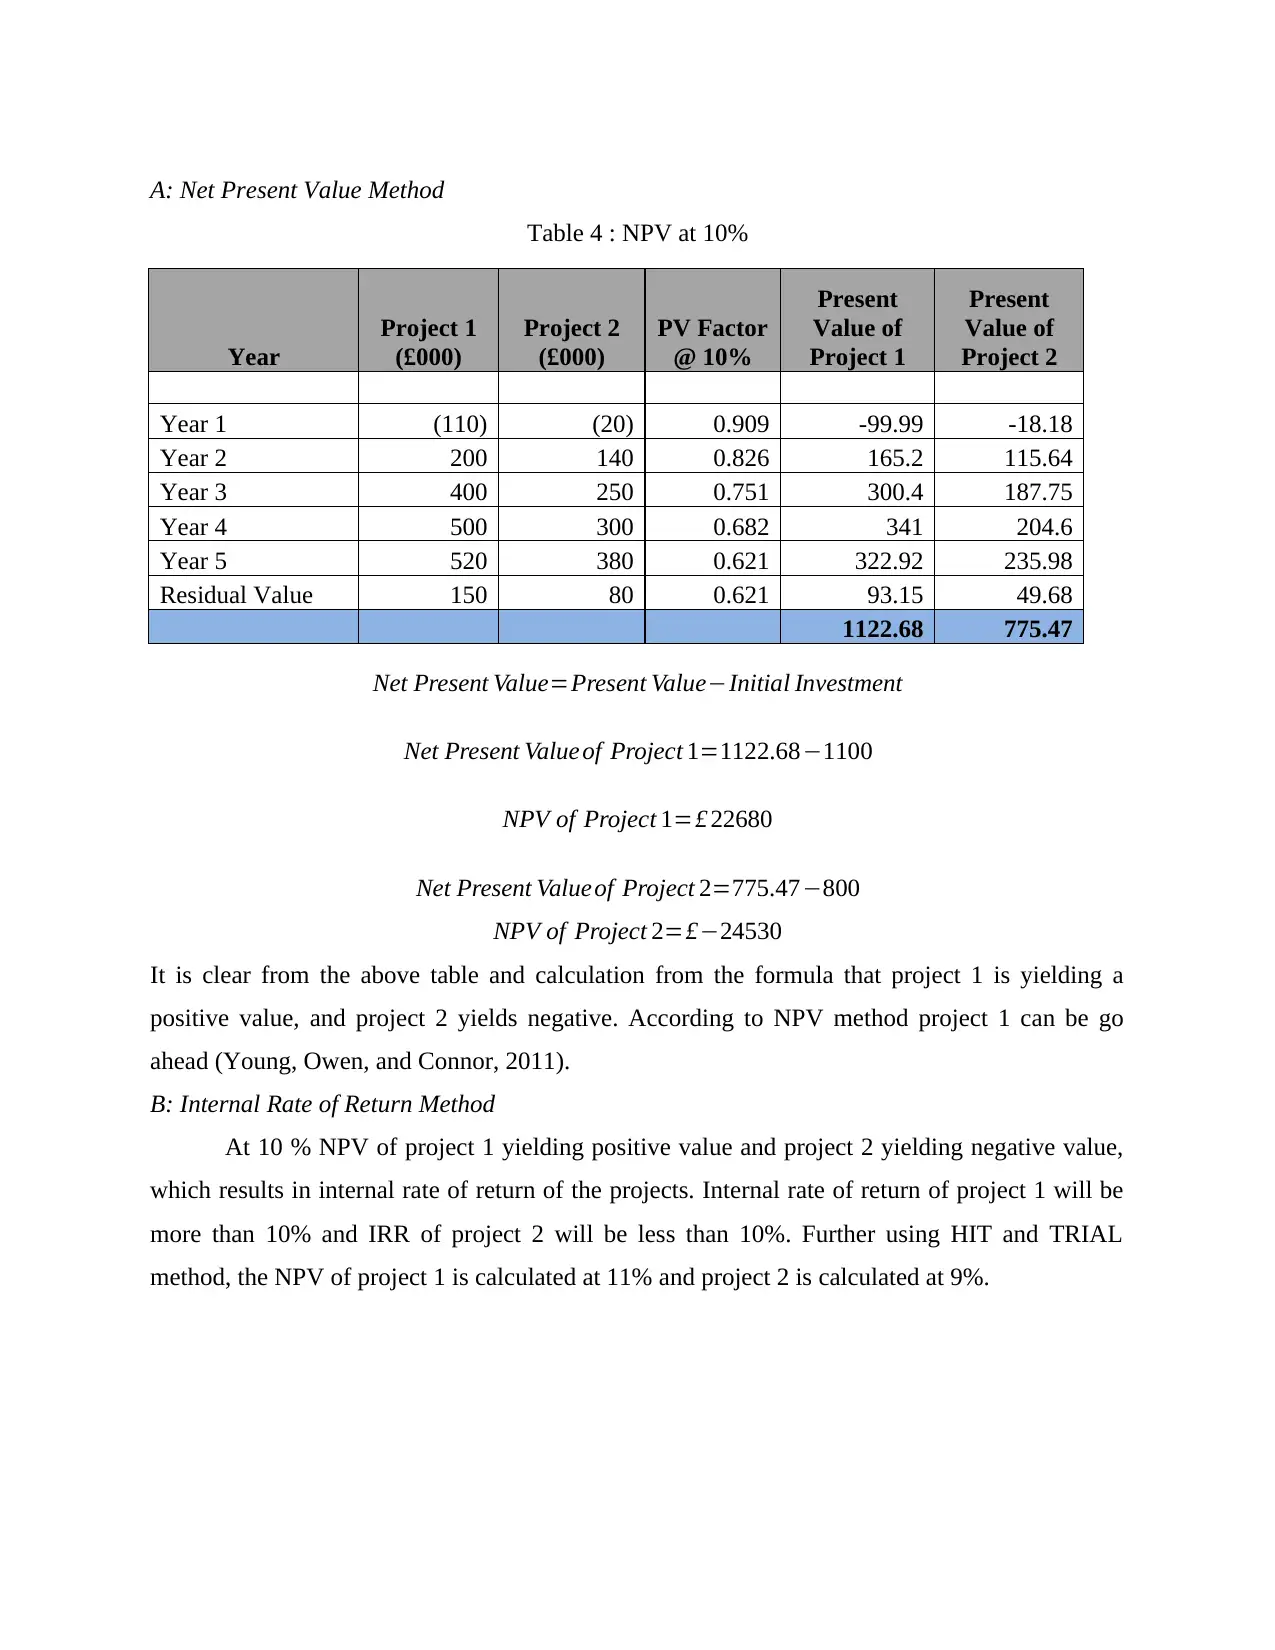
A: Net Present Value Method
Table 4 : NPV at 10%
Year
Project 1
(£000)
Project 2
(£000)
PV Factor
@ 10%
Present
Value of
Project 1
Present
Value of
Project 2
Year 1 (110) (20) 0.909 -99.99 -18.18
Year 2 200 140 0.826 165.2 115.64
Year 3 400 250 0.751 300.4 187.75
Year 4 500 300 0.682 341 204.6
Year 5 520 380 0.621 322.92 235.98
Residual Value 150 80 0.621 93.15 49.68
1122.68 775.47
Net Present Value=Present Value−Initial Investment
Net Present Value of Project 1=1122.68−1100
NPV of Project 1=£ 22680
Net Present Valueof Project 2=775.47−800
NPV of Project 2=£−24530
It is clear from the above table and calculation from the formula that project 1 is yielding a
positive value, and project 2 yields negative. According to NPV method project 1 can be go
ahead (Young, Owen, and Connor, 2011).
B: Internal Rate of Return Method
At 10 % NPV of project 1 yielding positive value and project 2 yielding negative value,
which results in internal rate of return of the projects. Internal rate of return of project 1 will be
more than 10% and IRR of project 2 will be less than 10%. Further using HIT and TRIAL
method, the NPV of project 1 is calculated at 11% and project 2 is calculated at 9%.
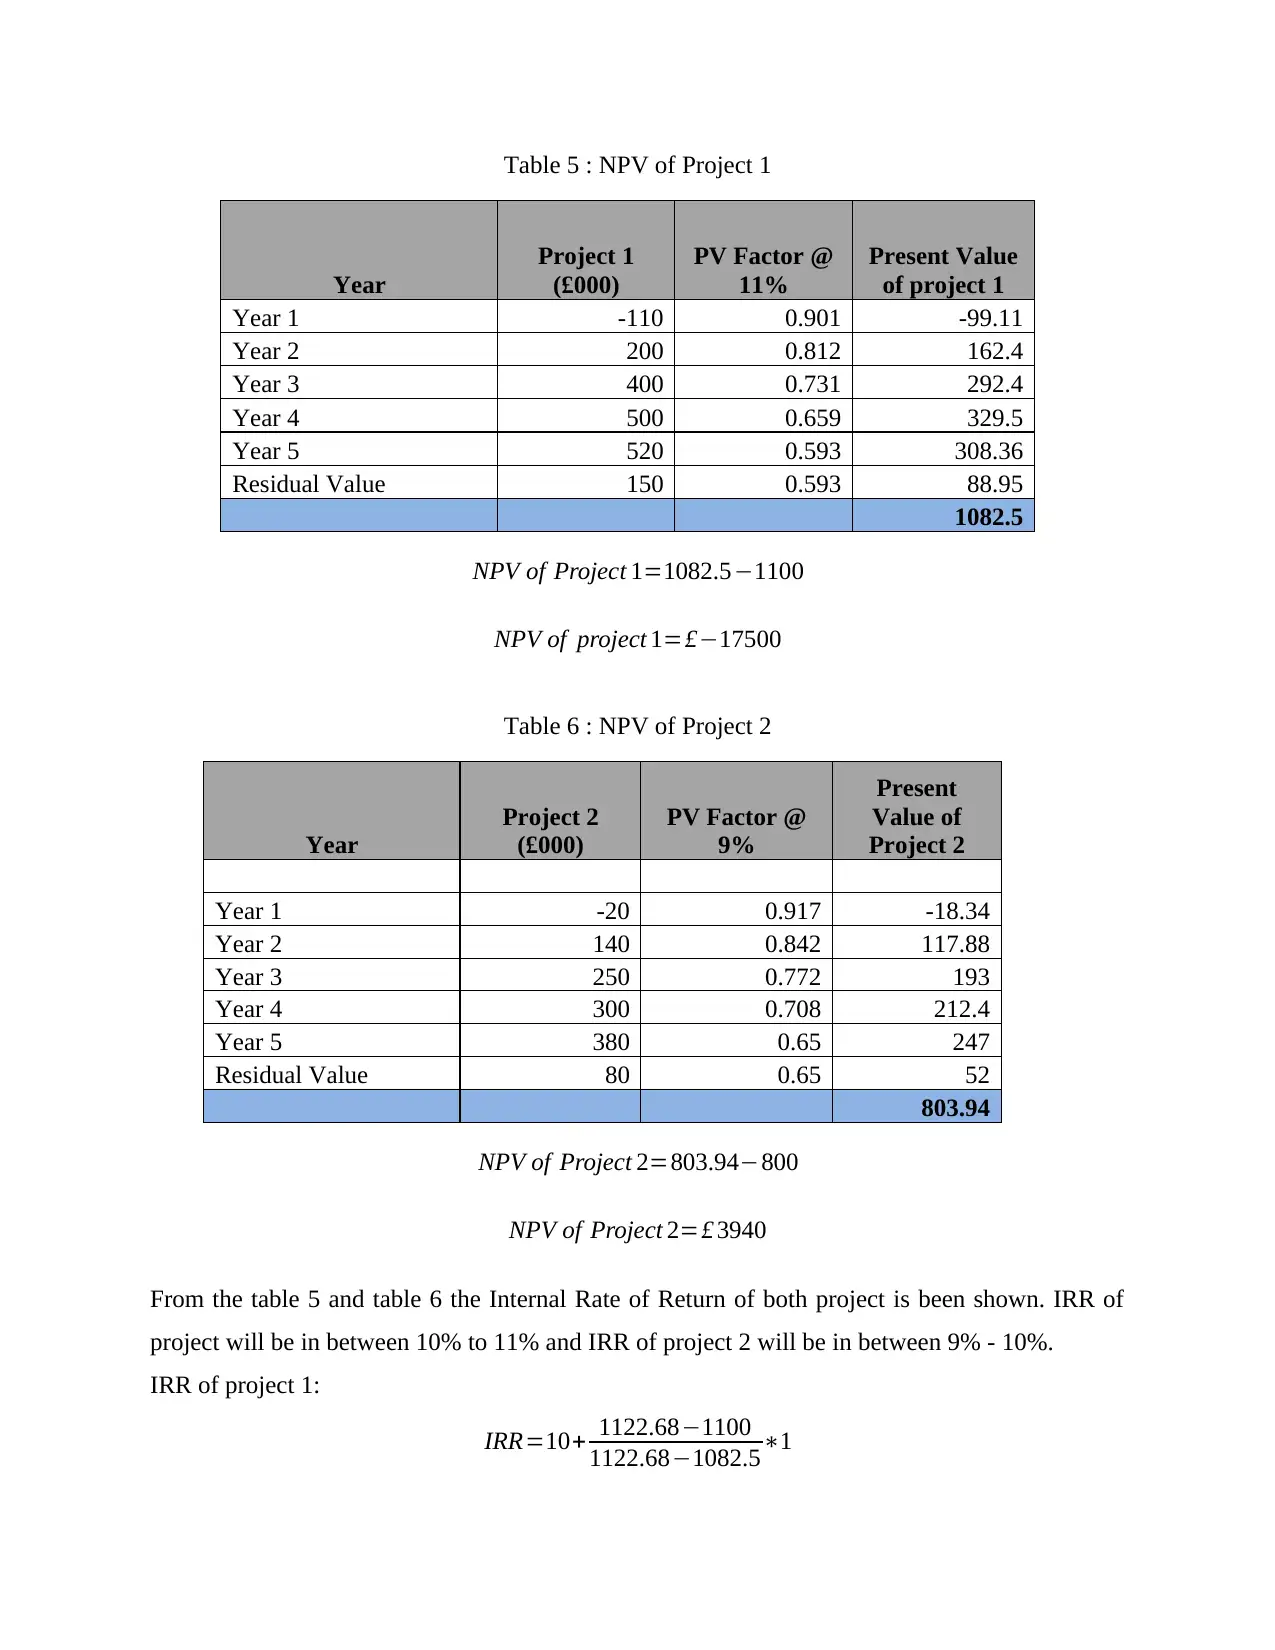
Table 5 : NPV of Project 1
Year
Project 1
(£000)
PV Factor @
11%
Present Value
of project 1
Year 1 -110 0.901 -99.11
Year 2 200 0.812 162.4
Year 3 400 0.731 292.4
Year 4 500 0.659 329.5
Year 5 520 0.593 308.36
Residual Value 150 0.593 88.95
1082.5
NPV of Project 1=1082.5−1100
NPV of project 1=£−17500
Table 6 : NPV of Project 2
Year
Project 2
(£000)
PV Factor @
9%
Present
Value of
Project 2
Year 1 -20 0.917 -18.34
Year 2 140 0.842 117.88
Year 3 250 0.772 193
Year 4 300 0.708 212.4
Year 5 380 0.65 247
Residual Value 80 0.65 52
803.94
NPV of Project 2=803.94−800
NPV of Project 2=£ 3940
From the table 5 and table 6 the Internal Rate of Return of both project is been shown. IRR of
project will be in between 10% to 11% and IRR of project 2 will be in between 9% - 10%.
IRR of project 1:
IRR=10+ 1122.68−1100
1122.68−1082.5∗1
Year
Project 1
(£000)
PV Factor @
11%
Present Value
of project 1
Year 1 -110 0.901 -99.11
Year 2 200 0.812 162.4
Year 3 400 0.731 292.4
Year 4 500 0.659 329.5
Year 5 520 0.593 308.36
Residual Value 150 0.593 88.95
1082.5
NPV of Project 1=1082.5−1100
NPV of project 1=£−17500
Table 6 : NPV of Project 2
Year
Project 2
(£000)
PV Factor @
9%
Present
Value of
Project 2
Year 1 -20 0.917 -18.34
Year 2 140 0.842 117.88
Year 3 250 0.772 193
Year 4 300 0.708 212.4
Year 5 380 0.65 247
Residual Value 80 0.65 52
803.94
NPV of Project 2=803.94−800
NPV of Project 2=£ 3940
From the table 5 and table 6 the Internal Rate of Return of both project is been shown. IRR of
project will be in between 10% to 11% and IRR of project 2 will be in between 9% - 10%.
IRR of project 1:
IRR=10+ 1122.68−1100
1122.68−1082.5∗1
⊘ This is a preview!⊘
Do you want full access?
Subscribe today to unlock all pages.
Trusted by 1+ million students worldwide
1 out of 24
Related Documents


Your All-in-One AI-Powered Toolkit for Academic Success.
+13062052269
info@desklib.com
Available 24*7 on WhatsApp / Email
![[object Object]](/_next/static/media/star-bottom.7253800d.svg)
Unlock your academic potential
Copyright © 2020–2026 A2Z Services. All Rights Reserved. Developed and managed by ZUCOL.