Strategic Financial Management: Samsung Plc Financial Analysis Report
VerifiedAdded on 2021/02/20
|16
|4113
|626
Report
AI Summary
This report provides a comprehensive analysis of strategic financial management, focusing on Samsung Plc as a case study. It begins with an introduction to strategic financial management and its importance, followed by an evaluation of the sources of financial data used to understand business strategy, the need for financial data in strategy formulation, and an analysis of financial risks. The report then reviews techniques for assessing investment proposals, including Net Present Value (NPV), payback period, Accounting Rate of Return (ARR), and Internal Rate of Return (IRR). The second part of the report focuses on the interpretation of Samsung Plc's financial statements through ratio analysis. It calculates and interprets various profitability, liquidity, solvency, and turnover ratios. The analysis includes gross profit ratio, net profit ratio, current ratio, quick ratio, debt-equity ratio, interest coverage ratio, and fixed asset turnover ratio. The report provides insights into Samsung Plc's financial performance and offers recommendations based on the analysis.

Finance for Strategic
Managers
Managers
Paraphrase This Document
Need a fresh take? Get an instant paraphrase of this document with our AI Paraphraser
Contents
INTRODUCTION
Strategic financial management is a process by which company manages its finances to
by doing business operations in efficient and effective manner to succeed in enhancing its
profitability. Strategic managers of an business organisation shall required to have full
knowledge related to financial management which is essential for long term survivability of the
company. For better understanding of this topic, a company named Samsung Plc is given for
better understanding which is engaged in providing various electronic innovative products such
as smart phones, television and so on. Evaluation of financial statements of Samsung Plc is also
given in such report to asses the current viability of the company and making recommendations
based on such interpretation.
TASK 1
Evaluation of the sources of financial data that are utilised for knowing the business strategy:
Financial information of an company like Samsung Plc are very useful for it key
stakeholders to measuring the its business strategy which a company has made for its future
business operations. Such information is also help the company in evaluating its business
processes in finding that whether it perform well in achieve its goals and objectives (Gliedt and
Hoicka, 2015). some of the financial data that are helpful in identify its business strategy which
is as follows:
Net cash available: Any company's net cash may gives information about its
financial fitness. More cash in hand in an organisation indicates that company has
utilising its financial resources in efficient and effective manner to generate more
cash for new investments (Ward, 2012).
Revenue Growth: A good growth in company's revenue shall indicate that it has
performed its business operations in good manner and it indicates that company has
good scope in future and company has capability to succeed in the long run.
Profitability ratios: It ratios provides the information about operational efficiency of
an company and provides the areas where company is required to take some
corrective actions. It may be helpful for various key stakeholders in knowing the
various information about the company's business strategy because it takes various
aspects of its operations such sales, profits in the given accounting period.
1
⊘ This is a preview!⊘
Do you want full access?
Subscribe today to unlock all pages.
Trusted by 1+ million students worldwide
Assessment for need of financial data and information for formulation of business strategy:
In any business organisation, financial data is very beneficial as they provide the valuable
information about the such company to the management and helps the management staff in in
formulation of its key business strategy. Some of need of financial data in formulation process
are as follows:
Vision statement: Creation of this statement of a company requires the information and
data related to its financial data because by assessing the current financial position of an
organisation, it may be able to make its vision statement (Stead and Stead, 2014).
Therefore, it is said that such statement acts as a road map that help the company in
guiding the management staff related to its internal works. But on the other hands,
preparation of such is not so much easy because company has to take a balanced view
that includes both forward looking view along with providing ideal state while creating
vision statement.
Mission statement: This statement may be defined as company's long term plans which it
wants to fulfil in log run. For establishing the mission statements of an company, various
financial information such net cash available in present, its profitability position etc.
(Hill, Jones and Schilling, 2014). In other words, it may be said that it is a statement
which defines about organisation's philosophy, identify and their future plans. This will
assist it in formulating its goals and objectives to provide direction for its day to day
business activities.
Analysis of risks related to financial business decision:
These include various type of risks when an organisation its finance related decisions,
some of are as follows:
Market risk: It relates with risk when a company wants to change the conditions related
to market place from where it compete for its business. In other words, market from
where an organisation sells its products plays a significant role, if market is neutral for
its new product then it is said that company has no power to influence such market.
Credit risk: It is risk which is related to its customer when a company decide to change
its credit period. Company shall required to assess all the possible effects of such change
and according take decision. If by decreasing the credit period given to customer,
2
Paraphrase This Document
Need a fresh take? Get an instant paraphrase of this document with our AI Paraphraser
consumers of such company has starts decreases, then it is said that company has not do
it and this is called credit risk
Liquidity risk: This is related to company's liquidity position, this mean that company
shall required to manage its working capital requirements in such a manner that it does
not effect in adverse manner (Balogun, Bartunek and Do, 2015).
Review of techniques that may be used in assessing investment proposals:
There are various methods available for evaluating the company's several capital
expenditure projects, these are as follows:
Net present value: NPV technique is utilised by the company for measuring
various investment projects of the company by calculating the present cash
inflows and present cash outflows. Thereafter, PV of cash outflows are deducted
from P.V of net cash inflow (Andreu, Ortiz and Sarto, 2014).
Payback period: in simple words, payback period is the period which an
investment projects shall take to recover the cost of its initial investment. If
payback period is less than investment proposal total period, then it is said that the
proposed project is viable.
Accounting rate of return: Another name of such technique is average rate which
is utilised for taking various long term investing decisions. Main unique feature of
this method is that such method uses the expected net operating income but all
other methods gives more more emphasis on the cash flows.
Internal rate of return: Such technique assists the companies in evaluating the
profitability level of potential investments. If such return is more than cost of
capital of proposed investment then it is said that investment proposal is viable
and company shall require to accept such proposal (Davis and Tama‐Sweet,
2012).
TASK 2
Interpretation of financial statements of Samsung Plc by ratio analysis:
Financial statements of an organisation shall includes profit and loss account, balance
sheet, CFS and so on which provides the its financial position and profitability position and cash
flow position. Interpretation of these financial statements shall include financial evaluation of
3
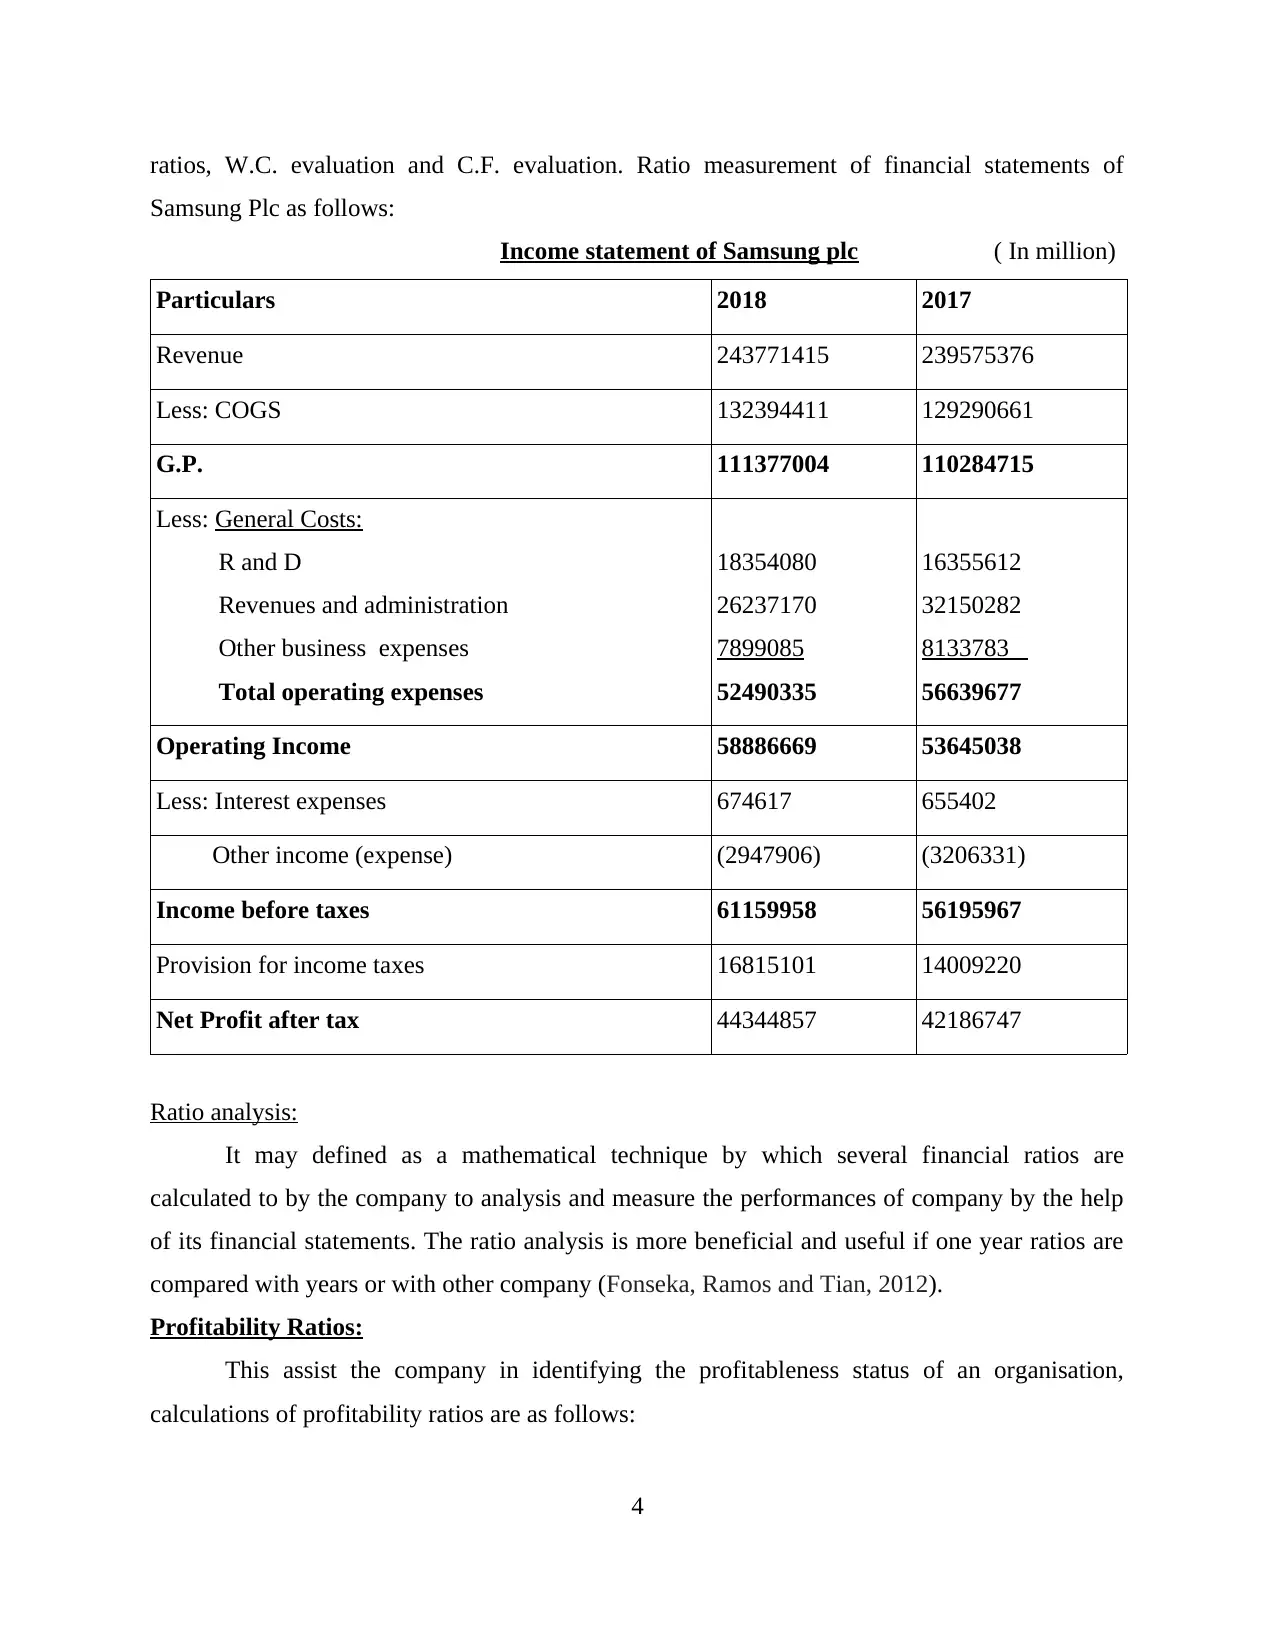
ratios, W.C. evaluation and C.F. evaluation. Ratio measurement of financial statements of
Samsung Plc as follows:
Income statement of Samsung plc ( In million)
Particulars 2018 2017
Revenue 243771415 239575376
Less: COGS 132394411 129290661
G.P. 111377004 110284715
Less: General Costs:
R and D
Revenues and administration
Other business expenses
Total operating expenses
18354080
26237170
7899085
52490335
16355612
32150282
8133783
56639677
Operating Income 58886669 53645038
Less: Interest expenses 674617 655402
Other income (expense) (2947906) (3206331)
Income before taxes 61159958 56195967
Provision for income taxes 16815101 14009220
Net Profit after tax 44344857 42186747
Ratio analysis:
It may defined as a mathematical technique by which several financial ratios are
calculated to by the company to analysis and measure the performances of company by the help
of its financial statements. The ratio analysis is more beneficial and useful if one year ratios are
compared with years or with other company (Fonseka, Ramos and Tian, 2012).
Profitability Ratios:
This assist the company in identifying the profitableness status of an organisation,
calculations of profitability ratios are as follows:
4
⊘ This is a preview!⊘
Do you want full access?
Subscribe today to unlock all pages.
Trusted by 1+ million students worldwide
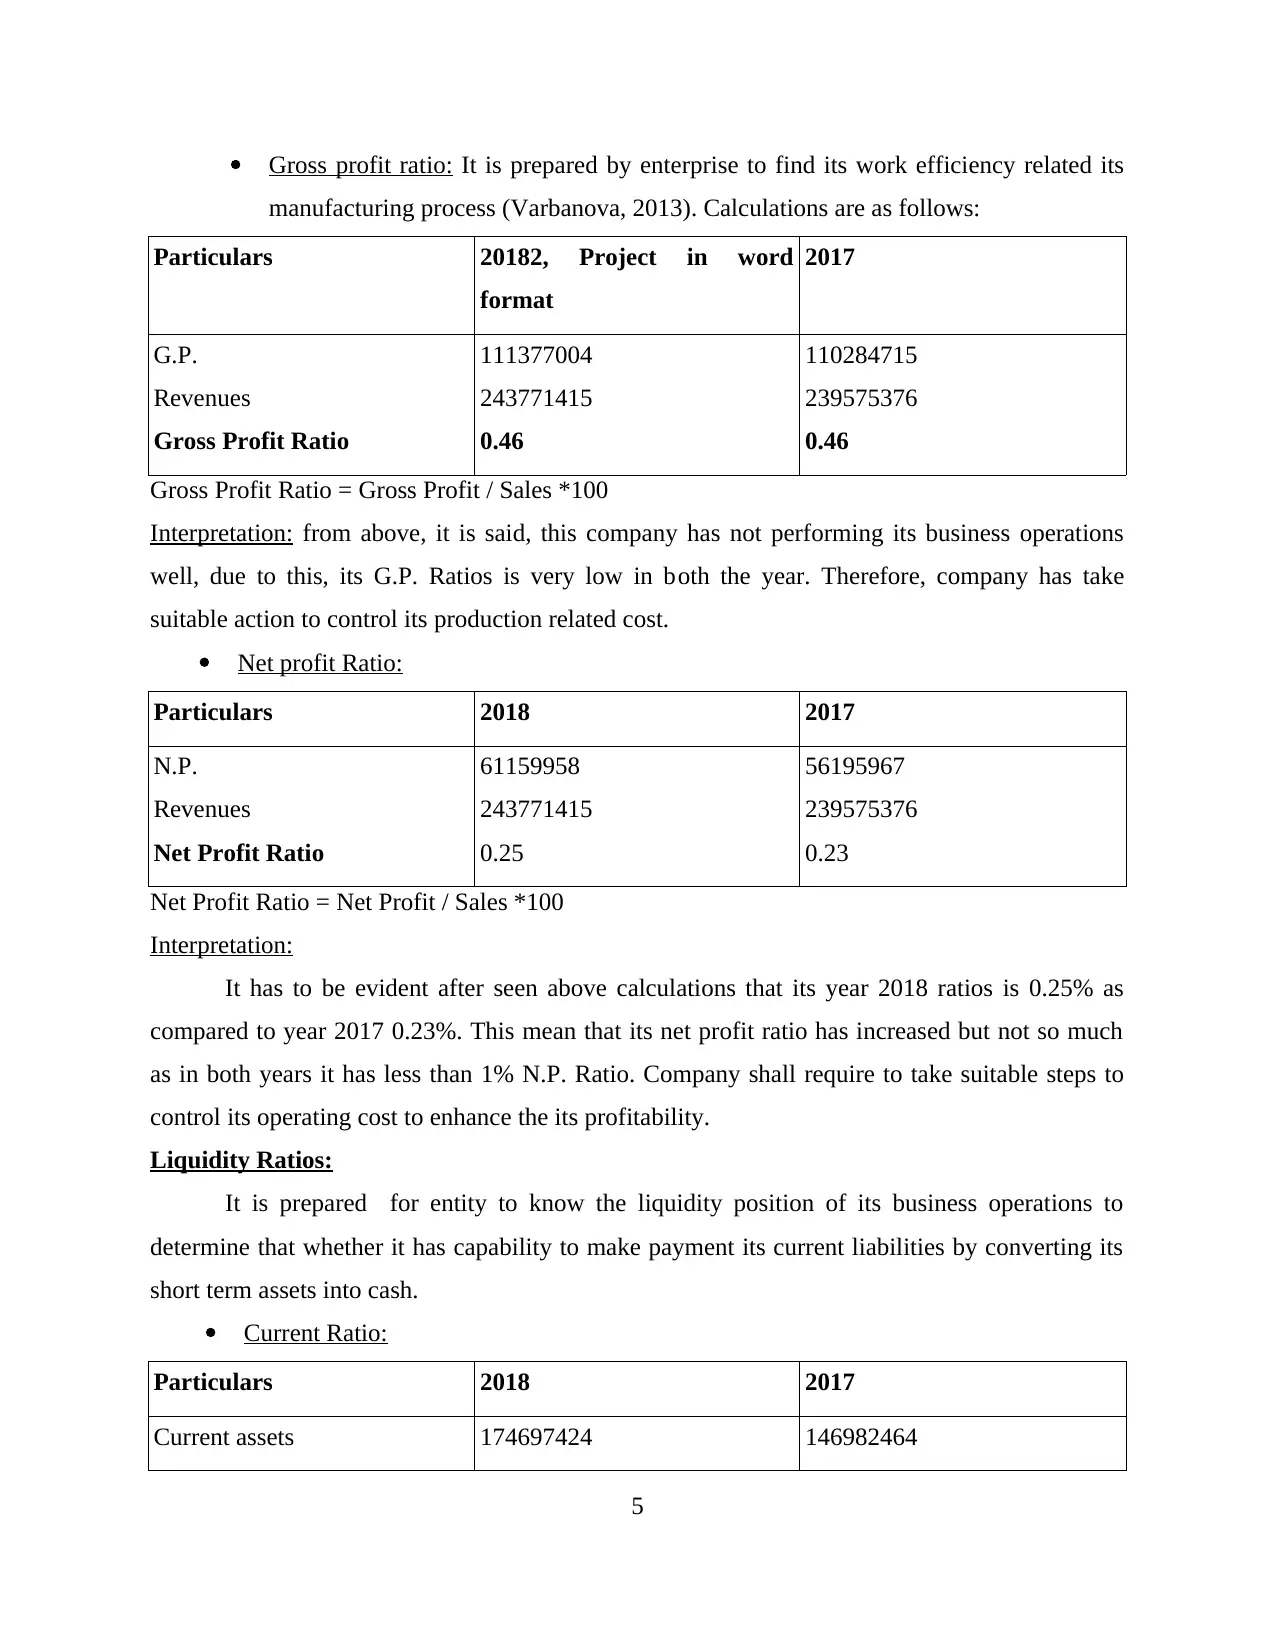
Gross profit ratio: It is prepared by enterprise to find its work efficiency related its
manufacturing process (Varbanova, 2013). Calculations are as follows:
Particulars 20182, Project in word
format
2017
G.P.
Revenues
Gross Profit Ratio
111377004
243771415
0.46
110284715
239575376
0.46
Gross Profit Ratio = Gross Profit / Sales *100
Interpretation: from above, it is said, this company has not performing its business operations
well, due to this, its G.P. Ratios is very low in both the year. Therefore, company has take
suitable action to control its production related cost.
Net profit Ratio:
Particulars 2018 2017
N.P.
Revenues
Net Profit Ratio
61159958
243771415
0.25
56195967
239575376
0.23
Net Profit Ratio = Net Profit / Sales *100
Interpretation:
It has to be evident after seen above calculations that its year 2018 ratios is 0.25% as
compared to year 2017 0.23%. This mean that its net profit ratio has increased but not so much
as in both years it has less than 1% N.P. Ratio. Company shall require to take suitable steps to
control its operating cost to enhance the its profitability.
Liquidity Ratios:
It is prepared for entity to know the liquidity position of its business operations to
determine that whether it has capability to make payment its current liabilities by converting its
short term assets into cash.
Current Ratio:
Particulars 2018 2017
Current assets 174697424 146982464
5
Paraphrase This Document
Need a fresh take? Get an instant paraphrase of this document with our AI Paraphraser
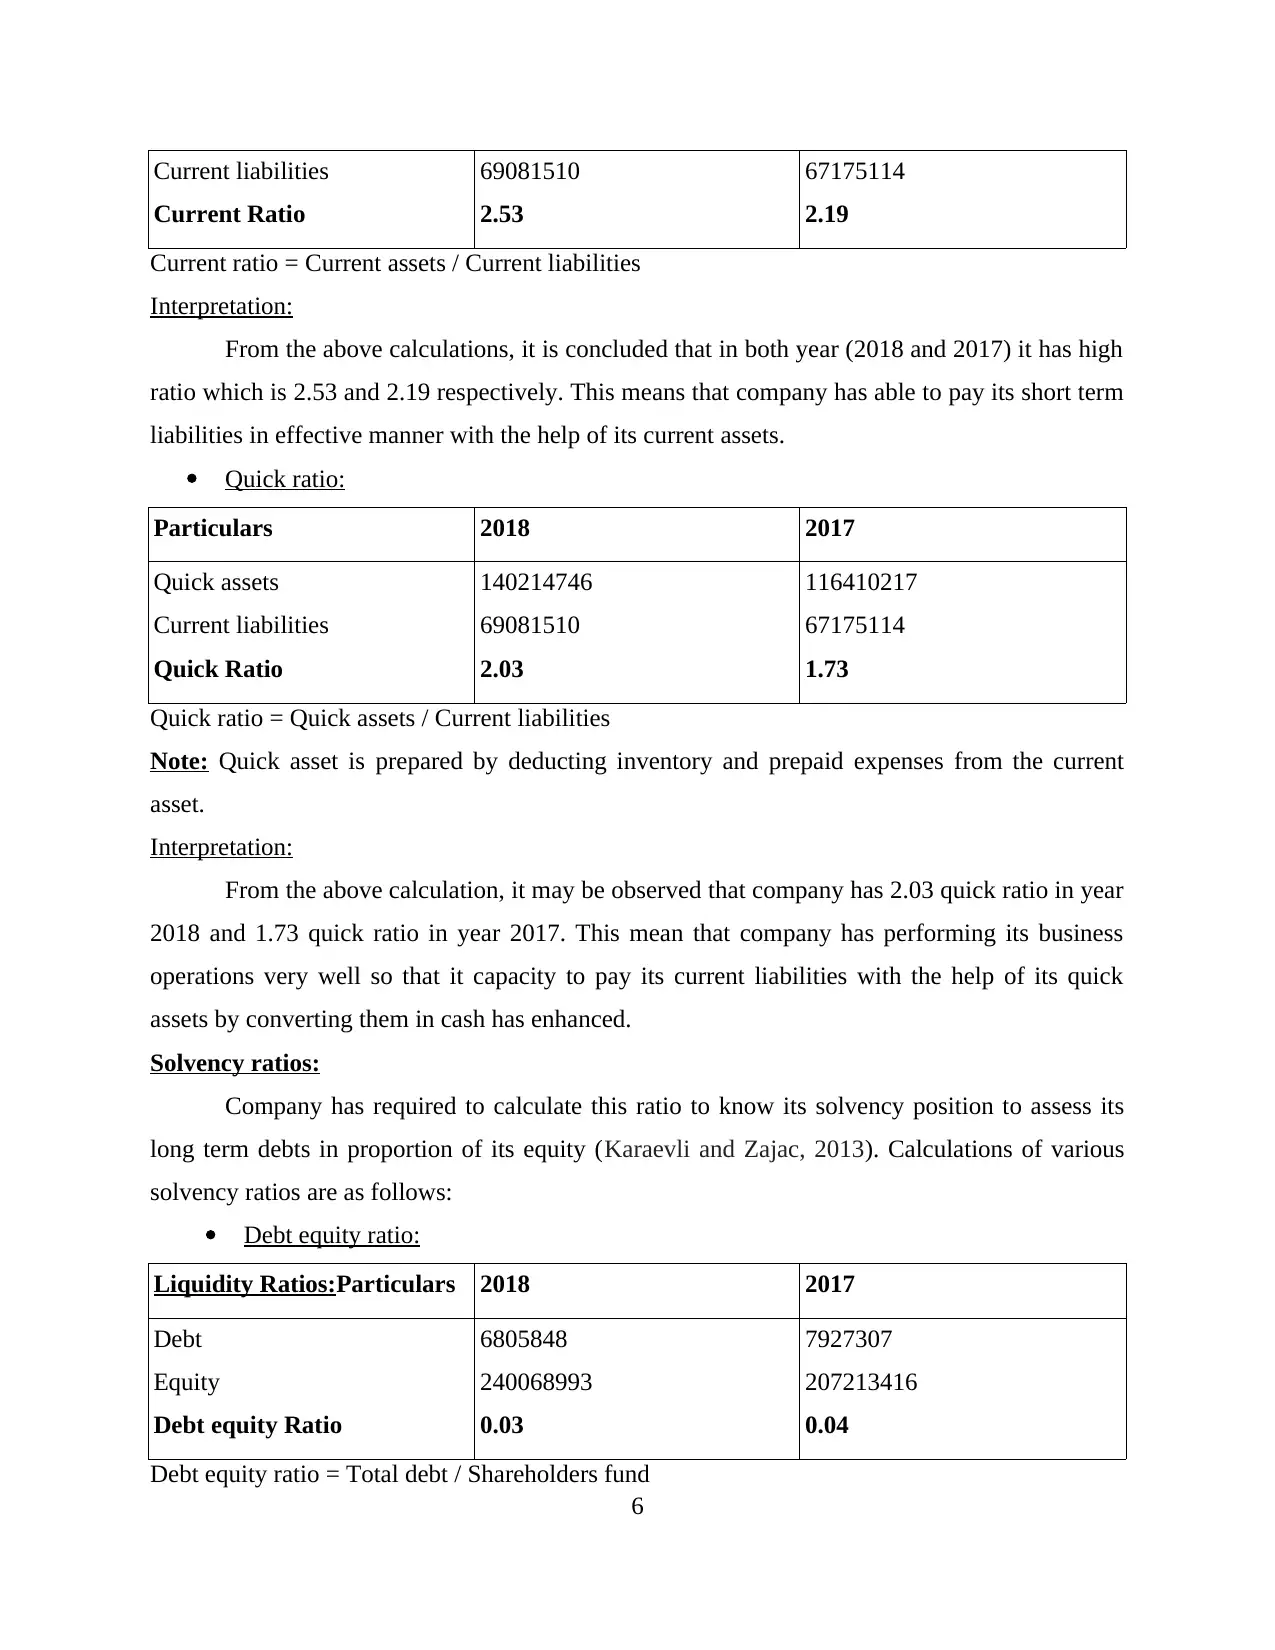
Current liabilities
Current Ratio
69081510
2.53
67175114
2.19
Current ratio = Current assets / Current liabilities
Interpretation:
From the above calculations, it is concluded that in both year (2018 and 2017) it has high
ratio which is 2.53 and 2.19 respectively. This means that company has able to pay its short term
liabilities in effective manner with the help of its current assets.
Quick ratio:
Particulars 2018 2017
Quick assets
Current liabilities
Quick Ratio
140214746
69081510
2.03
116410217
67175114
1.73
Quick ratio = Quick assets / Current liabilities
Note: Quick asset is prepared by deducting inventory and prepaid expenses from the current
asset.
Interpretation:
From the above calculation, it may be observed that company has 2.03 quick ratio in year
2018 and 1.73 quick ratio in year 2017. This mean that company has performing its business
operations very well so that it capacity to pay its current liabilities with the help of its quick
assets by converting them in cash has enhanced.
Solvency ratios:
Company has required to calculate this ratio to know its solvency position to assess its
long term debts in proportion of its equity (Karaevli and Zajac, 2013). Calculations of various
solvency ratios are as follows:
Debt equity ratio:
Liquidity Ratios:Particulars 2018 2017
Debt
Equity
Debt equity Ratio
6805848
240068993
0.03
7927307
207213416
0.04
Debt equity ratio = Total debt / Shareholders fund
6
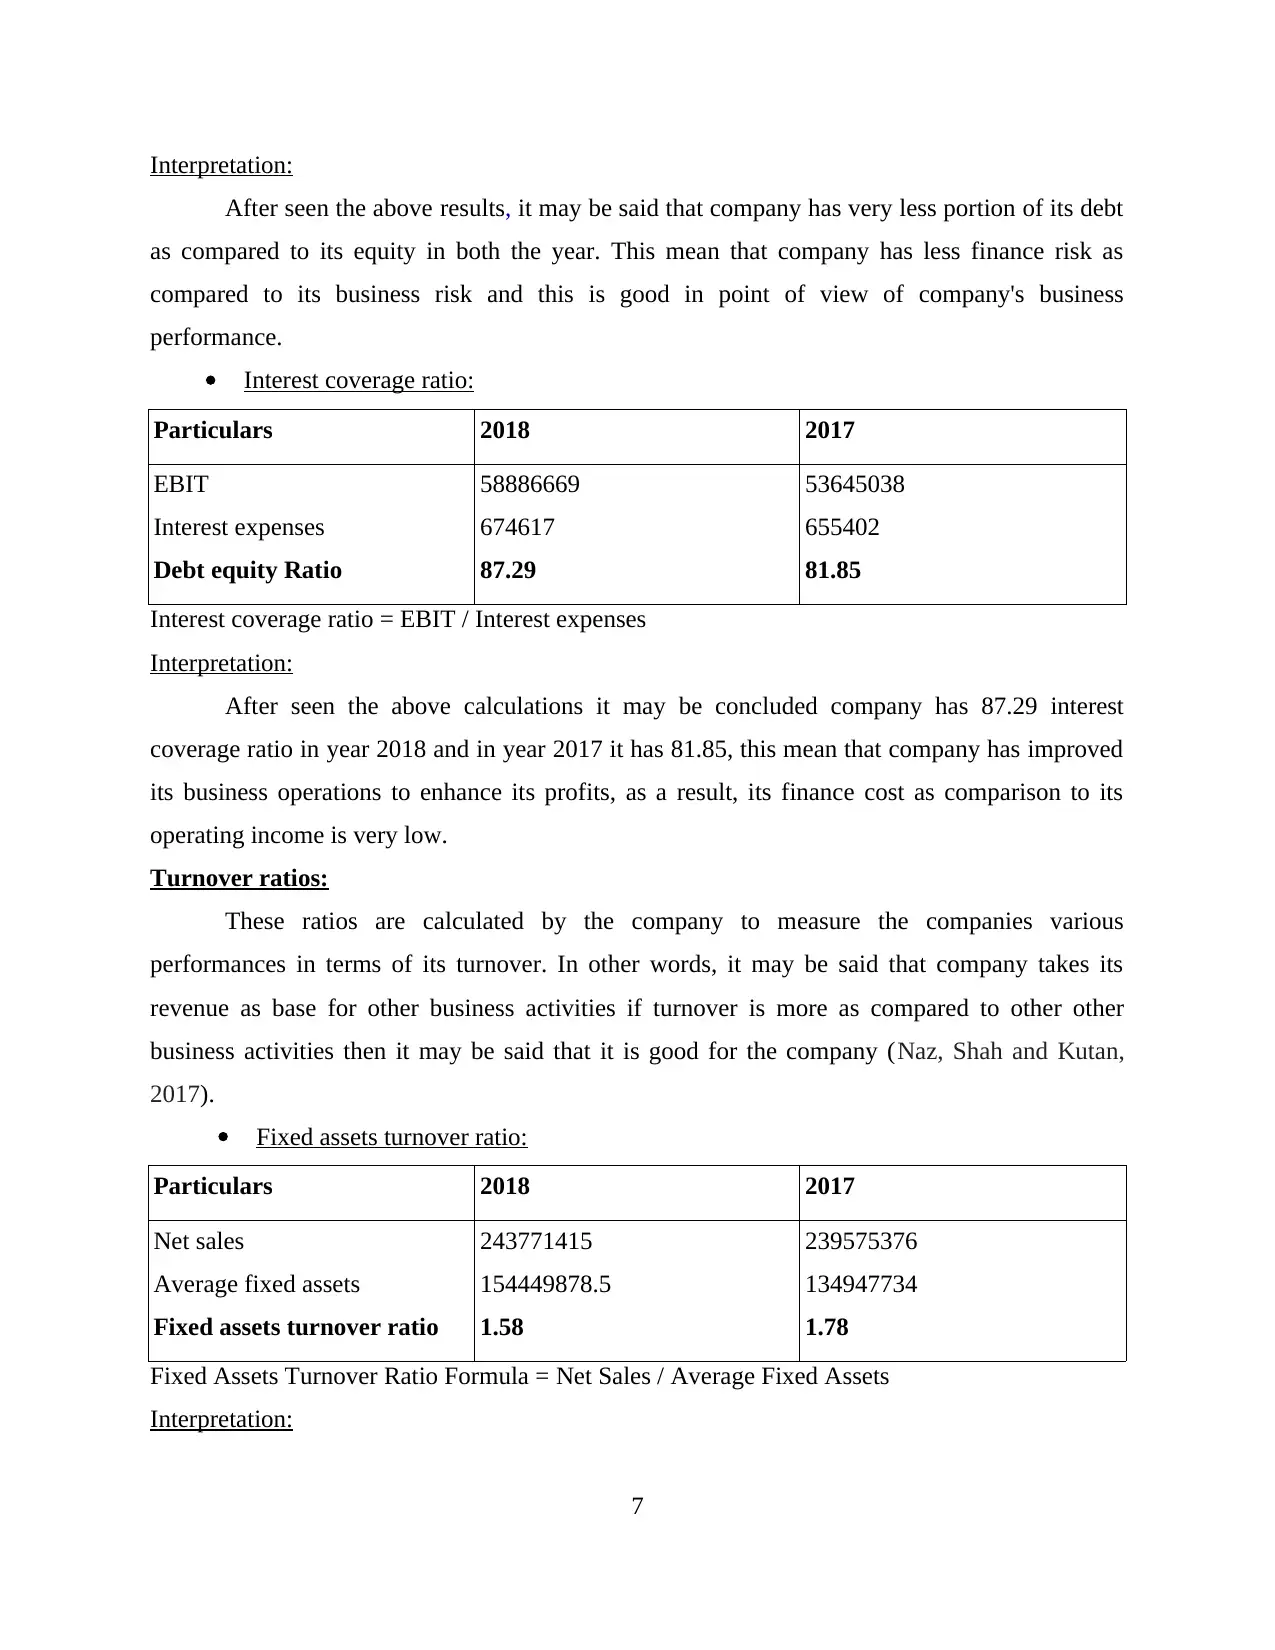
Interpretation:
After seen the above results, it may be said that company has very less portion of its debt
as compared to its equity in both the year. This mean that company has less finance risk as
compared to its business risk and this is good in point of view of company's business
performance.
Interest coverage ratio:
Particulars 2018 2017
EBIT
Interest expenses
Debt equity Ratio
58886669
674617
87.29
53645038
655402
81.85
Interest coverage ratio = EBIT / Interest expenses
Interpretation:
After seen the above calculations it may be concluded company has 87.29 interest
coverage ratio in year 2018 and in year 2017 it has 81.85, this mean that company has improved
its business operations to enhance its profits, as a result, its finance cost as comparison to its
operating income is very low.
Turnover ratios:
These ratios are calculated by the company to measure the companies various
performances in terms of its turnover. In other words, it may be said that company takes its
revenue as base for other business activities if turnover is more as compared to other other
business activities then it may be said that it is good for the company (Naz, Shah and Kutan,
2017).
Fixed assets turnover ratio:
Particulars 2018 2017
Net sales
Average fixed assets
Fixed assets turnover ratio
243771415
154449878.5
1.58
239575376
134947734
1.78
Fixed Assets Turnover Ratio Formula = Net Sales / Average Fixed Assets
Interpretation:
7
⊘ This is a preview!⊘
Do you want full access?
Subscribe today to unlock all pages.
Trusted by 1+ million students worldwide
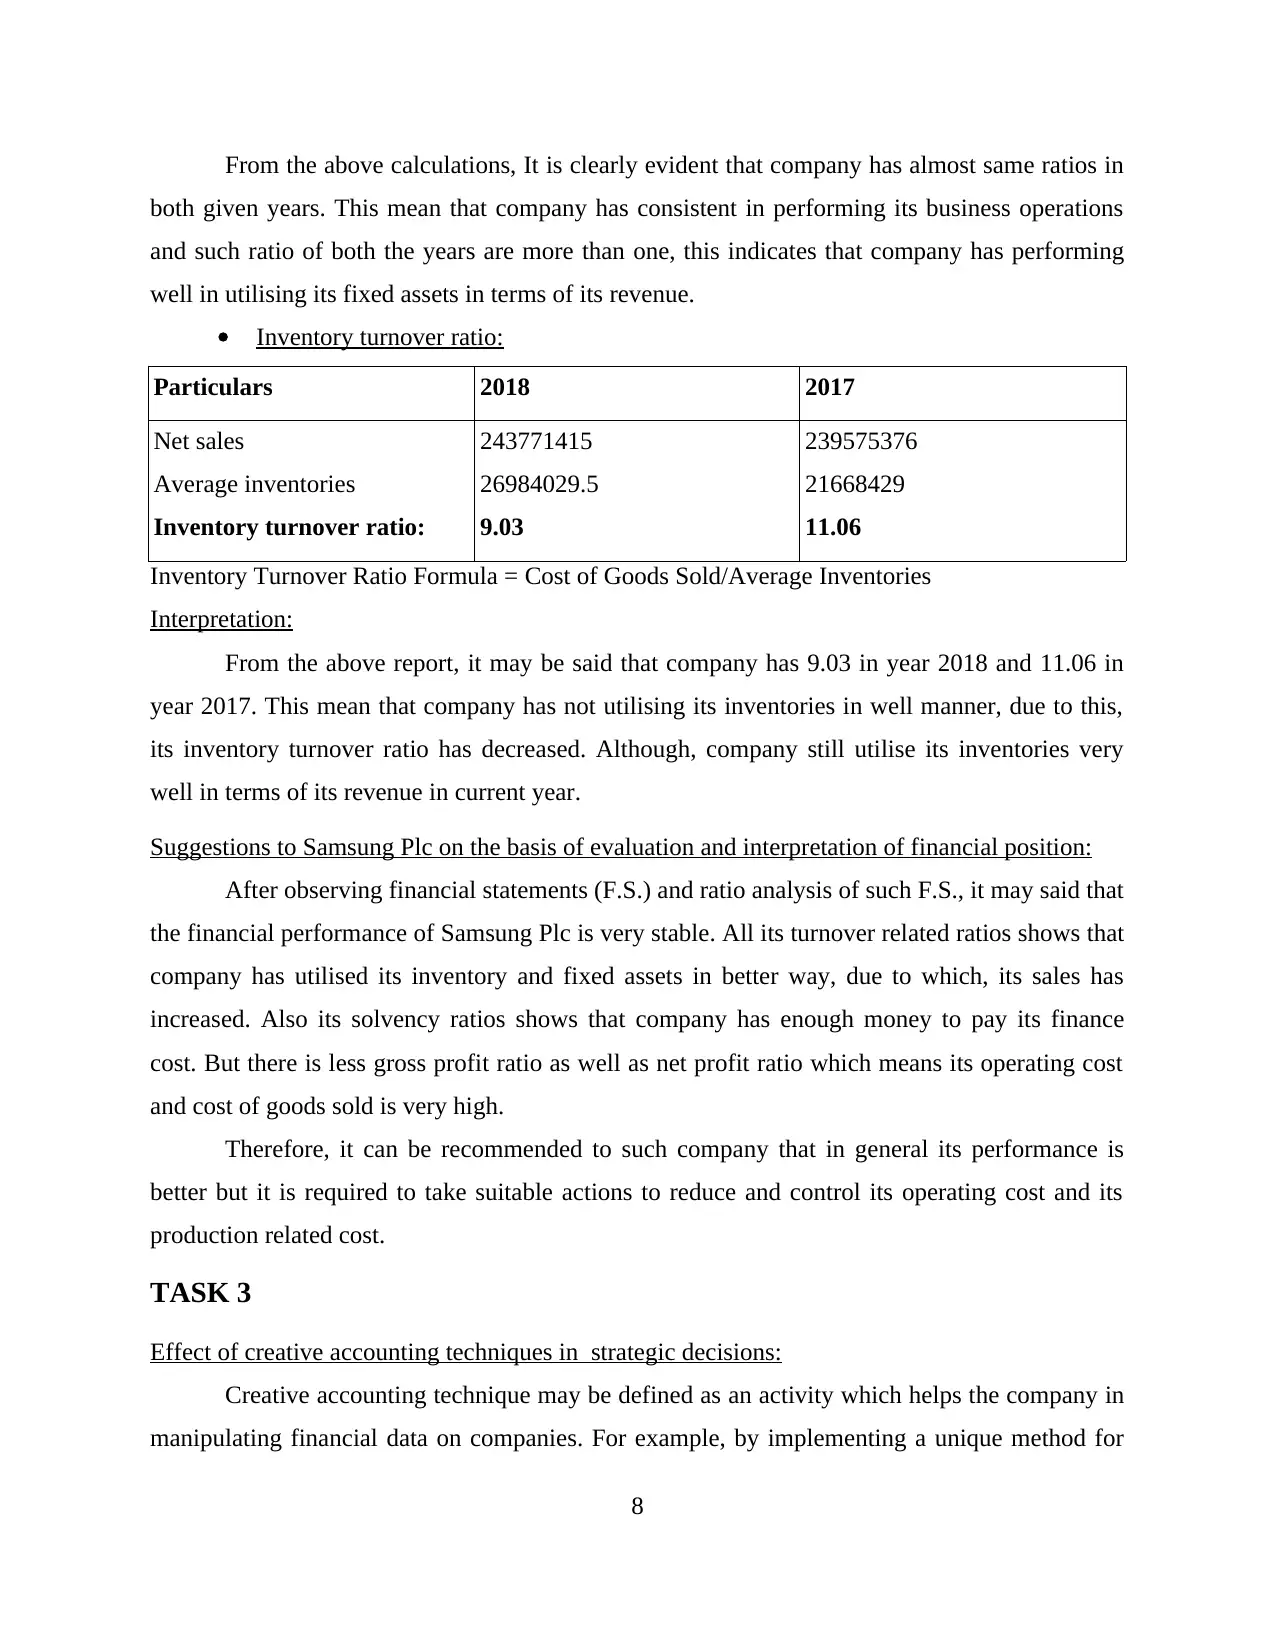
From the above calculations, It is clearly evident that company has almost same ratios in
both given years. This mean that company has consistent in performing its business operations
and such ratio of both the years are more than one, this indicates that company has performing
well in utilising its fixed assets in terms of its revenue.
Inventory turnover ratio:
Particulars 2018 2017
Net sales
Average inventories
Inventory turnover ratio:
243771415
26984029.5
9.03
239575376
21668429
11.06
Inventory Turnover Ratio Formula = Cost of Goods Sold/Average Inventories
Interpretation:
From the above report, it may be said that company has 9.03 in year 2018 and 11.06 in
year 2017. This mean that company has not utilising its inventories in well manner, due to this,
its inventory turnover ratio has decreased. Although, company still utilise its inventories very
well in terms of its revenue in current year.
Suggestions to Samsung Plc on the basis of evaluation and interpretation of financial position:
After observing financial statements (F.S.) and ratio analysis of such F.S., it may said that
the financial performance of Samsung Plc is very stable. All its turnover related ratios shows that
company has utilised its inventory and fixed assets in better way, due to which, its sales has
increased. Also its solvency ratios shows that company has enough money to pay its finance
cost. But there is less gross profit ratio as well as net profit ratio which means its operating cost
and cost of goods sold is very high.
Therefore, it can be recommended to such company that in general its performance is
better but it is required to take suitable actions to reduce and control its operating cost and its
production related cost.
TASK 3
Effect of creative accounting techniques in strategic decisions:
Creative accounting technique may be defined as an activity which helps the company in
manipulating financial data on companies. For example, by implementing a unique method for
8
Paraphrase This Document
Need a fresh take? Get an instant paraphrase of this document with our AI Paraphraser
accounting of company's financial transactions such as accounting treatment of inventory
valuation, this may help the executives directors in taking strategic decisions related to its
inventory valuation (Cheng, Humphreys and Zhang, 2018).
Limitations of ratio analysis as tool strategic decision:
In practical scenario, companies often faced by some weaknesses regarding ratio
analysis, some of these are as follows:
False results based on incorrect accounting data: The relianc interpretation e on the ratios
may be correct if it is based on the correct financial statements, this means that if
financial statements of an company is prepared in wrong manner that does not provide
true and fair results such as window dressing. interpretation
No idea of Probable Happenings in future: Ratios are based on historical data which
means that it is not suitable for future business operations because future business
operations are uncertain as in present condition complexities in business environment is
increased. Therefore, it may lead to wrong interpretation based on such historical
financial statements.
Variation of accounting Methods: By the help of ratio analysis, two companies financial
performances are measured. But this method is not good as it may be happen that these
companies are implemented different accounting methods for recording its financial
transactions.
Price level changes: Due to changes in the price level among various years leads to
wrong interpretation of ratio analysis. For example, turnov interpretation er ratios of year
2001 and the same ratios year 2012 shall not be compared accurately.
Value of cash flow management in assessing proposals for investment proposals:
In measuring a capital investment proposal, company sha interpretation ll require to
manage its cash flows to finance its proposed investment proposal. The various importance of
cash flow management are as follows: interpretation
A company by managing its cash flows in effective manner may utilise this in investing
its capital expenditure, as a result, company has not need to raises funds from outside
sources such as taking loans etc. interpretation
9
It is further help the company in saving company's commission cost and finance cost by
having internal source for finance the proposed investment proposal.
Cash flow management assists the company in evaluating its net cash flows and net cash
outflows (including initial investment) which it has occu interpretation rred during the
life time of a capital investment project. This may help the company in asses the viability
of its investment proposal (Hladchenko, 2015).
TASK 4
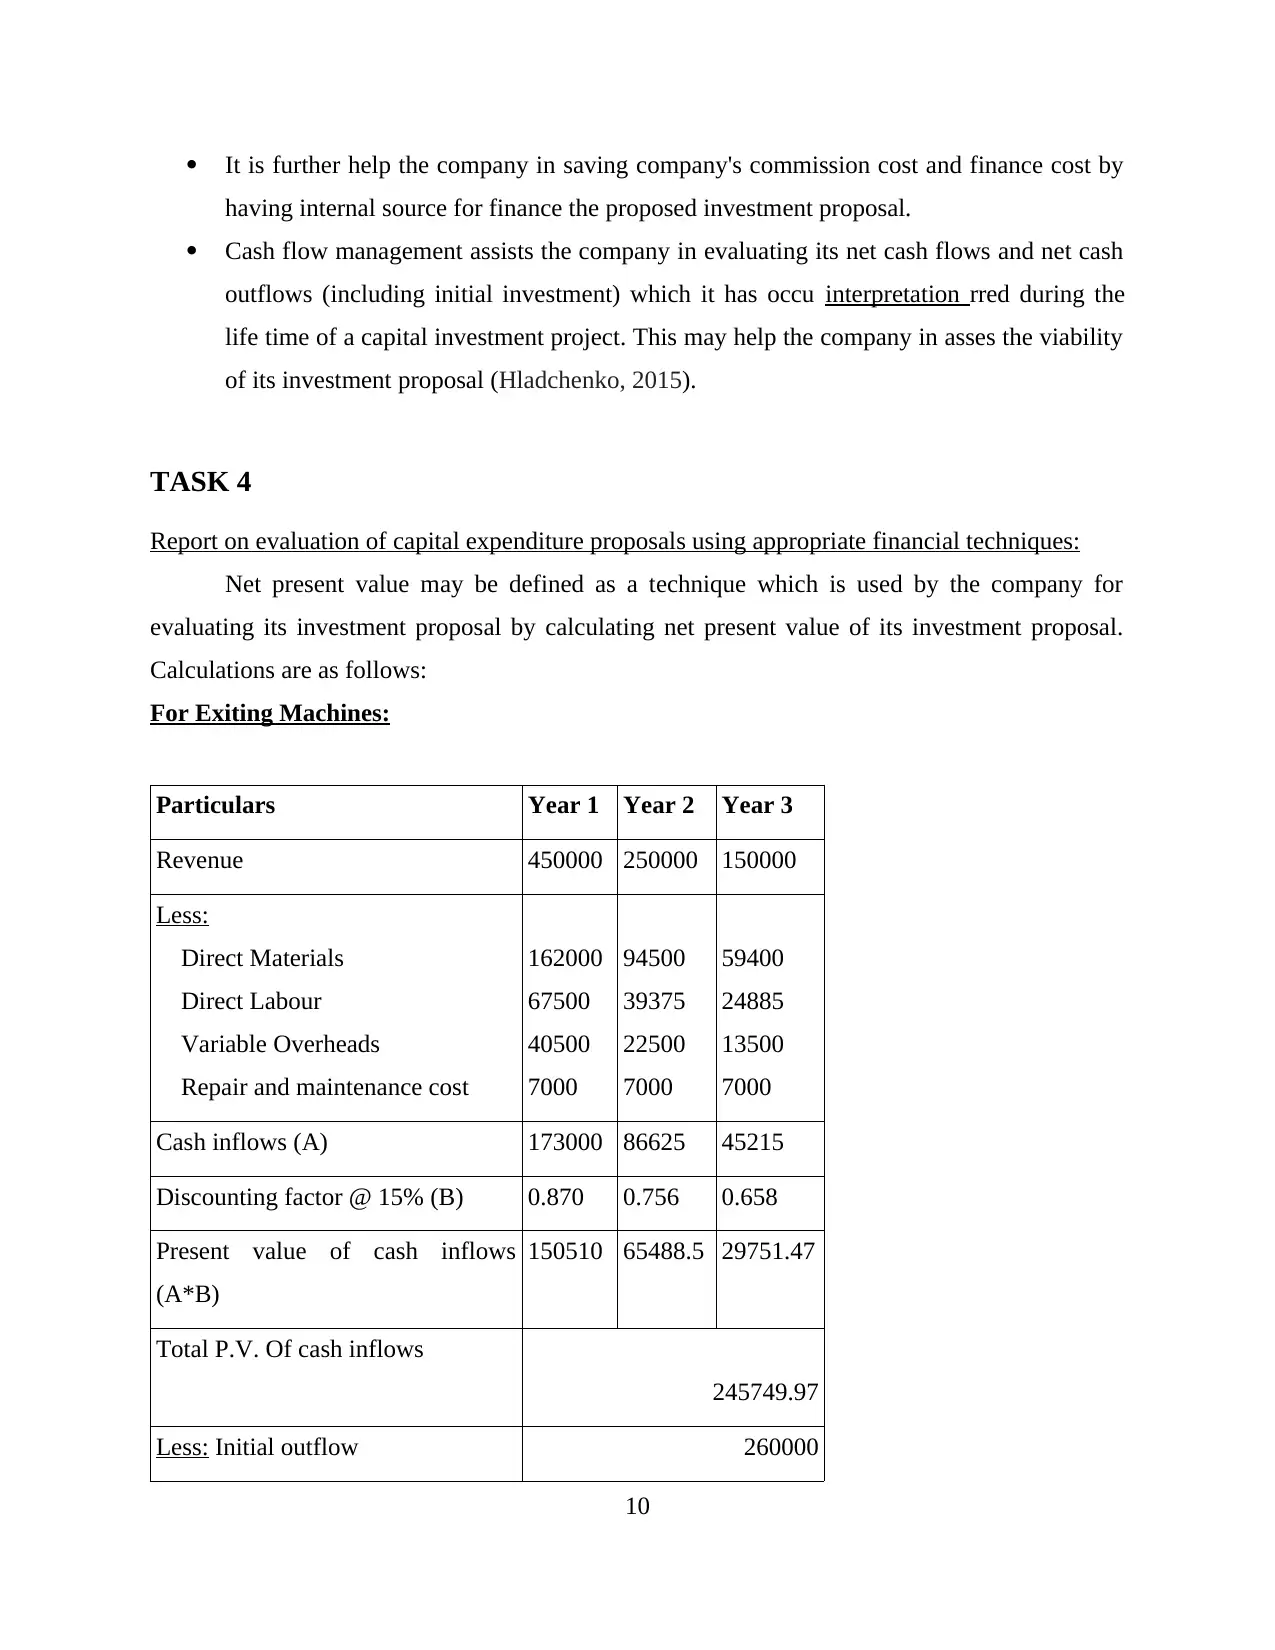
Report on evaluation of capital expenditure proposals using appropriate financial techniques:
Net present value may be defined as a technique which is used by the company for
evaluating its investment proposal by calculating net present value of its investment proposal.
Calculations are as follows:
For Exiting Machines:
Particulars Year 1 Year 2 Year 3
Revenue 450000 250000 150000
Less:
Direct Materials
Direct Labour
Variable Overheads
Repair and maintenance cost
162000
67500
40500
7000
94500
39375
22500
7000
59400
24885
13500
7000
Cash inflows (A) 173000 86625 45215
Discounting factor @ 15% (B) 0.870 0.756 0.658
Present value of cash inflows
(A*B)
150510 65488.5 29751.47
Total P.V. Of cash inflows
245749.97
Less: Initial outflow 260000
10
having internal source for finance the proposed investment proposal.
Cash flow management assists the company in evaluating its net cash flows and net cash
outflows (including initial investment) which it has occu interpretation rred during the
life time of a capital investment project. This may help the company in asses the viability
of its investment proposal (Hladchenko, 2015).
TASK 4
Report on evaluation of capital expenditure proposals using appropriate financial techniques:
Net present value may be defined as a technique which is used by the company for
evaluating its investment proposal by calculating net present value of its investment proposal.
Calculations are as follows:
For Exiting Machines:
Particulars Year 1 Year 2 Year 3
Revenue 450000 250000 150000
Less:
Direct Materials
Direct Labour
Variable Overheads
Repair and maintenance cost
162000
67500
40500
7000
94500
39375
22500
7000
59400
24885
13500
7000
Cash inflows (A) 173000 86625 45215
Discounting factor @ 15% (B) 0.870 0.756 0.658
Present value of cash inflows
(A*B)
150510 65488.5 29751.47
Total P.V. Of cash inflows
245749.97
Less: Initial outflow 260000
10
⊘ This is a preview!⊘
Do you want full access?
Subscribe today to unlock all pages.
Trusted by 1+ million students worldwide
1 out of 16
Related Documents


Your All-in-One AI-Powered Toolkit for Academic Success.
+13062052269
info@desklib.com
Available 24*7 on WhatsApp / Email
![[object Object]](/_next/static/media/star-bottom.7253800d.svg)
Unlock your academic potential
Copyright © 2020–2026 A2Z Services. All Rights Reserved. Developed and managed by ZUCOL.