PGBM01 Financial Management and Control Assignment Solution
VerifiedAdded on 2023/01/19
|19
|4719
|62
Homework Assignment
AI Summary
This document presents a comprehensive solution to a Financial Management and Control assignment, addressing various aspects of financial analysis. Part A of the solution focuses on ratio analysis, including profitability, liquidity, gearing, asset utilization, and investor potential ratios, comparing data from 2016 and 2017 for Bitmap plc. It also includes a calculation and analysis of working capital and the working capital cycle. Part B delves into investment appraisal techniques, evaluating two machines (A and B) using payback period, discounted payback period, accounting rate of return, net present value (NPV), and internal rate of return (IRR) methods. The solution provides detailed calculations and recommendations based on each method, along with a discussion of the advantages and disadvantages of the payback period method. The assignment demonstrates a strong understanding of financial statement analysis and investment decision-making.

FINANCIAL MANAGEMENT AND CONTROL
Paraphrase This Document
Need a fresh take? Get an instant paraphrase of this document with our AI Paraphraser

PART A
Answer 1.
PROFITABILITY RATIOS
Particulars 2017 2016
Gross profit 12200 9100
Revenue 23000 18000
Gross profit margin 53% 51%
Particulars 2017 2016
Net profit 4060 3220
Revenue 23000 18000
Net profit margin 18% 18%
Profitability ratio is a measure of financial metrics which is used to ascertain the ability of a
business to generate earnings which is relative to its operating cost, revenue, balance sheet
assets, which is used from its data from a specific point in time. So, the indication when the
company is doing well is depicted by the profitability ratio which has a higher value relative to
its competitor’s ratio or relative to the same ratio from a previous period. The marginal profit of
the company is measured by the it’s profit. It is usually measured in percentage. As we can see
that the gross profit of the company has increased when it is compared from the year 2017 to
2016. Although, the gross profit is increased, the net profit is decreased due to increase in
interest payable from 500 in 2016 to 1000 in 2017as the income tax is 30% constant. The
shareholders of the company always expect the company to earn higher profits such that the
wealth of the company is maximized. The net profit is affected by the higher interest rate.
LIQUIDITY RATIOS
Particulars 2017 2016
Current assets 5160 4150
Current liabilities 1100 1500
Current ratio
4.
69
2.
77
Particulars 2017 2016
Current asset 5160 4150
Inventories 2360 1800
Current Liabilities 1100 1500
Quick Ratio
2.
55
1.
57
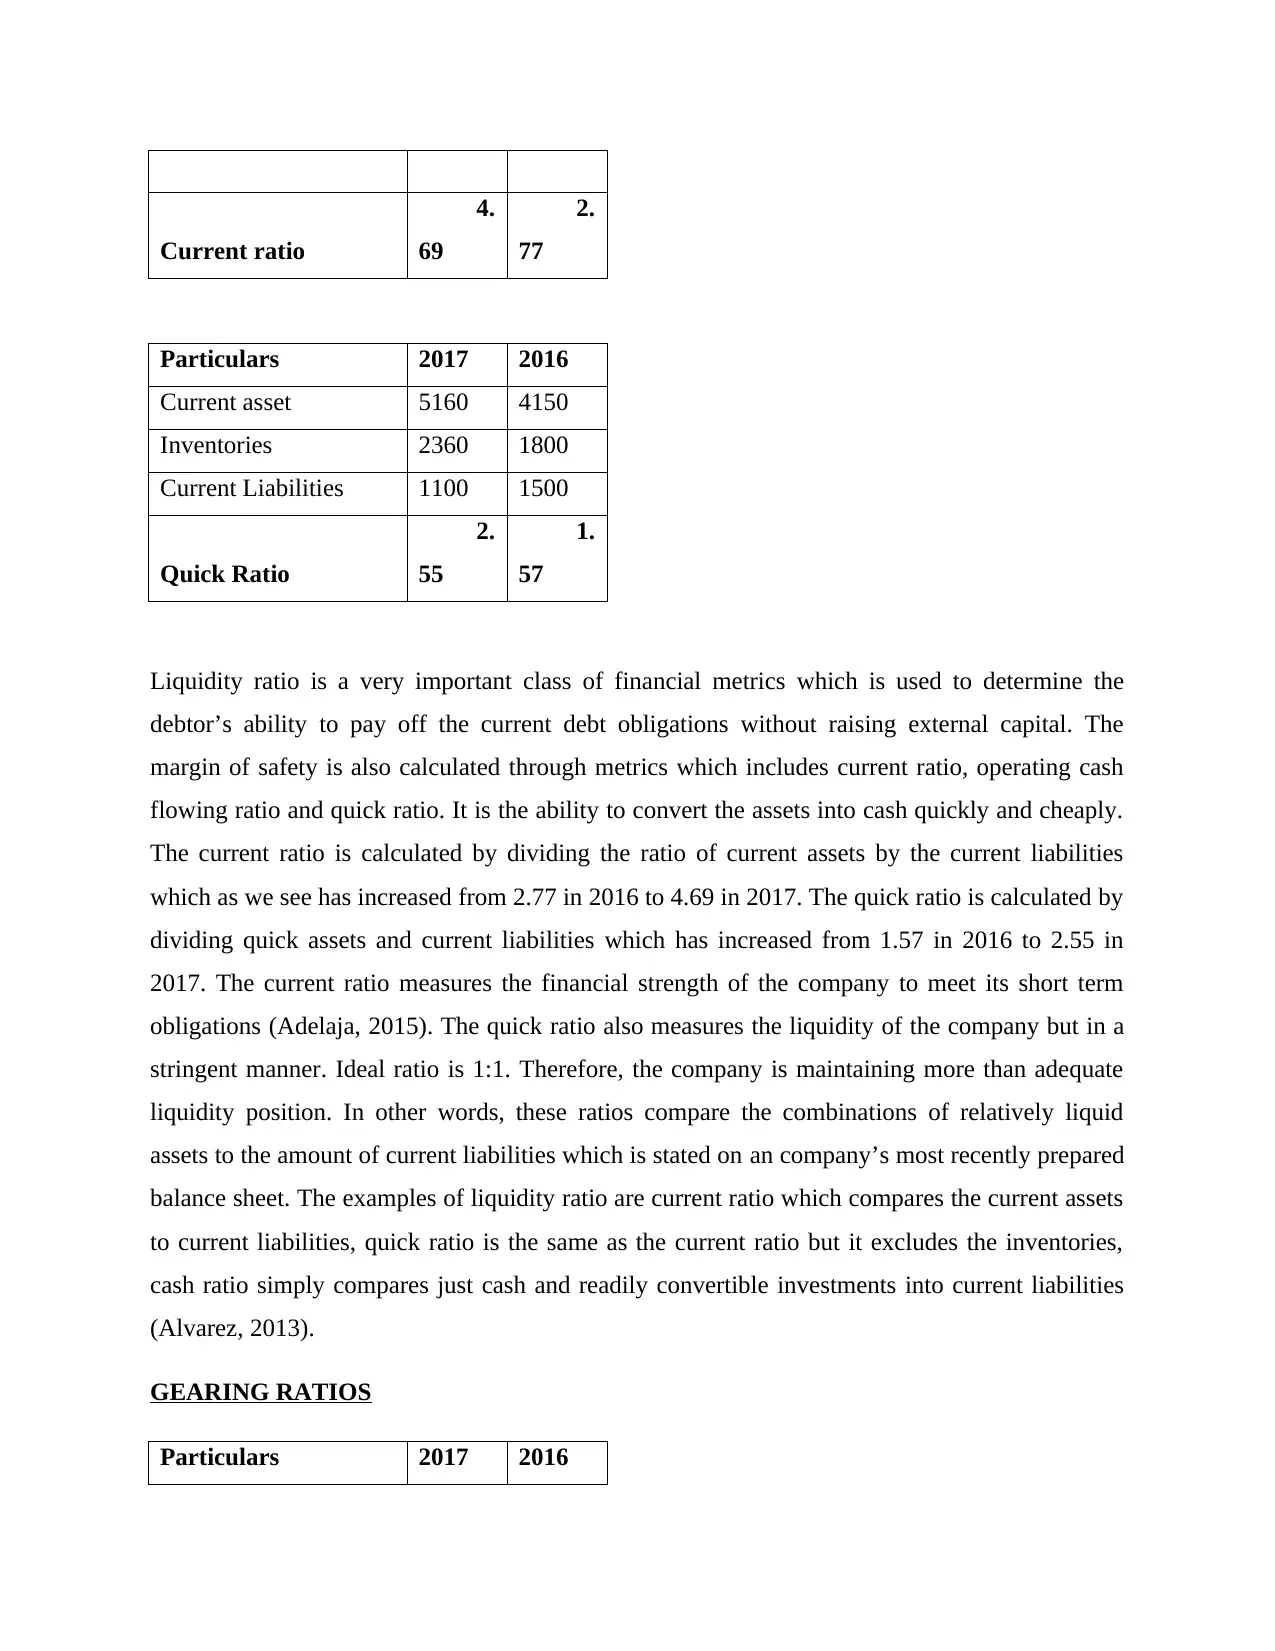
Liquidity ratio is a very important class of financial metrics which is used to determine the
debtor’s ability to pay off the current debt obligations without raising external capital. The
margin of safety is also calculated through metrics which includes current ratio, operating cash
flowing ratio and quick ratio. It is the ability to convert the assets into cash quickly and cheaply.
The current ratio is calculated by dividing the ratio of current assets by the current liabilities
which as we see has increased from 2.77 in 2016 to 4.69 in 2017. The quick ratio is calculated by
dividing quick assets and current liabilities which has increased from 1.57 in 2016 to 2.55 in
2017. The current ratio measures the financial strength of the company to meet its short term
obligations (Adelaja, 2015). The quick ratio also measures the liquidity of the company but in a
stringent manner. Ideal ratio is 1:1. Therefore, the company is maintaining more than adequate
liquidity position. In other words, these ratios compare the combinations of relatively liquid
assets to the amount of current liabilities which is stated on an company’s most recently prepared
balance sheet. The examples of liquidity ratio are current ratio which compares the current assets
to current liabilities, quick ratio is the same as the current ratio but it excludes the inventories,
cash ratio simply compares just cash and readily convertible investments into current liabilities
(Alvarez, 2013).
GEARING RATIOS
Particulars 2017 2016
4.
69
2.
77
Particulars 2017 2016
Current asset 5160 4150
Inventories 2360 1800
Current Liabilities 1100 1500
Quick Ratio
2.
55
1.
57
Liquidity ratio is a very important class of financial metrics which is used to determine the
debtor’s ability to pay off the current debt obligations without raising external capital. The
margin of safety is also calculated through metrics which includes current ratio, operating cash
flowing ratio and quick ratio. It is the ability to convert the assets into cash quickly and cheaply.
The current ratio is calculated by dividing the ratio of current assets by the current liabilities
which as we see has increased from 2.77 in 2016 to 4.69 in 2017. The quick ratio is calculated by
dividing quick assets and current liabilities which has increased from 1.57 in 2016 to 2.55 in
2017. The current ratio measures the financial strength of the company to meet its short term
obligations (Adelaja, 2015). The quick ratio also measures the liquidity of the company but in a
stringent manner. Ideal ratio is 1:1. Therefore, the company is maintaining more than adequate
liquidity position. In other words, these ratios compare the combinations of relatively liquid
assets to the amount of current liabilities which is stated on an company’s most recently prepared
balance sheet. The examples of liquidity ratio are current ratio which compares the current assets
to current liabilities, quick ratio is the same as the current ratio but it excludes the inventories,
cash ratio simply compares just cash and readily convertible investments into current liabilities
(Alvarez, 2013).
GEARING RATIOS
Particulars 2017 2016
⊘ This is a preview!⊘
Do you want full access?
Subscribe today to unlock all pages.
Trusted by 1+ million students worldwide
Total Debt 3500 2000
Total Equity 15760 12000
Total Debt to Equity
ratio
0.
22
0.
17
Particulars 2017 2016
Total Debt 3500 2000
Total Asset 19260 14000
Debt ratio
0.
18
0.
14
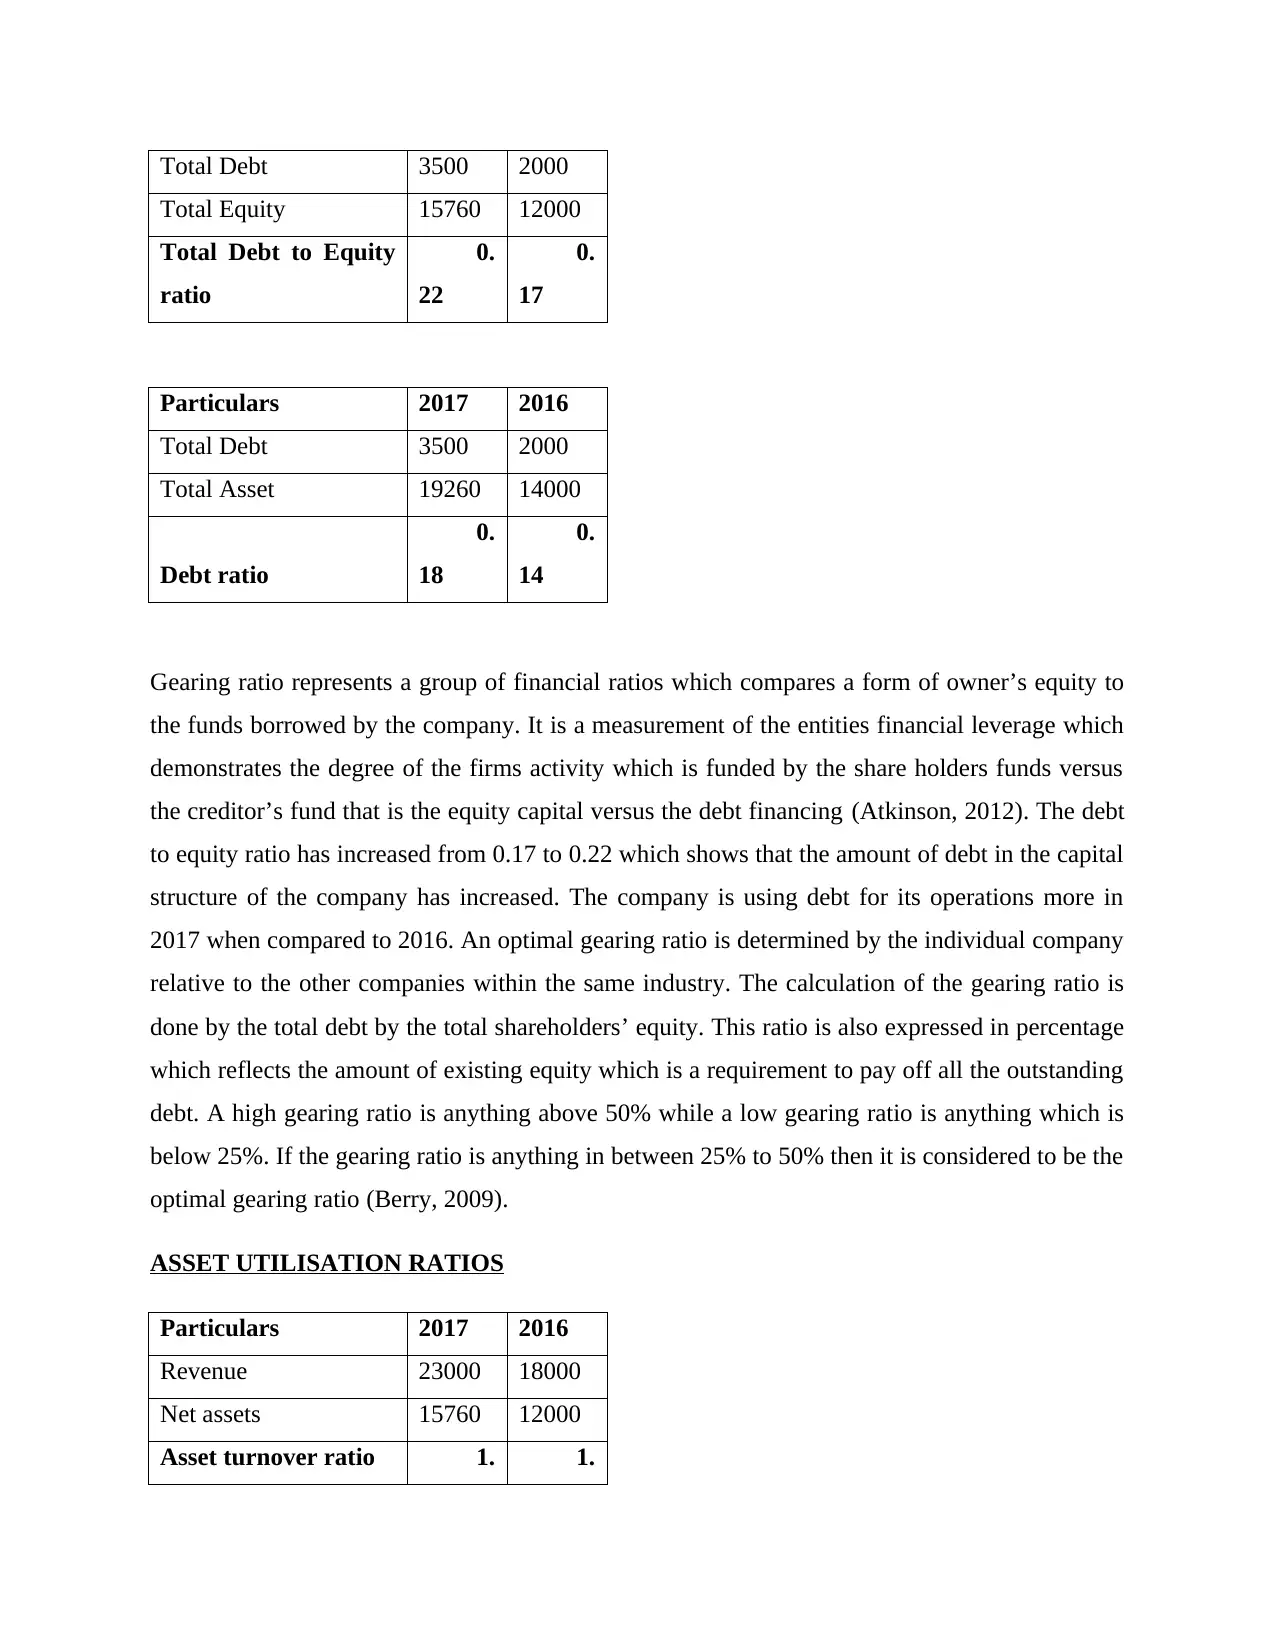
Gearing ratio represents a group of financial ratios which compares a form of owner’s equity to
the funds borrowed by the company. It is a measurement of the entities financial leverage which
demonstrates the degree of the firms activity which is funded by the share holders funds versus
the creditor’s fund that is the equity capital versus the debt financing (Atkinson, 2012). The debt
to equity ratio has increased from 0.17 to 0.22 which shows that the amount of debt in the capital
structure of the company has increased. The company is using debt for its operations more in
2017 when compared to 2016. An optimal gearing ratio is determined by the individual company
relative to the other companies within the same industry. The calculation of the gearing ratio is
done by the total debt by the total shareholders’ equity. This ratio is also expressed in percentage
which reflects the amount of existing equity which is a requirement to pay off all the outstanding
debt. A high gearing ratio is anything above 50% while a low gearing ratio is anything which is
below 25%. If the gearing ratio is anything in between 25% to 50% then it is considered to be the
optimal gearing ratio (Berry, 2009).
ASSET UTILISATION RATIOS
Particulars 2017 2016
Revenue 23000 18000
Net assets 15760 12000
Asset turnover ratio 1. 1.
Total Equity 15760 12000
Total Debt to Equity
ratio
0.
22
0.
17
Particulars 2017 2016
Total Debt 3500 2000
Total Asset 19260 14000
Debt ratio
0.
18
0.
14
Gearing ratio represents a group of financial ratios which compares a form of owner’s equity to
the funds borrowed by the company. It is a measurement of the entities financial leverage which
demonstrates the degree of the firms activity which is funded by the share holders funds versus
the creditor’s fund that is the equity capital versus the debt financing (Atkinson, 2012). The debt
to equity ratio has increased from 0.17 to 0.22 which shows that the amount of debt in the capital
structure of the company has increased. The company is using debt for its operations more in
2017 when compared to 2016. An optimal gearing ratio is determined by the individual company
relative to the other companies within the same industry. The calculation of the gearing ratio is
done by the total debt by the total shareholders’ equity. This ratio is also expressed in percentage
which reflects the amount of existing equity which is a requirement to pay off all the outstanding
debt. A high gearing ratio is anything above 50% while a low gearing ratio is anything which is
below 25%. If the gearing ratio is anything in between 25% to 50% then it is considered to be the
optimal gearing ratio (Berry, 2009).
ASSET UTILISATION RATIOS
Particulars 2017 2016
Revenue 23000 18000
Net assets 15760 12000
Asset turnover ratio 1. 1.
Paraphrase This Document
Need a fresh take? Get an instant paraphrase of this document with our AI Paraphraser
46 50
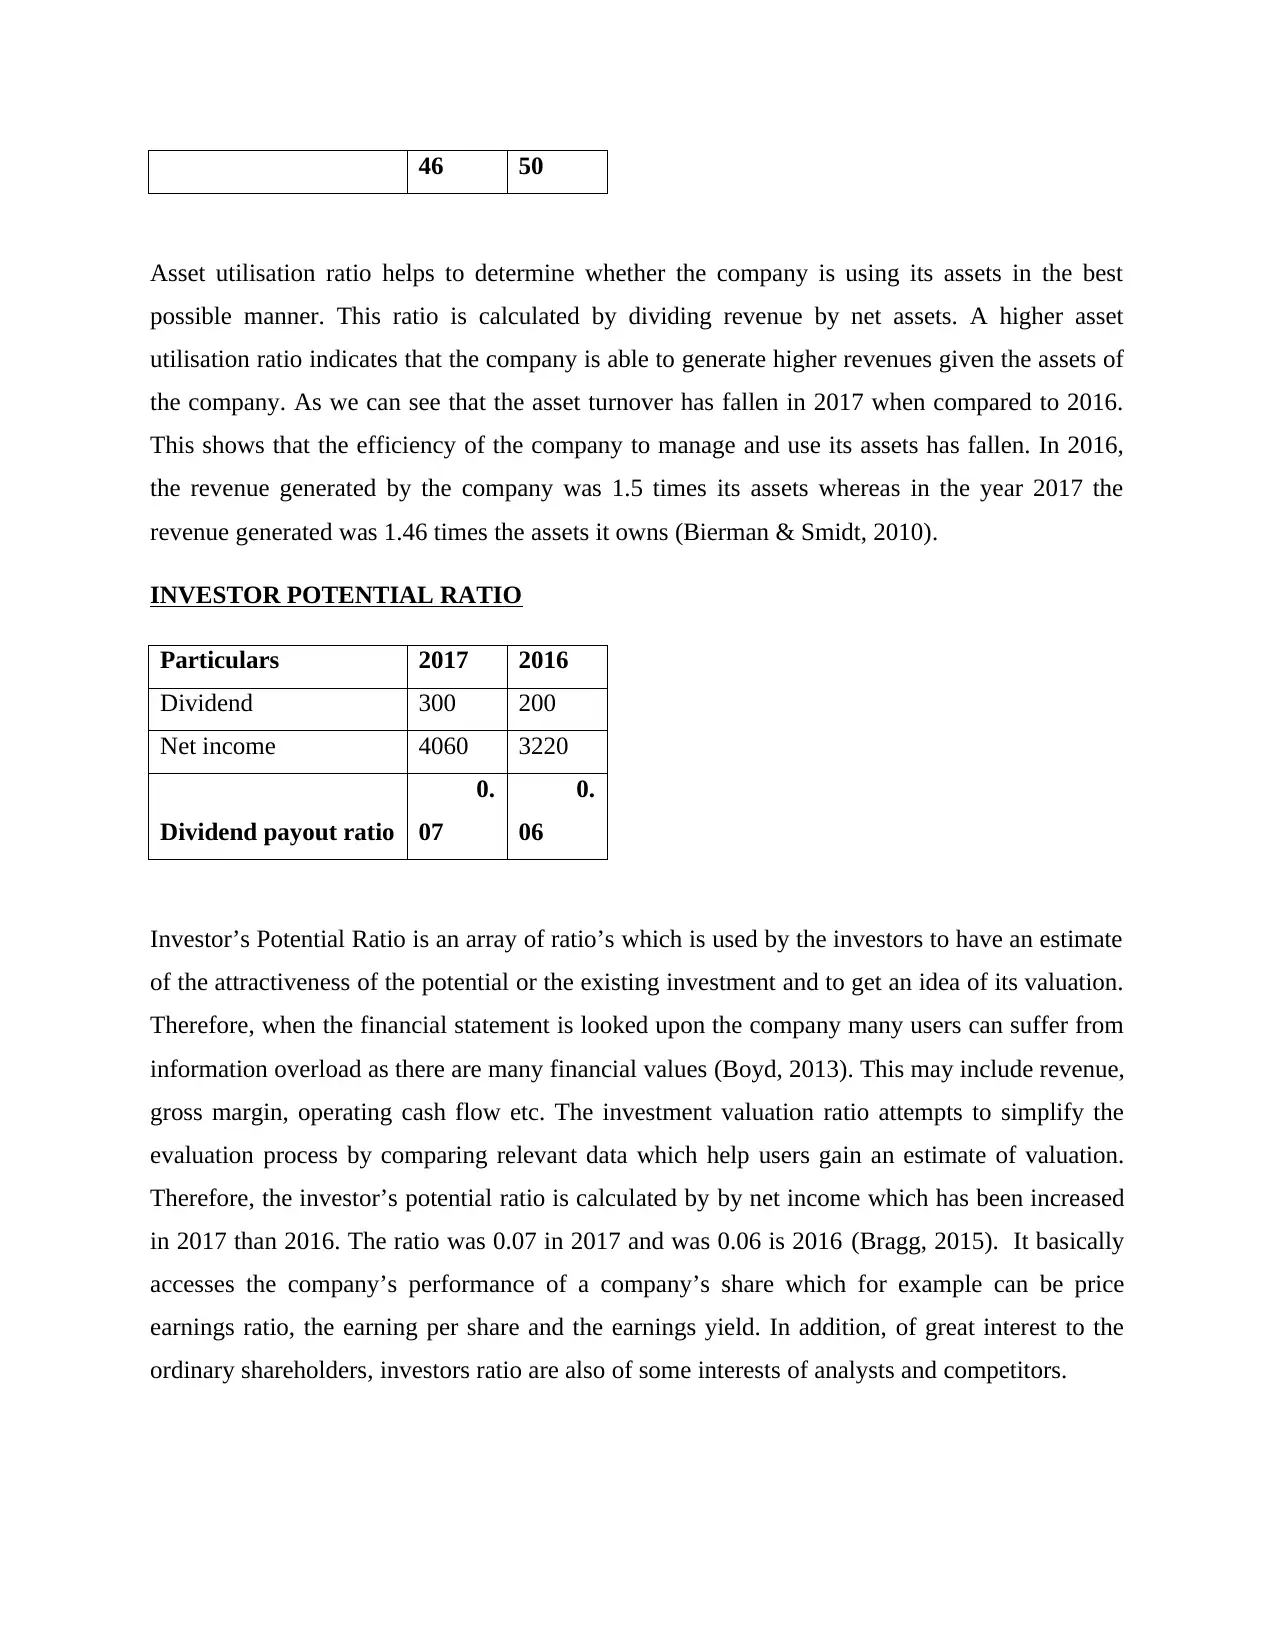
Asset utilisation ratio helps to determine whether the company is using its assets in the best
possible manner. This ratio is calculated by dividing revenue by net assets. A higher asset
utilisation ratio indicates that the company is able to generate higher revenues given the assets of
the company. As we can see that the asset turnover has fallen in 2017 when compared to 2016.
This shows that the efficiency of the company to manage and use its assets has fallen. In 2016,
the revenue generated by the company was 1.5 times its assets whereas in the year 2017 the
revenue generated was 1.46 times the assets it owns (Bierman & Smidt, 2010).
INVESTOR POTENTIAL RATIO
Particulars 2017 2016
Dividend 300 200
Net income 4060 3220
Dividend payout ratio
0.
07
0.
06
Investor’s Potential Ratio is an array of ratio’s which is used by the investors to have an estimate
of the attractiveness of the potential or the existing investment and to get an idea of its valuation.
Therefore, when the financial statement is looked upon the company many users can suffer from
information overload as there are many financial values (Boyd, 2013). This may include revenue,
gross margin, operating cash flow etc. The investment valuation ratio attempts to simplify the
evaluation process by comparing relevant data which help users gain an estimate of valuation.
Therefore, the investor’s potential ratio is calculated by by net income which has been increased
in 2017 than 2016. The ratio was 0.07 in 2017 and was 0.06 is 2016 (Bragg, 2015). It basically
accesses the company’s performance of a company’s share which for example can be price
earnings ratio, the earning per share and the earnings yield. In addition, of great interest to the
ordinary shareholders, investors ratio are also of some interests of analysts and competitors.
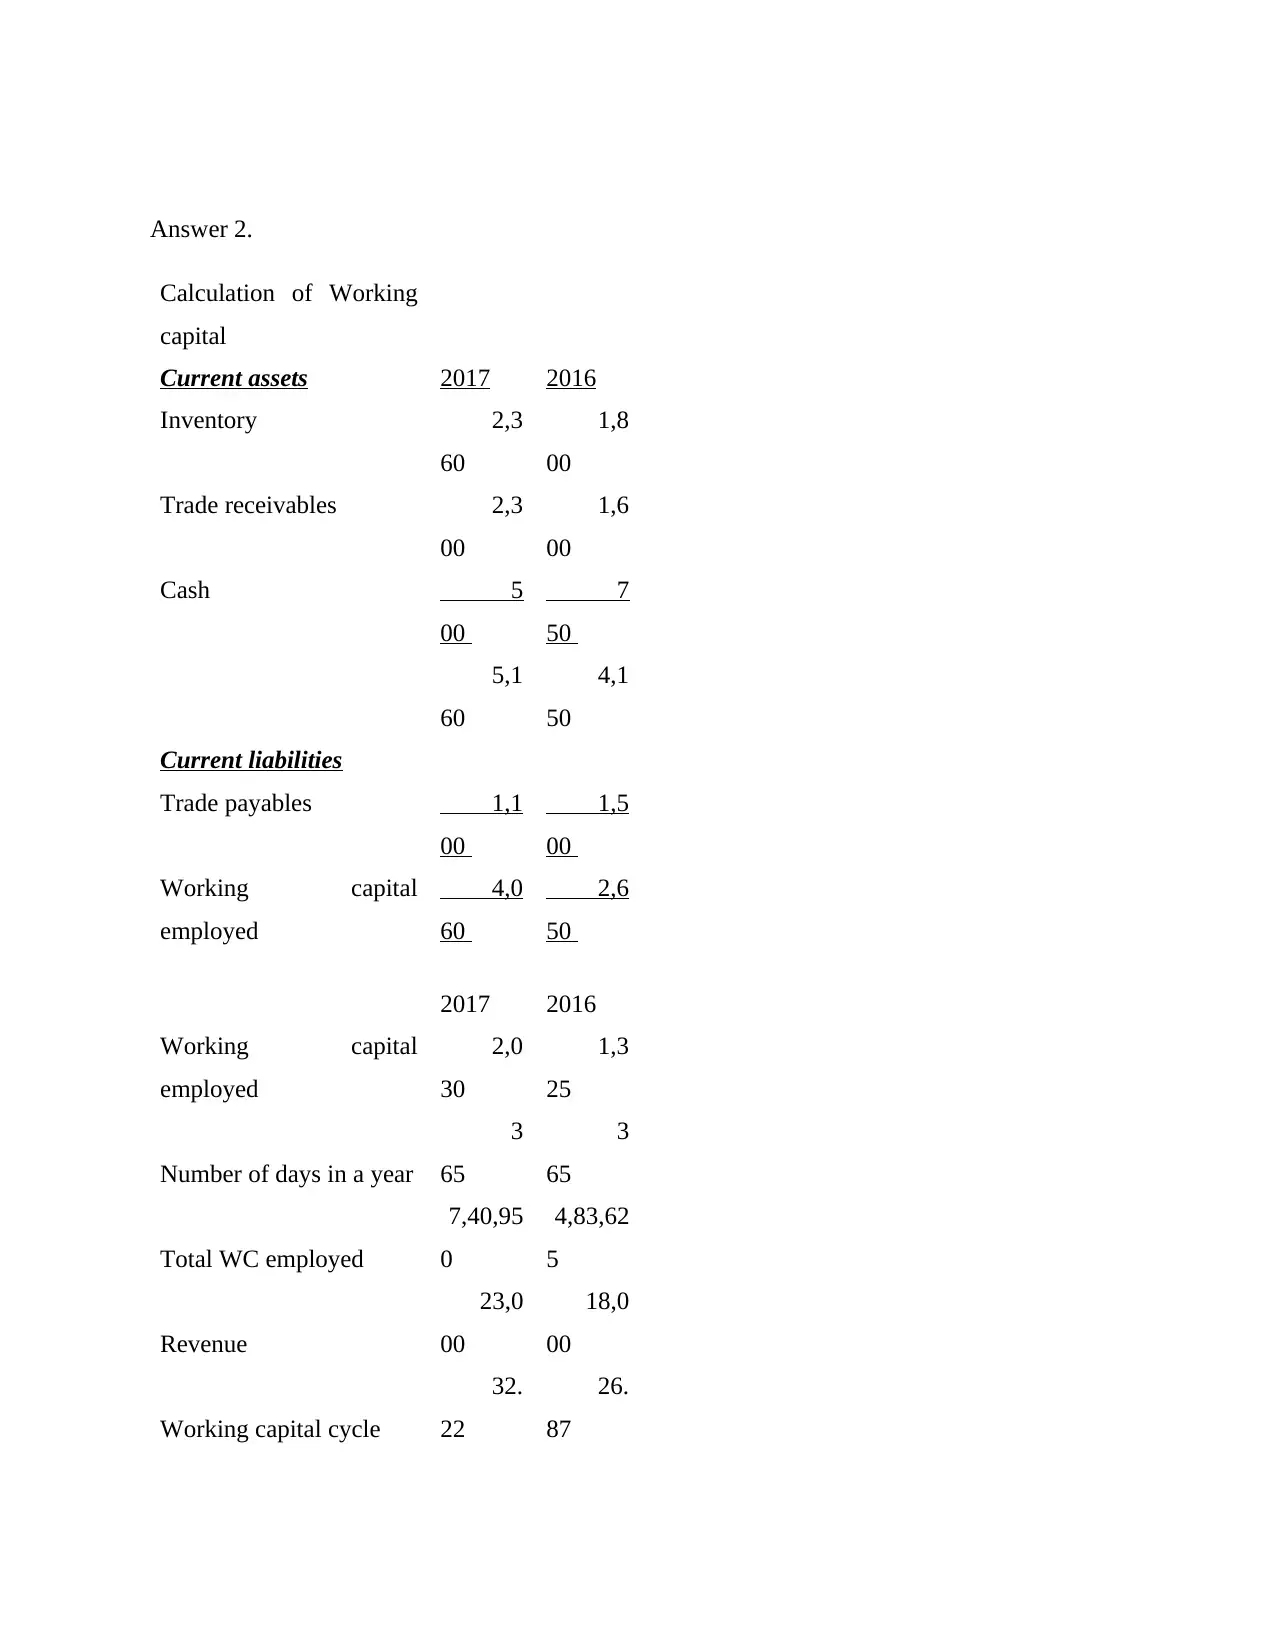
Answer 2.
Calculation of Working
capital
Current assets 2017 2016
Inventory 2,3
60
1,8
00
Trade receivables 2,3
00
1,6
00
Cash 5
00
7
50
5,1
60
4,1
50
Current liabilities
Trade payables 1,1
00
1,5
00
Working capital
employed
4,0
60
2,6
50
2017 2016
Working capital
employed
2,0
30
1,3
25
Number of days in a year
3
65
3
65
Total WC employed
7,40,95
0
4,83,62
5
Revenue
23,0
00
18,0
00
Working capital cycle
32.
22
26.
87
⊘ This is a preview!⊘
Do you want full access?
Subscribe today to unlock all pages.
Trusted by 1+ million students worldwide
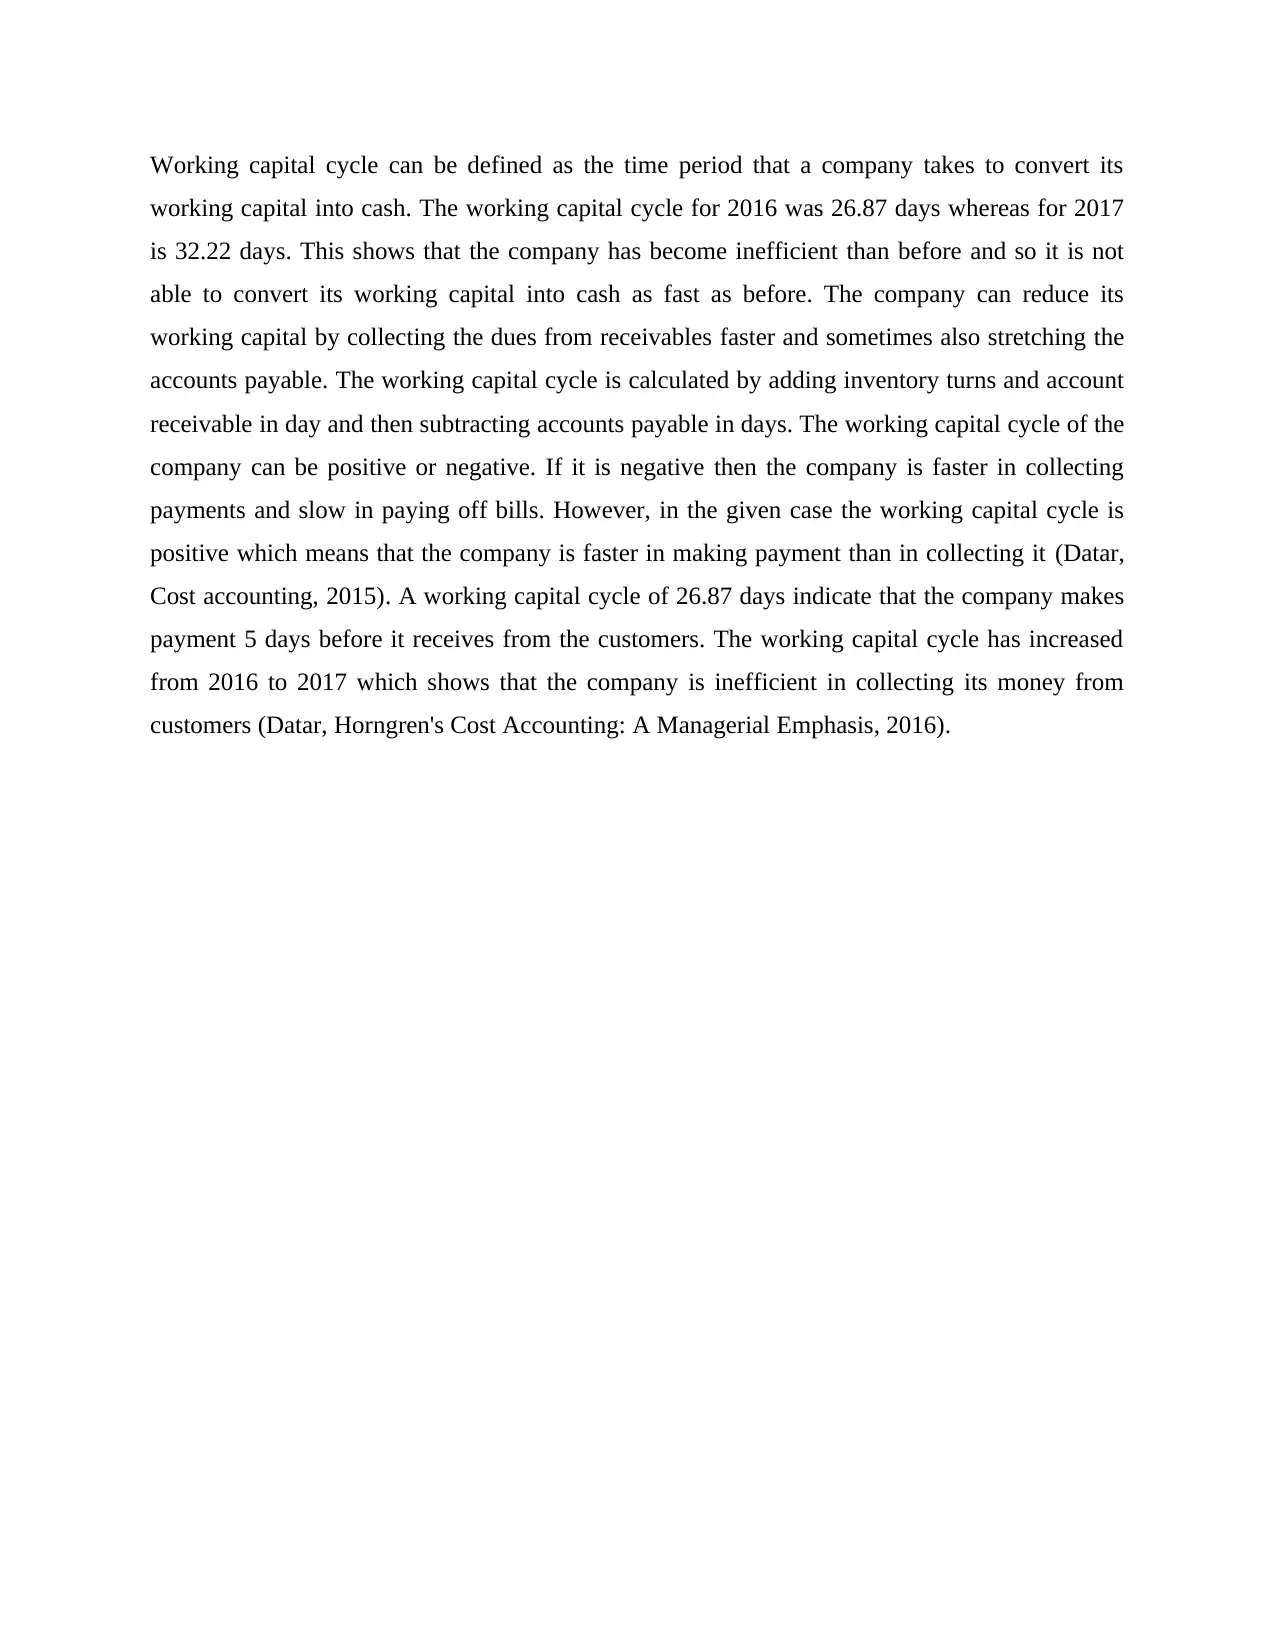
Working capital cycle can be defined as the time period that a company takes to convert its
working capital into cash. The working capital cycle for 2016 was 26.87 days whereas for 2017
is 32.22 days. This shows that the company has become inefficient than before and so it is not
able to convert its working capital into cash as fast as before. The company can reduce its
working capital by collecting the dues from receivables faster and sometimes also stretching the
accounts payable. The working capital cycle is calculated by adding inventory turns and account
receivable in day and then subtracting accounts payable in days. The working capital cycle of the
company can be positive or negative. If it is negative then the company is faster in collecting
payments and slow in paying off bills. However, in the given case the working capital cycle is
positive which means that the company is faster in making payment than in collecting it (Datar,
Cost accounting, 2015). A working capital cycle of 26.87 days indicate that the company makes
payment 5 days before it receives from the customers. The working capital cycle has increased
from 2016 to 2017 which shows that the company is inefficient in collecting its money from
customers (Datar, Horngren's Cost Accounting: A Managerial Emphasis, 2016).
Paraphrase This Document
Need a fresh take? Get an instant paraphrase of this document with our AI Paraphraser
Part B
Answer 1.
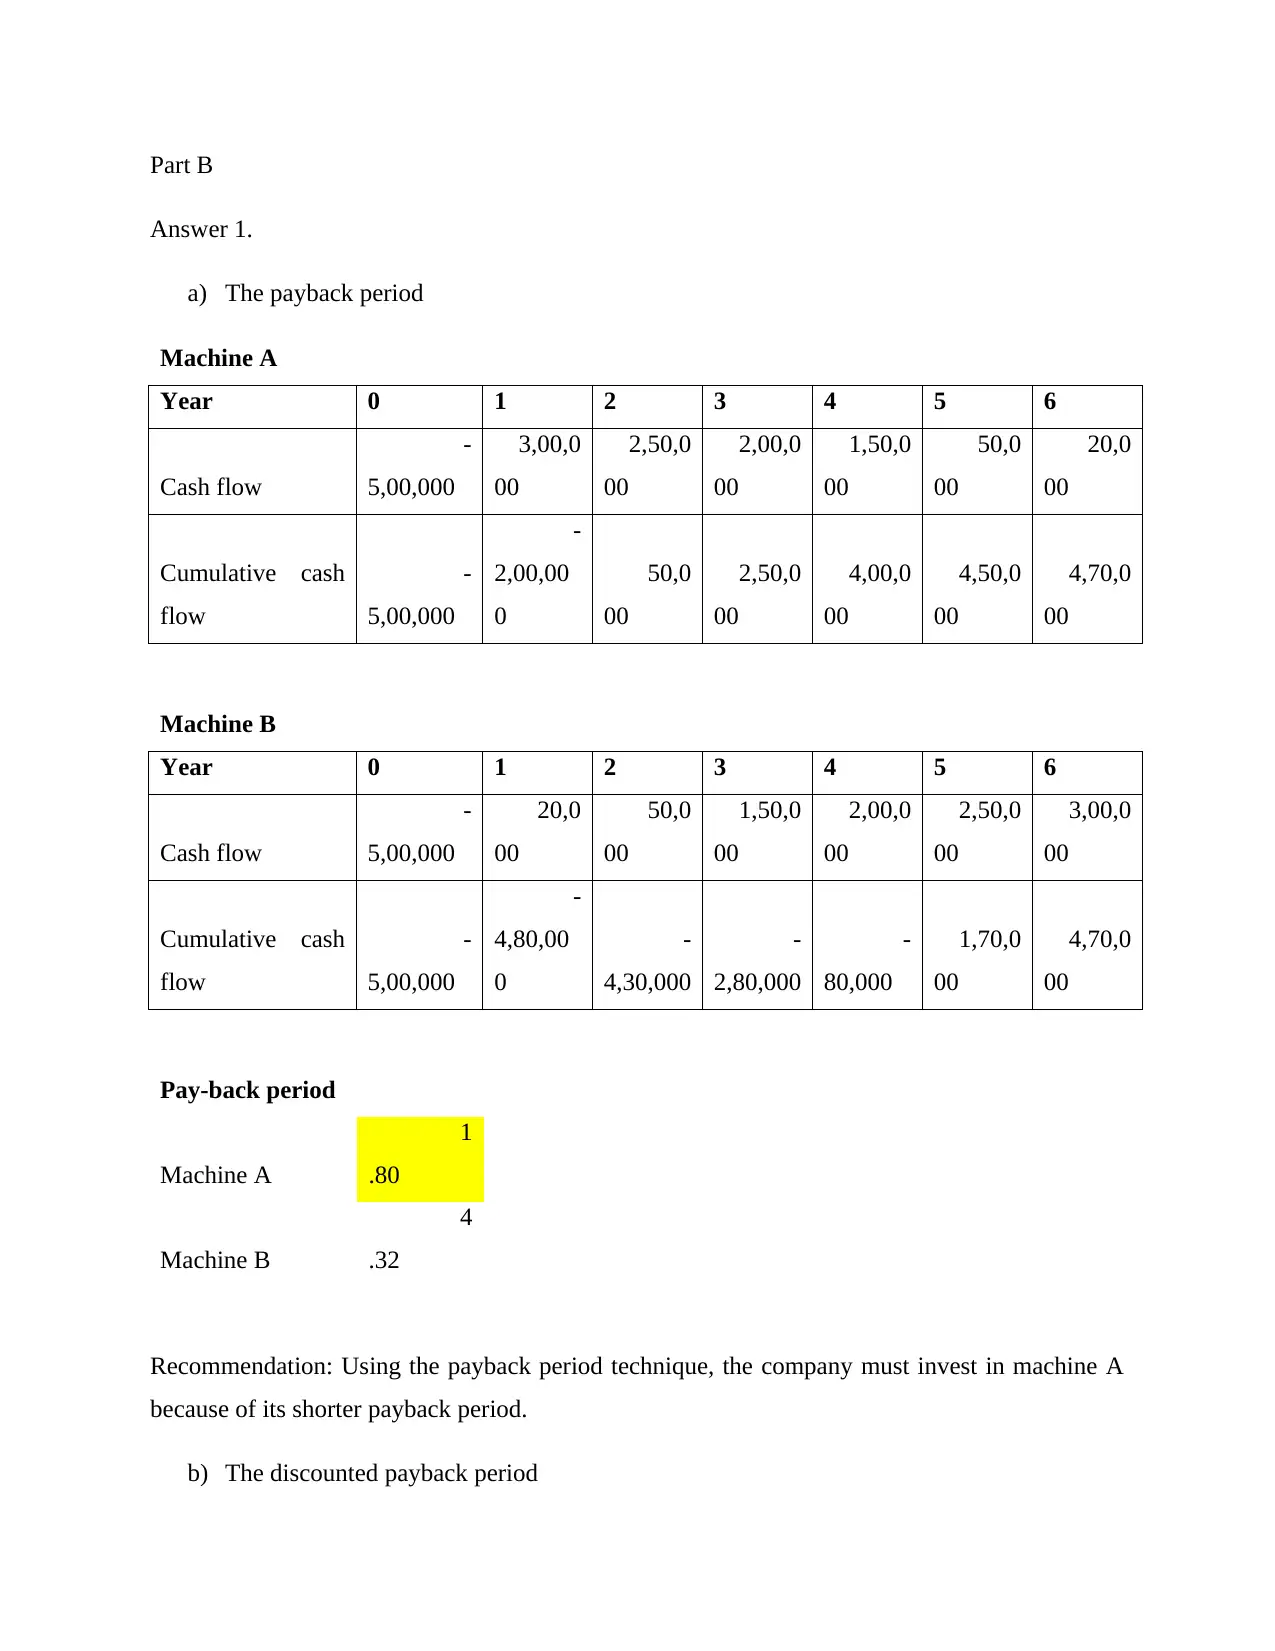
a) The payback period
Machine A
Year 0 1 2 3 4 5 6
Cash flow
-
5,00,000
3,00,0
00
2,50,0
00
2,00,0
00
1,50,0
00
50,0
00
20,0
00
Cumulative cash
flow
-
5,00,000
-
2,00,00
0
50,0
00
2,50,0
00
4,00,0
00
4,50,0
00
4,70,0
00
Machine B
Year 0 1 2 3 4 5 6
Cash flow
-
5,00,000
20,0
00
50,0
00
1,50,0
00
2,00,0
00
2,50,0
00
3,00,0
00
Cumulative cash
flow
-
5,00,000
-
4,80,00
0
-
4,30,000
-
2,80,000
-
80,000
1,70,0
00
4,70,0
00
Pay-back period
Machine A
1
.80
Machine B
4
.32
Recommendation: Using the payback period technique, the company must invest in machine A
because of its shorter payback period.
b) The discounted payback period
Answer 1.
a) The payback period
Machine A
Year 0 1 2 3 4 5 6
Cash flow
-
5,00,000
3,00,0
00
2,50,0
00
2,00,0
00
1,50,0
00
50,0
00
20,0
00
Cumulative cash
flow
-
5,00,000
-
2,00,00
0
50,0
00
2,50,0
00
4,00,0
00
4,50,0
00
4,70,0
00
Machine B
Year 0 1 2 3 4 5 6
Cash flow
-
5,00,000
20,0
00
50,0
00
1,50,0
00
2,00,0
00
2,50,0
00
3,00,0
00
Cumulative cash
flow
-
5,00,000
-
4,80,00
0
-
4,30,000
-
2,80,000
-
80,000
1,70,0
00
4,70,0
00
Pay-back period
Machine A
1
.80
Machine B
4
.32
Recommendation: Using the payback period technique, the company must invest in machine A
because of its shorter payback period.
b) The discounted payback period
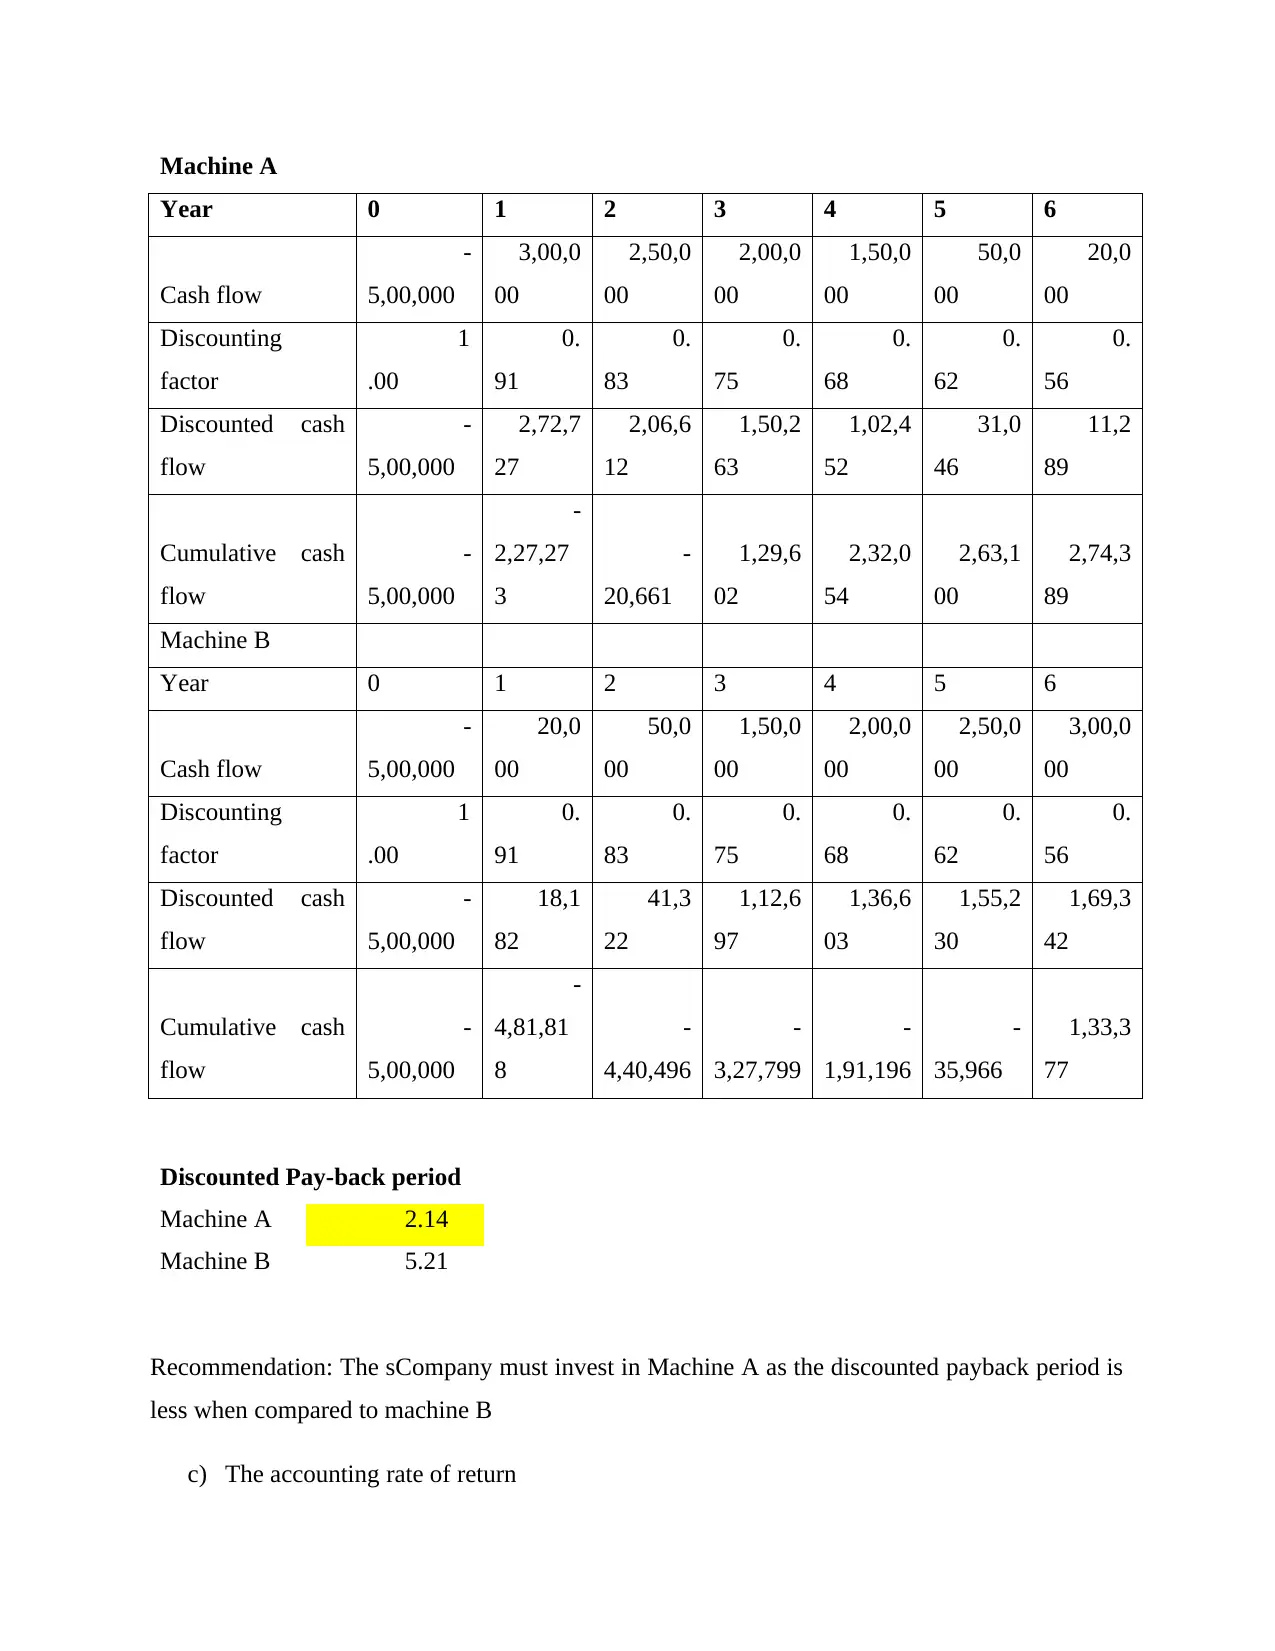
Machine A
Year 0 1 2 3 4 5 6
Cash flow
-
5,00,000
3,00,0
00
2,50,0
00
2,00,0
00
1,50,0
00
50,0
00
20,0
00
Discounting
factor
1
.00
0.
91
0.
83
0.
75
0.
68
0.
62
0.
56
Discounted cash
flow
-
5,00,000
2,72,7
27
2,06,6
12
1,50,2
63
1,02,4
52
31,0
46
11,2
89
Cumulative cash
flow
-
5,00,000
-
2,27,27
3
-
20,661
1,29,6
02
2,32,0
54
2,63,1
00
2,74,3
89
Machine B
Year 0 1 2 3 4 5 6
Cash flow
-
5,00,000
20,0
00
50,0
00
1,50,0
00
2,00,0
00
2,50,0
00
3,00,0
00
Discounting
factor
1
.00
0.
91
0.
83
0.
75
0.
68
0.
62
0.
56
Discounted cash
flow
-
5,00,000
18,1
82
41,3
22
1,12,6
97
1,36,6
03
1,55,2
30
1,69,3
42
Cumulative cash
flow
-
5,00,000
-
4,81,81
8
-
4,40,496
-
3,27,799
-
1,91,196
-
35,966
1,33,3
77
Discounted Pay-back period
Machine A 2.14
Machine B 5.21
Recommendation: The sCompany must invest in Machine A as the discounted payback period is
less when compared to machine B
c) The accounting rate of return
Year 0 1 2 3 4 5 6
Cash flow
-
5,00,000
3,00,0
00
2,50,0
00
2,00,0
00
1,50,0
00
50,0
00
20,0
00
Discounting
factor
1
.00
0.
91
0.
83
0.
75
0.
68
0.
62
0.
56
Discounted cash
flow
-
5,00,000
2,72,7
27
2,06,6
12
1,50,2
63
1,02,4
52
31,0
46
11,2
89
Cumulative cash
flow
-
5,00,000
-
2,27,27
3
-
20,661
1,29,6
02
2,32,0
54
2,63,1
00
2,74,3
89
Machine B
Year 0 1 2 3 4 5 6
Cash flow
-
5,00,000
20,0
00
50,0
00
1,50,0
00
2,00,0
00
2,50,0
00
3,00,0
00
Discounting
factor
1
.00
0.
91
0.
83
0.
75
0.
68
0.
62
0.
56
Discounted cash
flow
-
5,00,000
18,1
82
41,3
22
1,12,6
97
1,36,6
03
1,55,2
30
1,69,3
42
Cumulative cash
flow
-
5,00,000
-
4,81,81
8
-
4,40,496
-
3,27,799
-
1,91,196
-
35,966
1,33,3
77
Discounted Pay-back period
Machine A 2.14
Machine B 5.21
Recommendation: The sCompany must invest in Machine A as the discounted payback period is
less when compared to machine B
c) The accounting rate of return
⊘ This is a preview!⊘
Do you want full access?
Subscribe today to unlock all pages.
Trusted by 1+ million students worldwide
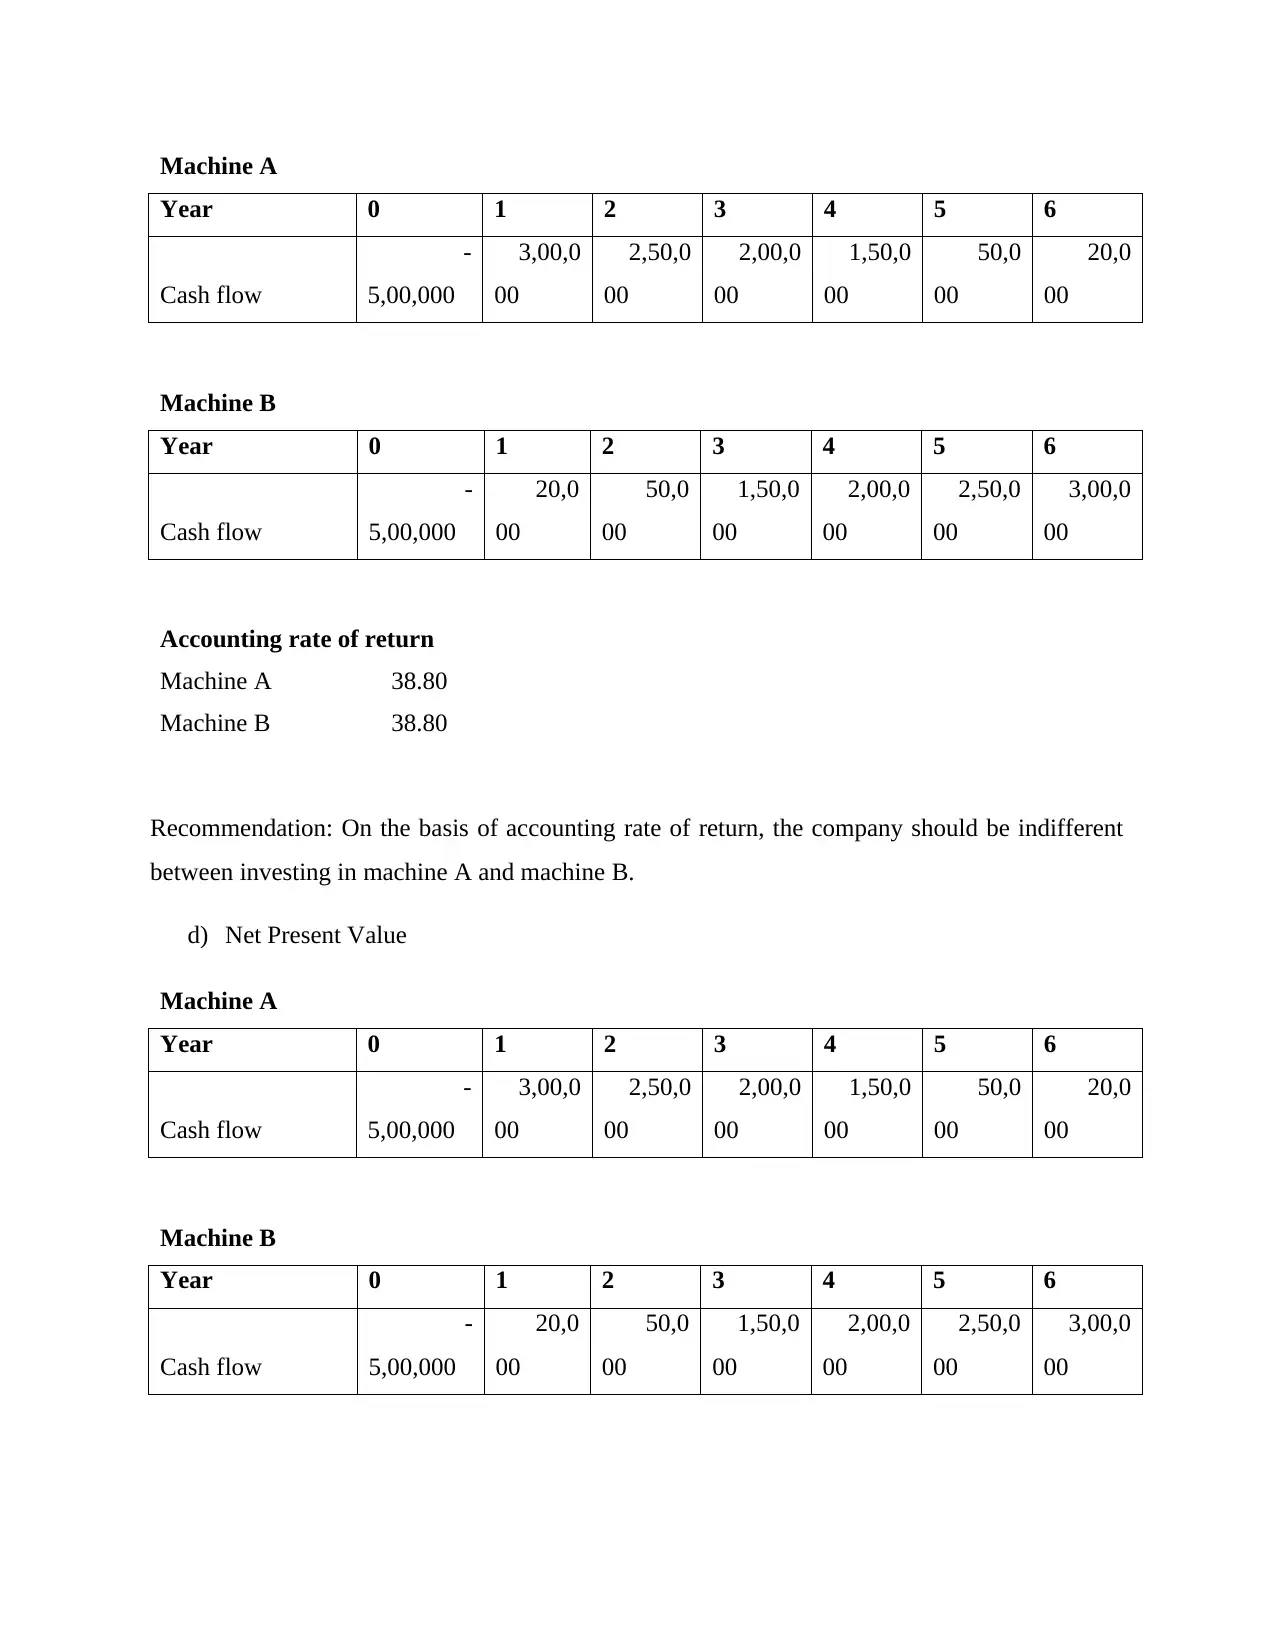
Machine A
Year 0 1 2 3 4 5 6
Cash flow
-
5,00,000
3,00,0
00
2,50,0
00
2,00,0
00
1,50,0
00
50,0
00
20,0
00
Machine B
Year 0 1 2 3 4 5 6
Cash flow
-
5,00,000
20,0
00
50,0
00
1,50,0
00
2,00,0
00
2,50,0
00
3,00,0
00
Accounting rate of return
Machine A 38.80
Machine B 38.80
Recommendation: On the basis of accounting rate of return, the company should be indifferent
between investing in machine A and machine B.
d) Net Present Value
Machine A
Year 0 1 2 3 4 5 6
Cash flow
-
5,00,000
3,00,0
00
2,50,0
00
2,00,0
00
1,50,0
00
50,0
00
20,0
00
Machine B
Year 0 1 2 3 4 5 6
Cash flow
-
5,00,000
20,0
00
50,0
00
1,50,0
00
2,00,0
00
2,50,0
00
3,00,0
00
Year 0 1 2 3 4 5 6
Cash flow
-
5,00,000
3,00,0
00
2,50,0
00
2,00,0
00
1,50,0
00
50,0
00
20,0
00
Machine B
Year 0 1 2 3 4 5 6
Cash flow
-
5,00,000
20,0
00
50,0
00
1,50,0
00
2,00,0
00
2,50,0
00
3,00,0
00
Accounting rate of return
Machine A 38.80
Machine B 38.80
Recommendation: On the basis of accounting rate of return, the company should be indifferent
between investing in machine A and machine B.
d) Net Present Value
Machine A
Year 0 1 2 3 4 5 6
Cash flow
-
5,00,000
3,00,0
00
2,50,0
00
2,00,0
00
1,50,0
00
50,0
00
20,0
00
Machine B
Year 0 1 2 3 4 5 6
Cash flow
-
5,00,000
20,0
00
50,0
00
1,50,0
00
2,00,0
00
2,50,0
00
3,00,0
00
Paraphrase This Document
Need a fresh take? Get an instant paraphrase of this document with our AI Paraphraser
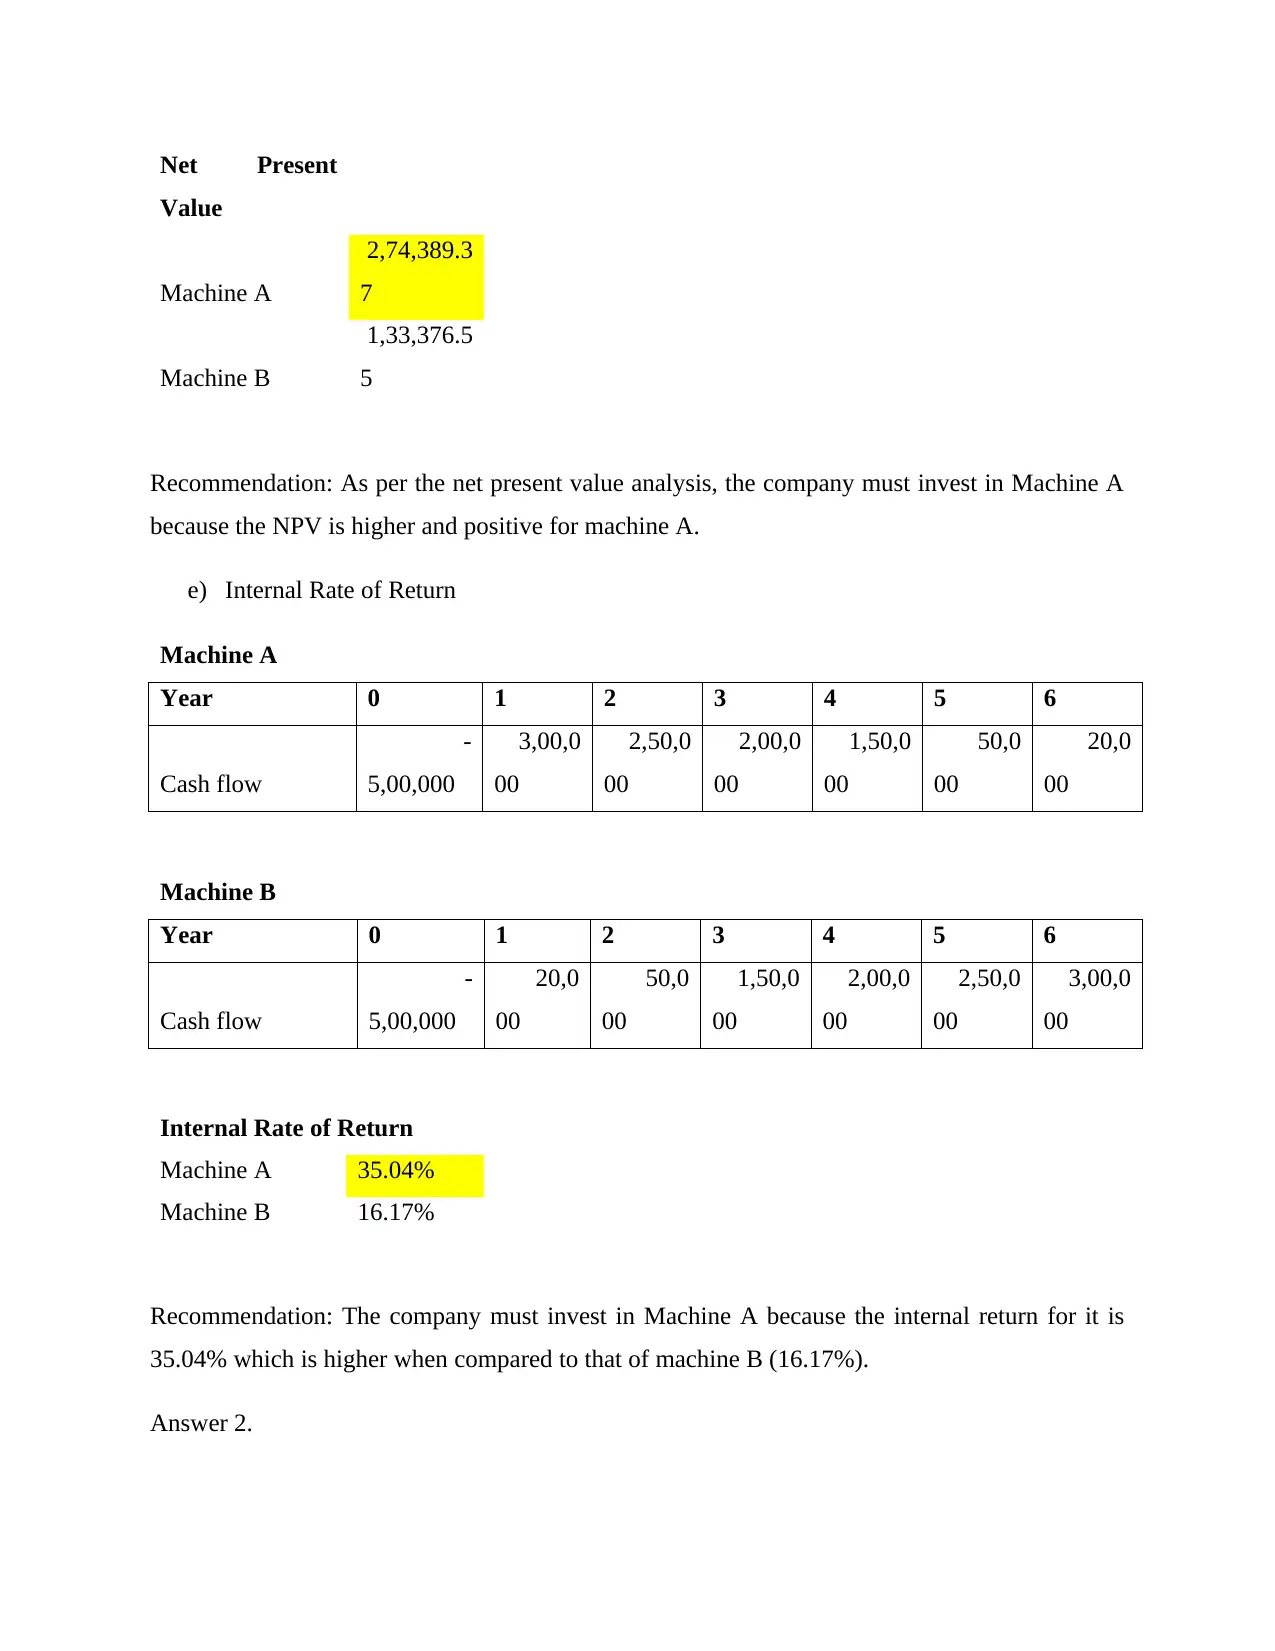
Net Present
Value
Machine A
2,74,389.3
7
Machine B
1,33,376.5
5
Recommendation: As per the net present value analysis, the company must invest in Machine A
because the NPV is higher and positive for machine A.
e) Internal Rate of Return
Machine A
Year 0 1 2 3 4 5 6
Cash flow
-
5,00,000
3,00,0
00
2,50,0
00
2,00,0
00
1,50,0
00
50,0
00
20,0
00
Machine B
Year 0 1 2 3 4 5 6
Cash flow
-
5,00,000
20,0
00
50,0
00
1,50,0
00
2,00,0
00
2,50,0
00
3,00,0
00
Internal Rate of Return
Machine A 35.04%
Machine B 16.17%
Recommendation: The company must invest in Machine A because the internal return for it is
35.04% which is higher when compared to that of machine B (16.17%).
Answer 2.
The payback period - This benefit of using this method is that it is very simple, understandable
and easy to calculate. However, the limitations of this method are that it takes into consideration
the initial investment and ignores the subsequent investments completely (Donohue, 2015). Also,
it does not account for time value of money.
The discounted payback period- It helps the business to decide whether to accept or reject a
particular project after taking into consideration the profitability along with the time value of
money concept. This technique is usually used when the company has to take decision for
mutually exclusive project. The limitation of using this technique is that it does not take into
account the cash flows generated after the breakeven point. Also, this just a breakeven technique
which helps the company to know the duration of recovering the initial investments made by it
(Easton, 2010).
The accounting rate of return- Accounting rate of return is the least preferred method to
analyse the acceptability of the project. The reason behind this is it completely ignores time
value of money and also it only considers profits that are earned by the company and ignores
cash flows (Elaine, 2015). It is very important to analyse the cash flows before accepting or
rejecting a project and so this technique is not preferred.
The Net present value- This is the most commonly and the best technique of investment
appraisal. There are various benefits of using this technique such as its assumption of
reinvestment of cash flows, it considers all the cash flows and also accepts the conventional cash
flow pattern. It is a good measure of profitability as it takes into consideration the factor risks.
However, there are certain limitations also. The limitations include ignoring sunk cost,
estimation of opportunity cost, difficulty in the estimation f required rate of return, does not
account for differences in size of various projects. A company must accept a particular project if
the net present value of a project is positive and higher when compared to the NPV’s of other
projects (Fisher, 2012).
Internal rate of return- This method helps to forecast the profits that are expected to be
generated in future. This method also considers the concept of time value of money. This method
is said to be the most accurate and credible method of evaluating the various projects that the
company has been proposed for (Fridson & Alvarez, 2012). However, the disadvantage of this
⊘ This is a preview!⊘
Do you want full access?
Subscribe today to unlock all pages.
Trusted by 1+ million students worldwide
1 out of 19
Related Documents


Your All-in-One AI-Powered Toolkit for Academic Success.
+13062052269
info@desklib.com
Available 24*7 on WhatsApp / Email
![[object Object]](/_next/static/media/star-bottom.7253800d.svg)
Unlock your academic potential
Copyright © 2020–2026 A2Z Services. All Rights Reserved. Developed and managed by ZUCOL.