University of Greenwich: Stock Valuation Report FINA 1082

Verified

Added on  2023/04/23

|4
|426
|432
Report
AI Summary
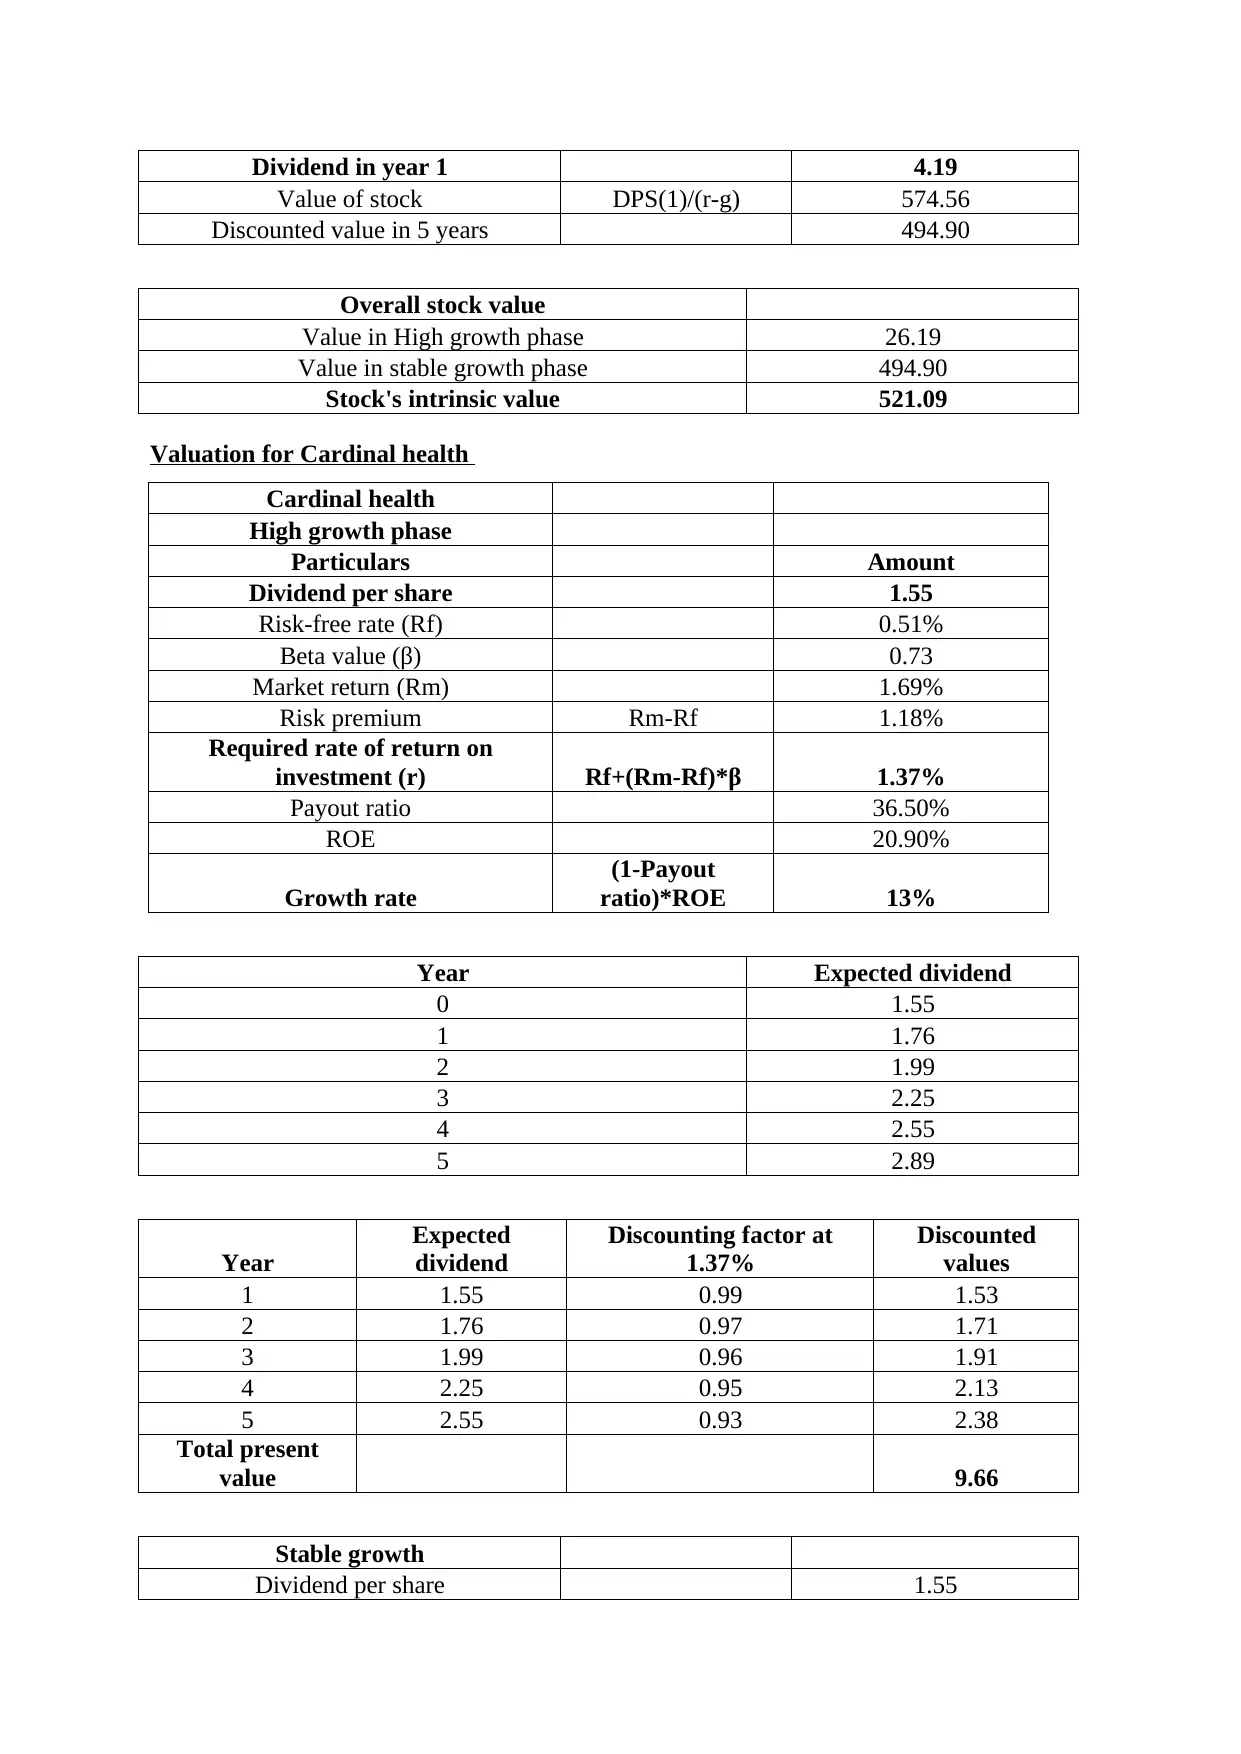
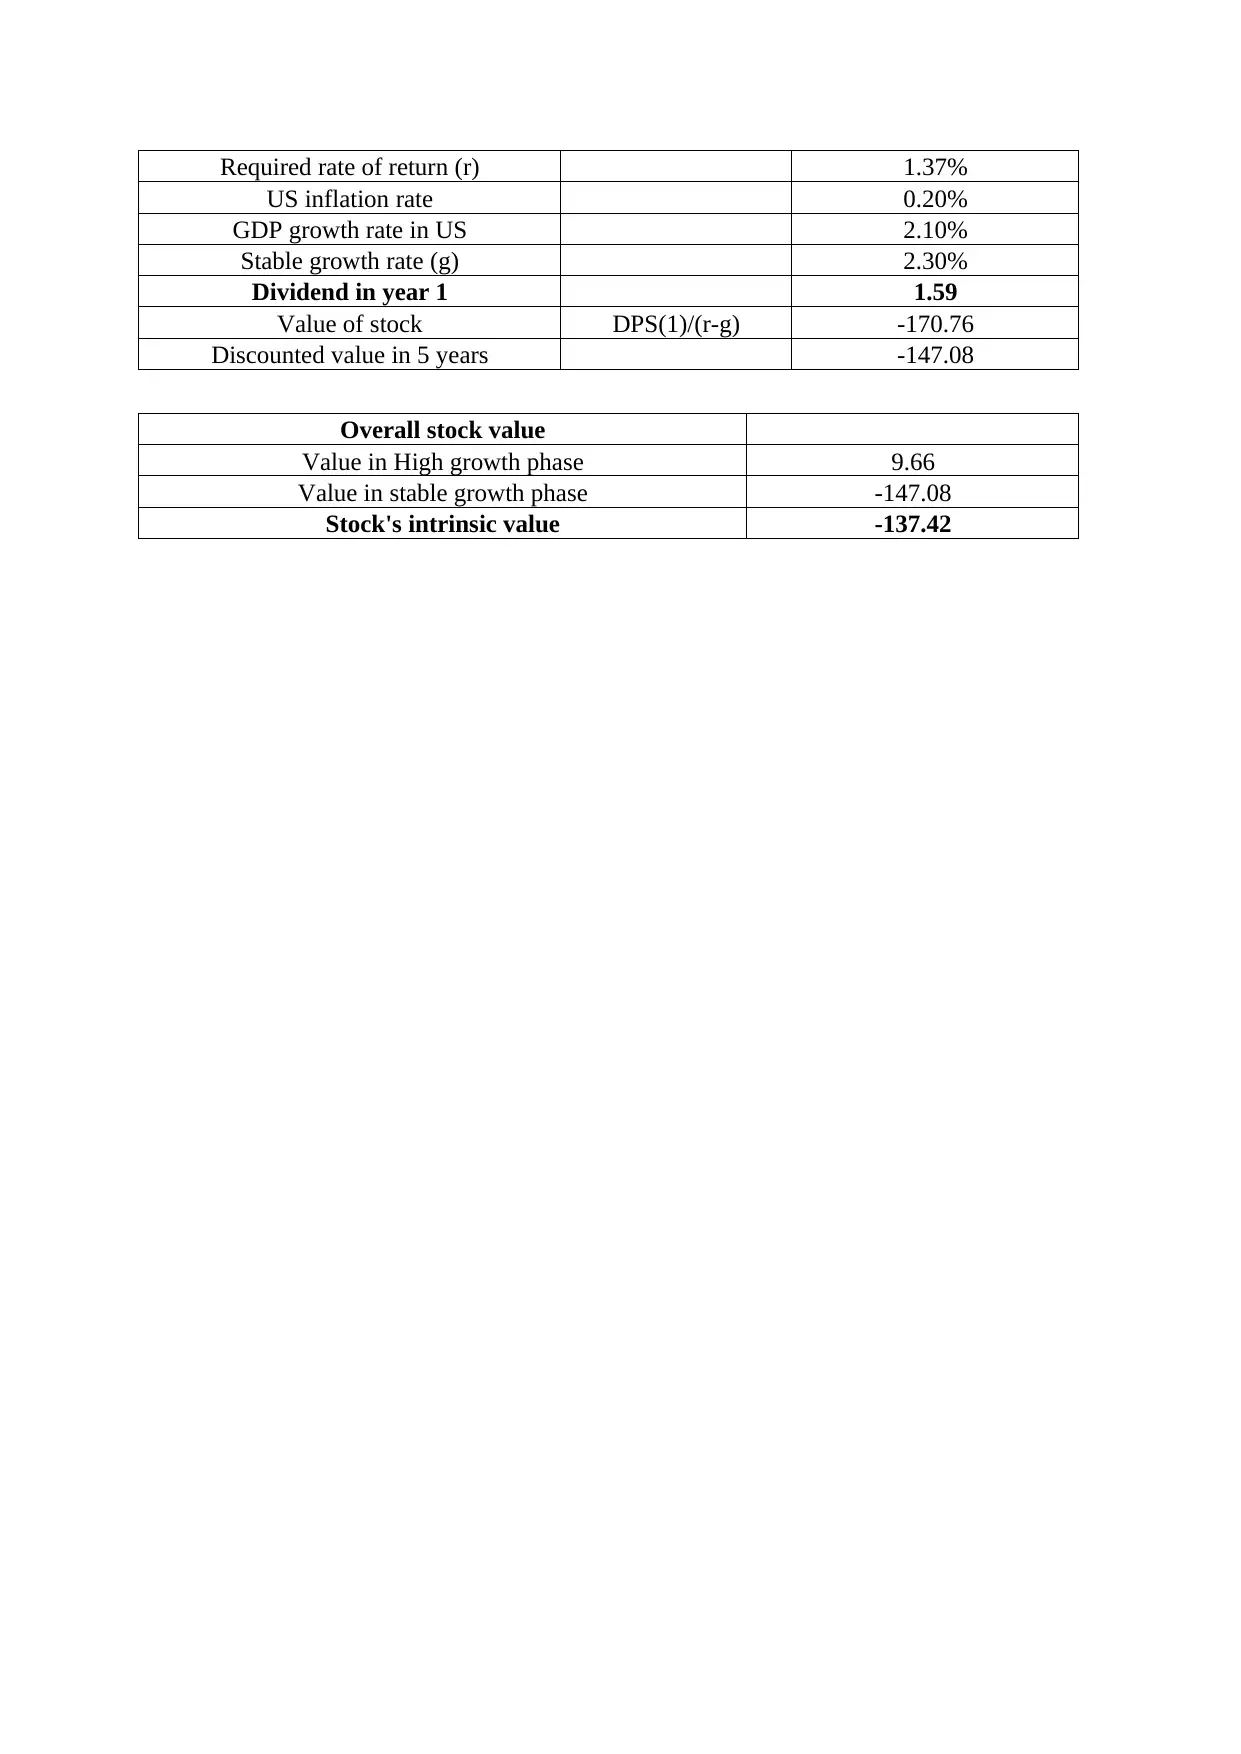
This report presents a stock valuation analysis of two companies: 3M (industrial) and Cardinal Health (healthcare and social care). The analysis includes calculations for the high growth and stable growth phases, considering dividend per share, risk-free rate, beta, market return, and other relevant financial metrics. The intrinsic value of each stock is determined by discounting future dividends and considering the required rate of return. The report provides detailed calculations and insights into the stock valuation process, offering a comprehensive financial analysis of both companies. The report also includes the application of the dividend discount model to determine the stock values. The analysis aims to determine the fair value of each stock based on the given financial data.
tabler-icon-diamond-filled.svg

Contribute Materials

Your contribution can guide someone’s learning journey. Share your documents today.
Document Page
Financial management
tabler-icon-diamond-filled.svg

Secure Best Marks with AI Grader

Need help grading? Try our AI Grader for instant feedback on your assignments.
Document Page
QUESTION 2
Stock valuation of two companies
Two companies selected: 3M (industrial) & Cardinal Health (Health and social care)
Valuation for 3M
3 M
High growth phase
Particulars Amount
Dividend per share 4.1
Risk-free rate (Rf) 0.51%
Beta value (β) 1.17
Market return (Rm) 2.66%
Risk premium Rm-Rf 2.15%
Required rate of return on investment
(r) Rf+(Rm-Rf)*β 3.03%
Payout ratio 50.90%
ROE 35.08%
Growth rate
(1-Payout
ratio)*ROE 17%
Year Expected dividend
0 4.10
1 4.81
2 5.63
3 6.60
4 7.74
5 9.08
Year
Expected
dividend
Discounting factor at
3.03%
Discounted
values
1 4.10 0.97 3.98
2 4.81 0.94 4.53
3 5.63 0.91 5.15
4 6.60 0.89 5.86
5 7.74 0.86 6.67
Total present
value 26.19
Stable growth
Dividend per share 4.10
Required rate of return (r) 3.03%
US inflation rate 0.20%
GDP growth rate in US 2.10%
Stable growth rate (g) 2.30%
Document Page
Dividend in year 1 4.19
Value of stock DPS(1)/(r-g) 574.56
Discounted value in 5 years 494.90
Overall stock value
Value in High growth phase 26.19
Value in stable growth phase 494.90
Stock's intrinsic value 521.09
Valuation for Cardinal health
Cardinal health
High growth phase
Particulars Amount
Dividend per share 1.55
Risk-free rate (Rf) 0.51%
Beta value (β) 0.73
Market return (Rm) 1.69%
Risk premium Rm-Rf 1.18%
Required rate of return on
investment (r) Rf+(Rm-Rf)*β 1.37%
Payout ratio 36.50%
ROE 20.90%
Growth rate
(1-Payout
ratio)*ROE 13%
Year Expected dividend
0 1.55
1 1.76
2 1.99
3 2.25
4 2.55
5 2.89
Year
Expected
dividend
Discounting factor at
1.37%
Discounted
values
1 1.55 0.99 1.53
2 1.76 0.97 1.71
3 1.99 0.96 1.91
4 2.25 0.95 2.13
5 2.55 0.93 2.38
Total present
value 9.66
Stable growth
Dividend per share 1.55
Document Page
Required rate of return (r) 1.37%
US inflation rate 0.20%
GDP growth rate in US 2.10%
Stable growth rate (g) 2.30%
Dividend in year 1 1.59
Value of stock DPS(1)/(r-g) -170.76
Discounted value in 5 years -147.08
Overall stock value
Value in High growth phase 9.66
Value in stable growth phase -147.08
Stock's intrinsic value -137.42
chevron_up_icon
1 out of 4
circle_padding
hide_on_mobile
zoom_out_icon
logo.png

Your All-in-One AI-Powered Toolkit for Academic Success.

Available 24*7 on WhatsApp / Email

[object Object]