Financial Management Report: Analysis of Tesco's Financial Performance
VerifiedAdded on 2020/02/12
|9
|2807
|205
Report
AI Summary
This report provides a detailed financial analysis of Tesco, a British multinational retailer, focusing on its performance in the stock exchange market. The report employs both qualitative and quantitative approaches, including an examination of stock price movements and a comprehensive ratio analysis covering liquidity, profitability, capital structure, and market value ratios over a five-year period. The analysis compares Tesco's performance with that of its competitor, Sainsbury's, highlighting trends in current ratios, net profit ratios, return on assets, debt-to-equity ratios, and interest coverage. The report also calculates the value of Tesco's stock using the constant dividend growth rate model, offering recommendations based on the findings and concluding with an assessment of Tesco's overall financial health and market position.
Title Page:
Assignment title
FINANCIAL MANAGEMENT
Word count: 2250
Student name:
Student number:
Subject name:
AQF Level:
Assignment title
FINANCIAL MANAGEMENT
Word count: 2250
Student name:
Student number:
Subject name:
AQF Level:
Paraphrase This Document
Need a fresh take? Get an instant paraphrase of this document with our AI Paraphraser
EXECUTIVE SUMMARY
Knowledge about financial management is essential as the existing condition of the
business will be improved with the usage of financial resources. Manager needs to refine
their financial knowledge in order to enhance their current skills and the capabilities as it is
important in order to get competitive advantage in front of kits employees. The current report
will emphasises on the financial performance of the business concern which is listed in the
stock exchange market. The efficiency of the firm will be assessed in relation to the volatility
in the external market. The finance is that significant component used by the business which
enhances the performance of the current business by covering up their internal deficiencies
lies in their existing corporation. The investment decisions taken by the business will help in
improving their existing functioning that helps in enhancing their overall business health.
Various options available with the business such as taking debt or equity component to be
involve in their capital structure of their firm in order to enhance their existing working
relationships. The financial performance of an entity will be assessed by analysing the past
five year facts and figures of the financial statements. Ratio analysis has used by an entity in
order to assess the impact of each and every components of the financial statements on their
overall business. It is that technique which is used to compare the previous year financial year
facts which helps in determining the success or failure of the existing business. The financial
performance of the business concern will emphasises on various categories such as liquidity,
profitability, capital structure and market value ratios in improving overall business
performance of an entity in the external market. This report will majorly focuses on two
aspects such as qualitative and quantitative approaches adopted by an entity in analysing the
financial performance of an entity.
Table of content
s
INTRODUCTION.....................................................................................................................................1
Qualitative analysis...........................................................................................................................1
Background.......................................................................................................................................1
Stock price movements......................................................................................................................2
Quantitative Analysis........................................................................................................................2
Ratio analysis....................................................................................................................................2
Calculate value of stock using constant dividend growth rate model.................................................4
Recommendation...............................................................................................................................5
CONCLUSION.........................................................................................................................................5
References list.......................................................................................................................................6
⊘ This is a preview!⊘
Do you want full access?
Subscribe today to unlock all pages.
Trusted by 1+ million students worldwide
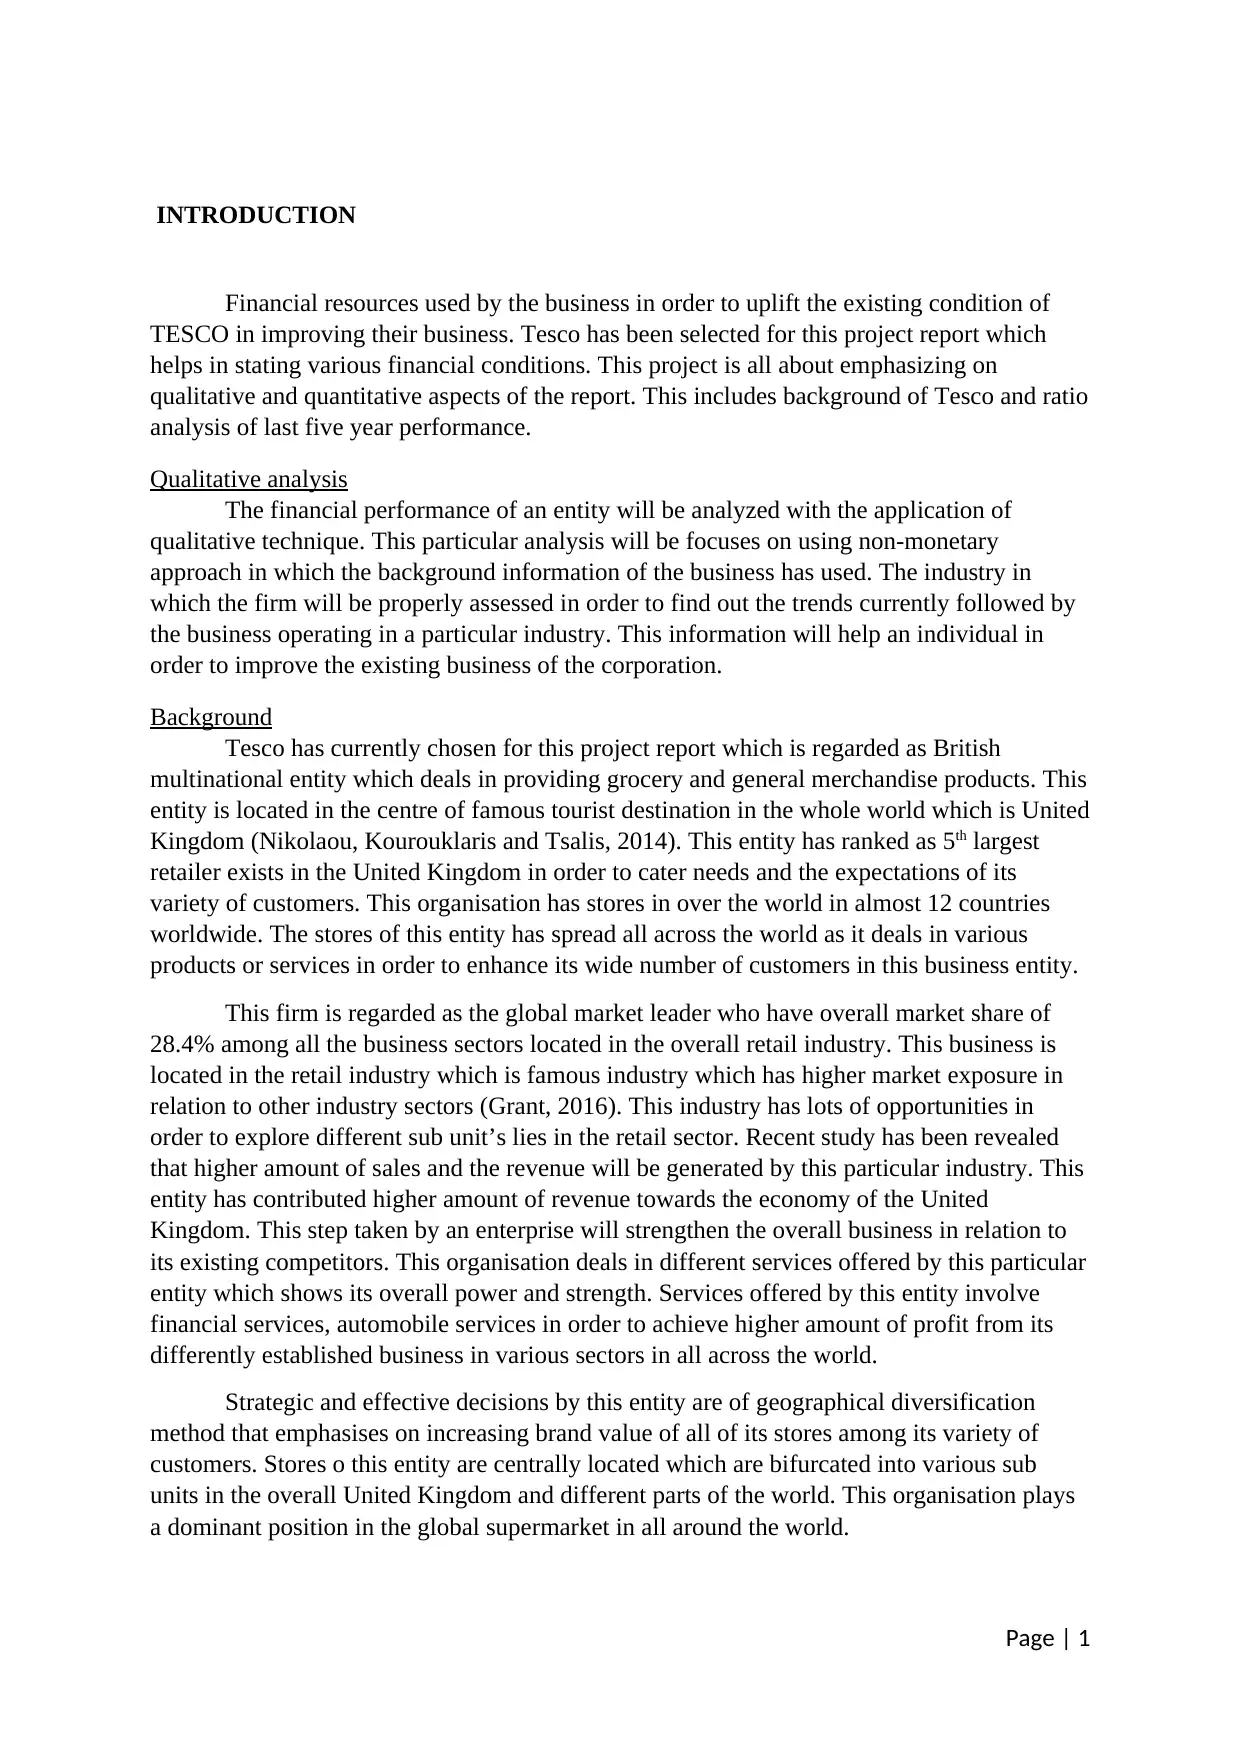
INTRODUCTION
Financial resources used by the business in order to uplift the existing condition of
TESCO in improving their business. Tesco has been selected for this project report which
helps in stating various financial conditions. This project is all about emphasizing on
qualitative and quantitative aspects of the report. This includes background of Tesco and ratio
analysis of last five year performance.
Qualitative analysis
The financial performance of an entity will be analyzed with the application of
qualitative technique. This particular analysis will be focuses on using non-monetary
approach in which the background information of the business has used. The industry in
which the firm will be properly assessed in order to find out the trends currently followed by
the business operating in a particular industry. This information will help an individual in
order to improve the existing business of the corporation.
Background
Tesco has currently chosen for this project report which is regarded as British
multinational entity which deals in providing grocery and general merchandise products. This
entity is located in the centre of famous tourist destination in the whole world which is United
Kingdom (Nikolaou, Kourouklaris and Tsalis, 2014). This entity has ranked as 5th largest
retailer exists in the United Kingdom in order to cater needs and the expectations of its
variety of customers. This organisation has stores in over the world in almost 12 countries
worldwide. The stores of this entity has spread all across the world as it deals in various
products or services in order to enhance its wide number of customers in this business entity.
This firm is regarded as the global market leader who have overall market share of
28.4% among all the business sectors located in the overall retail industry. This business is
located in the retail industry which is famous industry which has higher market exposure in
relation to other industry sectors (Grant, 2016). This industry has lots of opportunities in
order to explore different sub unit’s lies in the retail sector. Recent study has been revealed
that higher amount of sales and the revenue will be generated by this particular industry. This
entity has contributed higher amount of revenue towards the economy of the United
Kingdom. This step taken by an enterprise will strengthen the overall business in relation to
its existing competitors. This organisation deals in different services offered by this particular
entity which shows its overall power and strength. Services offered by this entity involve
financial services, automobile services in order to achieve higher amount of profit from its
differently established business in various sectors in all across the world.
Strategic and effective decisions by this entity are of geographical diversification
method that emphasises on increasing brand value of all of its stores among its variety of
customers. Stores o this entity are centrally located which are bifurcated into various sub
units in the overall United Kingdom and different parts of the world. This organisation plays
a dominant position in the global supermarket in all around the world.
Page | 1
Paraphrase This Document
Need a fresh take? Get an instant paraphrase of this document with our AI Paraphraser
Stock price movements
Volatility is that component that enhances the brand image of the firm in relation to
its external market who are the competitors of this firm. The rival members of this business
concern will be reduced by suppressing their efforts in order to gain competitive advantage
over its variety of competitors (Chong, 2014). This organisation has also listed in the London
stock exchange centrally located in the United Kingdom which induces the current market
capture of this firm. Current business concern has listed in the famous stock exchange with
the constituent of FTSE 10 index which strengthen the existing business operated by this
particular firm in relation to its biggest competitor that is Sainsbury. The overall market
capitalisation value is all around 18.1 billion GBP which is enough amount of money hold as
security in the exchange which accompanies lot of risk along with higher market capture
gained currently by this enterprise. This firm stands at the stage of 28th largest company who
are listed in this stock exchange in order to raise their existing capital hold by the business in
relation to the higher risk achieved by the business.
Quantitative Analysis
This analysis will emphasise on the monetary tools and technique in which data is
collected in numerical form using mathematical expressions. Using numerical data it is
essential in order to check the accuracy of the overall data which is essential in order to
gather reliable data. The financial performance of the business like Tesco needs to be
analysed by collecting numerical data. The accuracy and authenticity of the collected data
will be assessed on the basis of ratio analysis. This technique is renamed as comparative
performance measures in order to test the reliability of the overall collected data for
conducting the study.
Ratio analysis
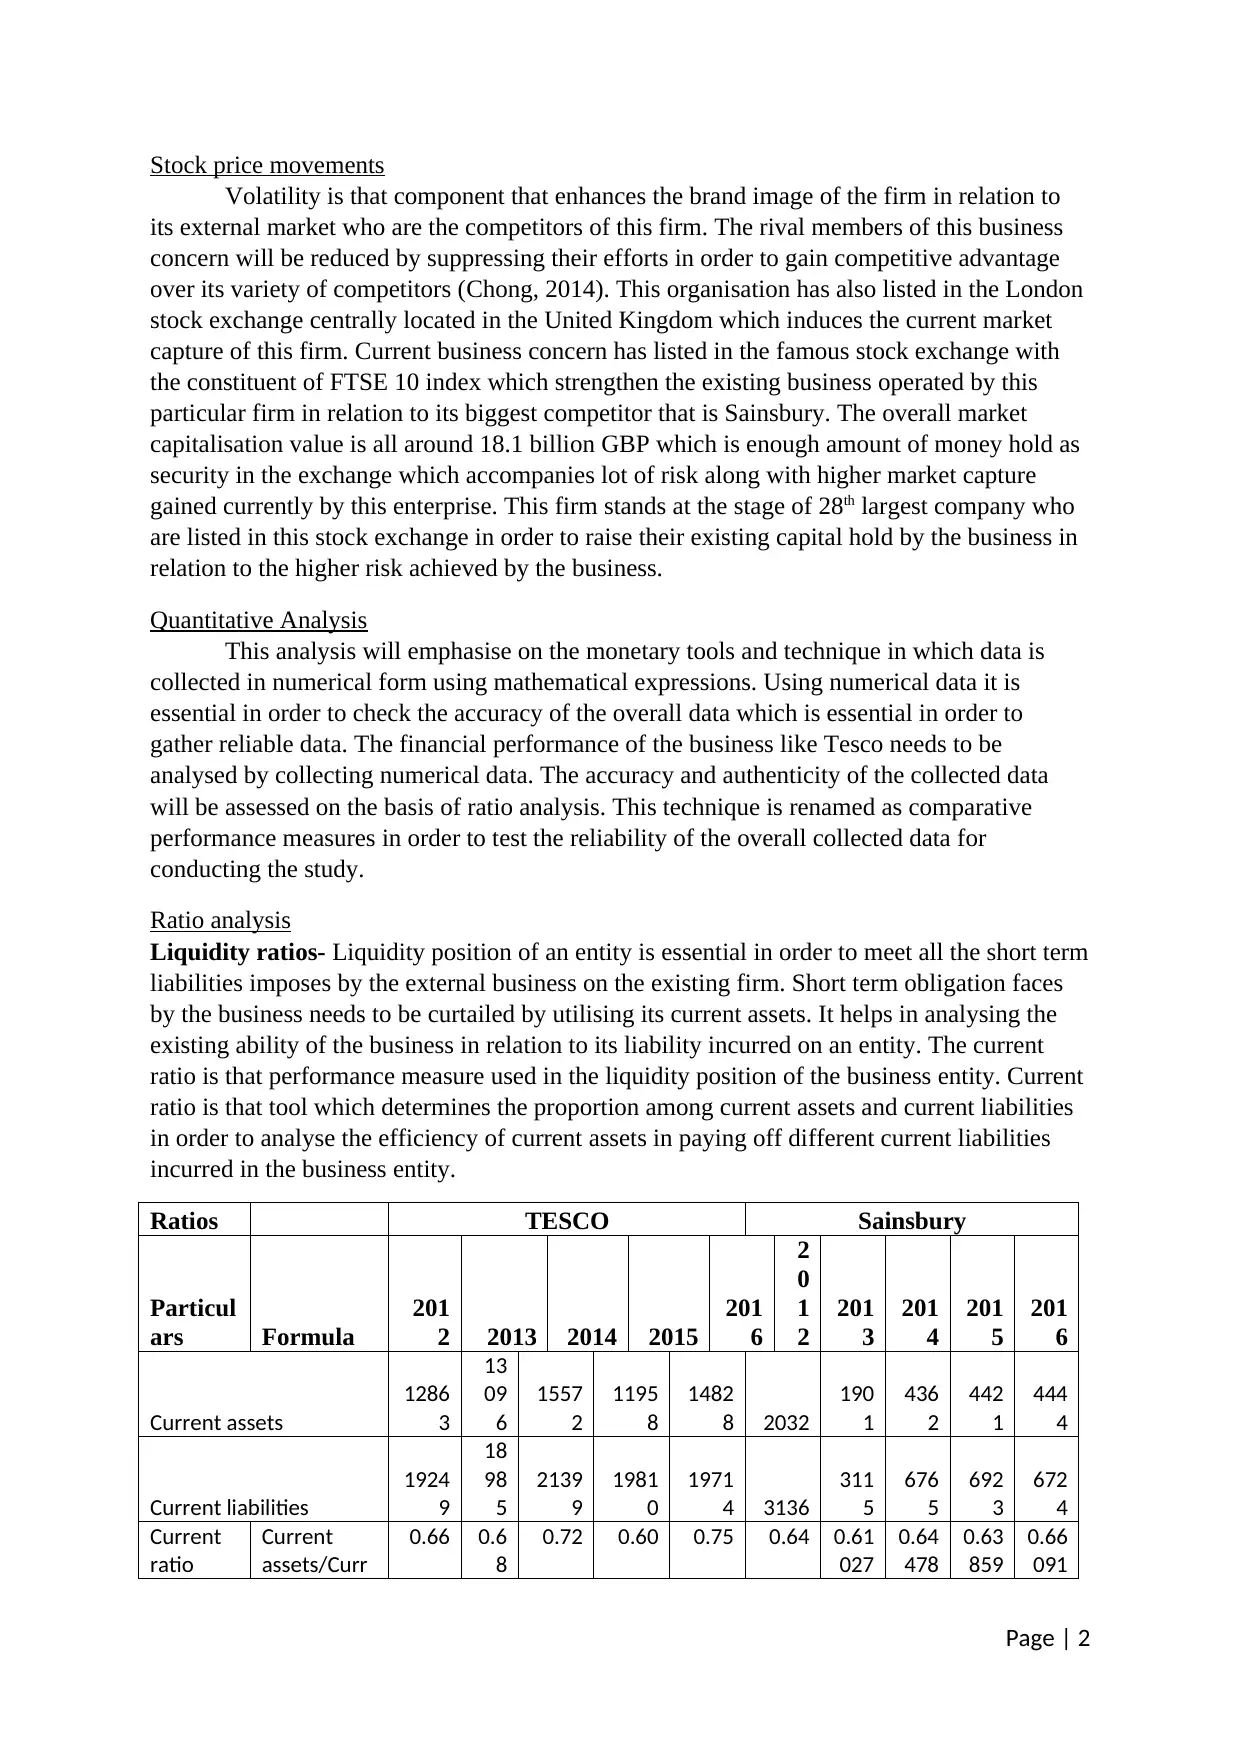
Liquidity ratios- Liquidity position of an entity is essential in order to meet all the short term
liabilities imposes by the external business on the existing firm. Short term obligation faces
by the business needs to be curtailed by utilising its current assets. It helps in analysing the
existing ability of the business in relation to its liability incurred on an entity. The current
ratio is that performance measure used in the liquidity position of the business entity. Current
ratio is that tool which determines the proportion among current assets and current liabilities
in order to analyse the efficiency of current assets in paying off different current liabilities
incurred in the business entity.
Ratios TESCO Sainsbury
Particul
ars Formula
201
2 2013 2014 2015
201
6
2
0
1
2
201
3
201
4
201
5
201
6
Current assets
1286
3
13
09
6
1557
2
1195
8
1482
8 2032
190
1
436
2
442
1
444
4
Current liabilities
1924
9
18
98
5
2139
9
1981
0
1971
4 3136
311
5
676
5
692
3
672
4
Current
ratio
Current
assets/Curr
0.66 0.6
8
0.72 0.60 0.75 0.64 0.61
027
0.64
478
0.63
859
0.66
091
Page | 2
Volatility is that component that enhances the brand image of the firm in relation to
its external market who are the competitors of this firm. The rival members of this business
concern will be reduced by suppressing their efforts in order to gain competitive advantage
over its variety of competitors (Chong, 2014). This organisation has also listed in the London
stock exchange centrally located in the United Kingdom which induces the current market
capture of this firm. Current business concern has listed in the famous stock exchange with
the constituent of FTSE 10 index which strengthen the existing business operated by this
particular firm in relation to its biggest competitor that is Sainsbury. The overall market
capitalisation value is all around 18.1 billion GBP which is enough amount of money hold as
security in the exchange which accompanies lot of risk along with higher market capture
gained currently by this enterprise. This firm stands at the stage of 28th largest company who
are listed in this stock exchange in order to raise their existing capital hold by the business in
relation to the higher risk achieved by the business.
Quantitative Analysis
This analysis will emphasise on the monetary tools and technique in which data is
collected in numerical form using mathematical expressions. Using numerical data it is
essential in order to check the accuracy of the overall data which is essential in order to
gather reliable data. The financial performance of the business like Tesco needs to be
analysed by collecting numerical data. The accuracy and authenticity of the collected data
will be assessed on the basis of ratio analysis. This technique is renamed as comparative
performance measures in order to test the reliability of the overall collected data for
conducting the study.
Ratio analysis
Liquidity ratios- Liquidity position of an entity is essential in order to meet all the short term
liabilities imposes by the external business on the existing firm. Short term obligation faces
by the business needs to be curtailed by utilising its current assets. It helps in analysing the
existing ability of the business in relation to its liability incurred on an entity. The current
ratio is that performance measure used in the liquidity position of the business entity. Current
ratio is that tool which determines the proportion among current assets and current liabilities
in order to analyse the efficiency of current assets in paying off different current liabilities
incurred in the business entity.
Ratios TESCO Sainsbury
Particul
ars Formula
201
2 2013 2014 2015
201
6
2
0
1
2
201
3
201
4
201
5
201
6
Current assets
1286
3
13
09
6
1557
2
1195
8
1482
8 2032
190
1
436
2
442
1
444
4
Current liabilities
1924
9
18
98
5
2139
9
1981
0
1971
4 3136
311
5
676
5
692
3
672
4
Current
ratio
Current
assets/Curr
0.66 0.6
8
0.72 0.60 0.75 0.64 0.61
027
0.64
478
0.63
859
0.66
091
Page | 2
ent
liabilities 3 9 6 6
Interpretations
It has been observed that current ratio of Tesco has been defined along with the ratios
of last five ear starting from 2012 to 2016 which shows specific trends of past five year trend
(Post and Byron, 2015). This trend will judge the performance of an entity which shows the
increment or decreasing amount of ratios from one period to another. The performance of
TESCO is increasing from year to year which shows good and strong position of an entity as
their current assets are higher as compared with the current liabilities incurred in their
business. On the other hand, the performance of this entity has compared with the
performance of Sainsbury shows that current ratio of Sainsbury is gradually increasing from
one year to another but this is not good enough in relation to Tesco’s performance.
Ratios TESCO Sainsbury
Partic
ulars Formula 2012 2013 2014
201
5 2016
201
2
201
3
201
4
201
5
201
6
Net sales 64539 64826 63557
6228
4 54433
222
94
233
03
239
49
237
775
235
06
Net profit 2806 124 974
-
5741 138 598 614 716
-
166 471
Net
profit
ratio
Net
profit/net
sales*100 4.34% 0.19% 0.01% -9% 0.2%
0.2
%
0.26
%
0.29
%
0.07
%
0.02
%
Total assets 50781 50129 50164
4421
4 43904
123
40
126
95
165
40
165
37
169
73
Return
on
assets
Total
assets/net
sales
0.039
62111
8
0.040
15639
6
0.040
14831
4
0.04
5573
8
0.045
91836
7
0.16
304
7
0.15
856
6
0.12
176
5
0.12
184
8
0.11
877
7
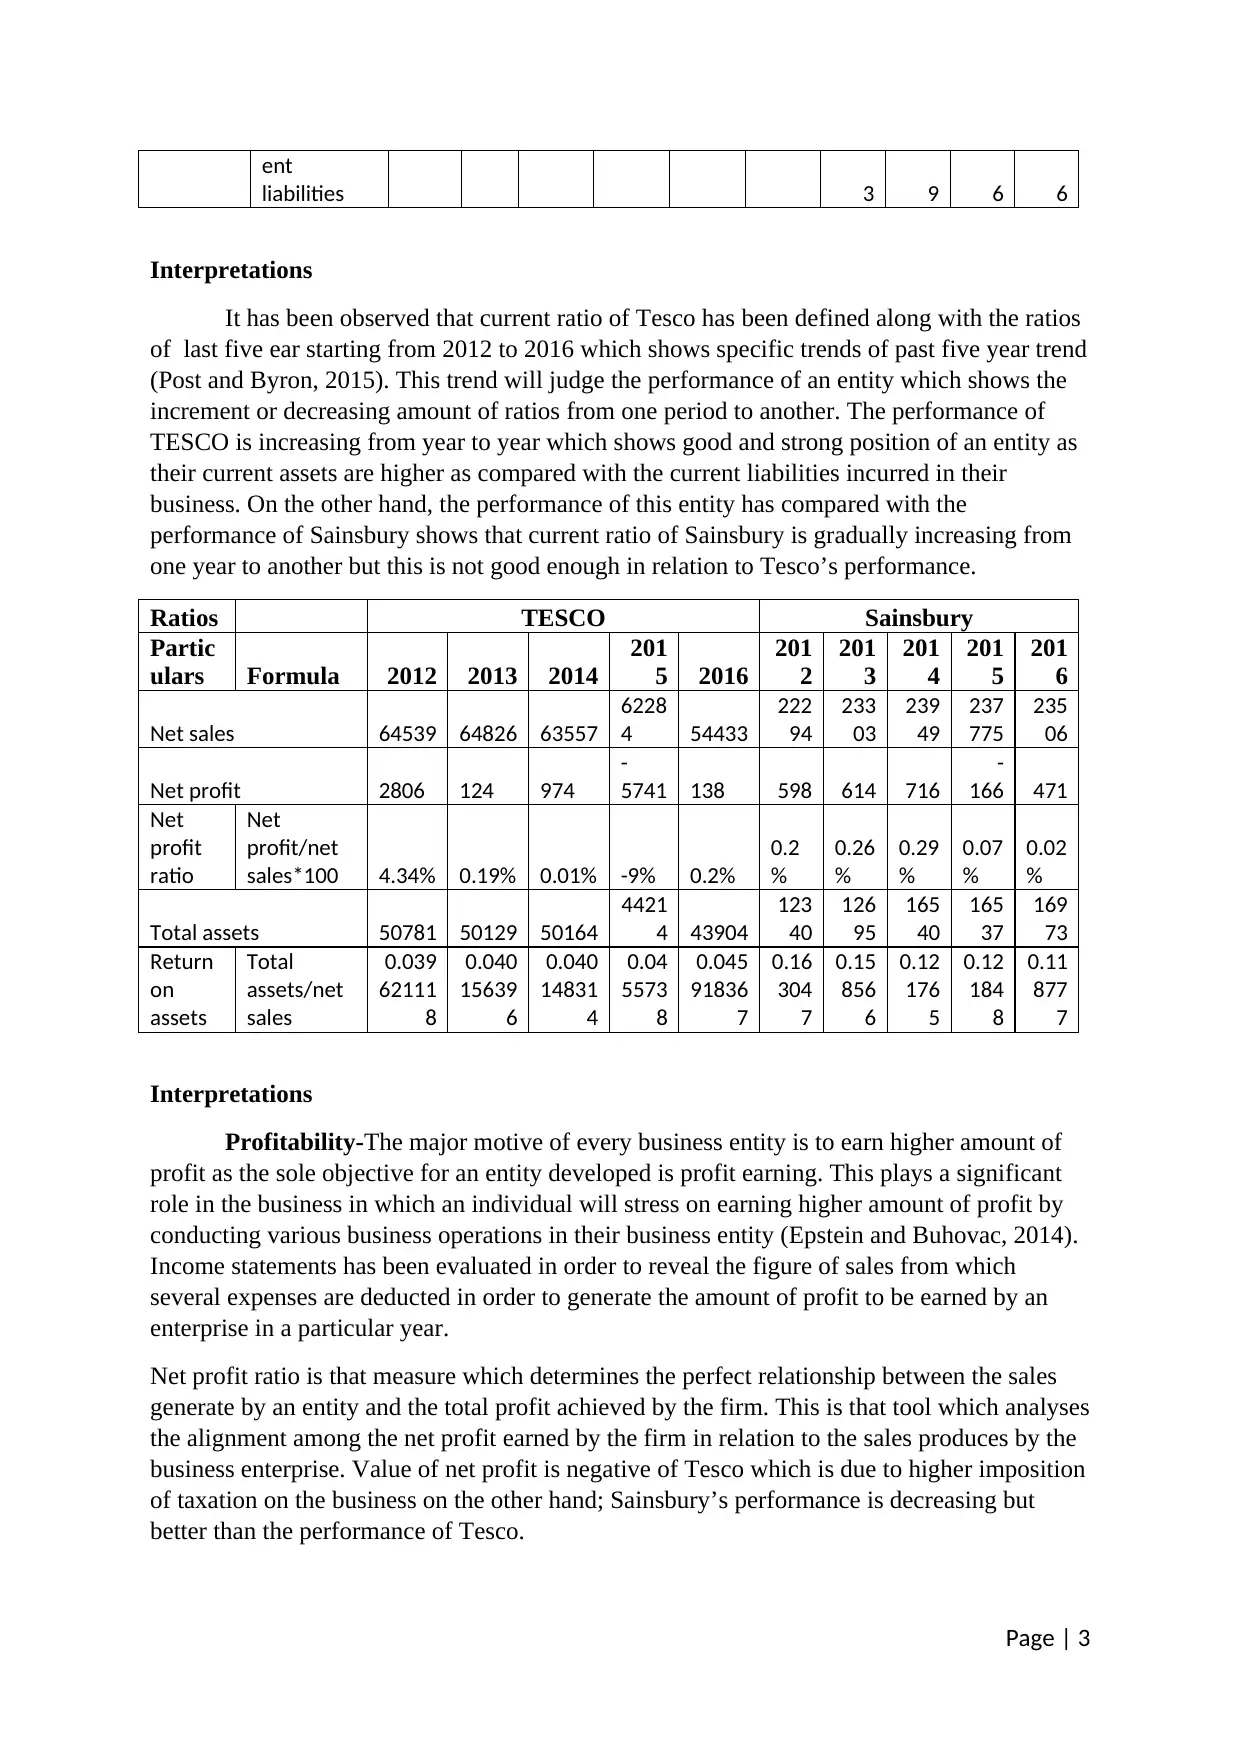
Interpretations
Profitability-The major motive of every business entity is to earn higher amount of
profit as the sole objective for an entity developed is profit earning. This plays a significant
role in the business in which an individual will stress on earning higher amount of profit by
conducting various business operations in their business entity (Epstein and Buhovac, 2014).
Income statements has been evaluated in order to reveal the figure of sales from which
several expenses are deducted in order to generate the amount of profit to be earned by an
enterprise in a particular year.
Net profit ratio is that measure which determines the perfect relationship between the sales
generate by an entity and the total profit achieved by the firm. This is that tool which analyses
the alignment among the net profit earned by the firm in relation to the sales produces by the
business enterprise. Value of net profit is negative of Tesco which is due to higher imposition
of taxation on the business on the other hand; Sainsbury’s performance is decreasing but
better than the performance of Tesco.
Page | 3
liabilities 3 9 6 6
Interpretations
It has been observed that current ratio of Tesco has been defined along with the ratios
of last five ear starting from 2012 to 2016 which shows specific trends of past five year trend
(Post and Byron, 2015). This trend will judge the performance of an entity which shows the
increment or decreasing amount of ratios from one period to another. The performance of
TESCO is increasing from year to year which shows good and strong position of an entity as
their current assets are higher as compared with the current liabilities incurred in their
business. On the other hand, the performance of this entity has compared with the
performance of Sainsbury shows that current ratio of Sainsbury is gradually increasing from
one year to another but this is not good enough in relation to Tesco’s performance.
Ratios TESCO Sainsbury
Partic
ulars Formula 2012 2013 2014
201
5 2016
201
2
201
3
201
4
201
5
201
6
Net sales 64539 64826 63557
6228
4 54433
222
94
233
03
239
49
237
775
235
06
Net profit 2806 124 974
-
5741 138 598 614 716
-
166 471
Net
profit
ratio
Net
profit/net
sales*100 4.34% 0.19% 0.01% -9% 0.2%
0.2
%
0.26
%
0.29
%
0.07
%
0.02
%
Total assets 50781 50129 50164
4421
4 43904
123
40
126
95
165
40
165
37
169
73
Return
on
assets
Total
assets/net
sales
0.039
62111
8
0.040
15639
6
0.040
14831
4
0.04
5573
8
0.045
91836
7
0.16
304
7
0.15
856
6
0.12
176
5
0.12
184
8
0.11
877
7
Interpretations
Profitability-The major motive of every business entity is to earn higher amount of
profit as the sole objective for an entity developed is profit earning. This plays a significant
role in the business in which an individual will stress on earning higher amount of profit by
conducting various business operations in their business entity (Epstein and Buhovac, 2014).
Income statements has been evaluated in order to reveal the figure of sales from which
several expenses are deducted in order to generate the amount of profit to be earned by an
enterprise in a particular year.
Net profit ratio is that measure which determines the perfect relationship between the sales
generate by an entity and the total profit achieved by the firm. This is that tool which analyses
the alignment among the net profit earned by the firm in relation to the sales produces by the
business enterprise. Value of net profit is negative of Tesco which is due to higher imposition
of taxation on the business on the other hand; Sainsbury’s performance is decreasing but
better than the performance of Tesco.
Page | 3
⊘ This is a preview!⊘
Do you want full access?
Subscribe today to unlock all pages.
Trusted by 1+ million students worldwide
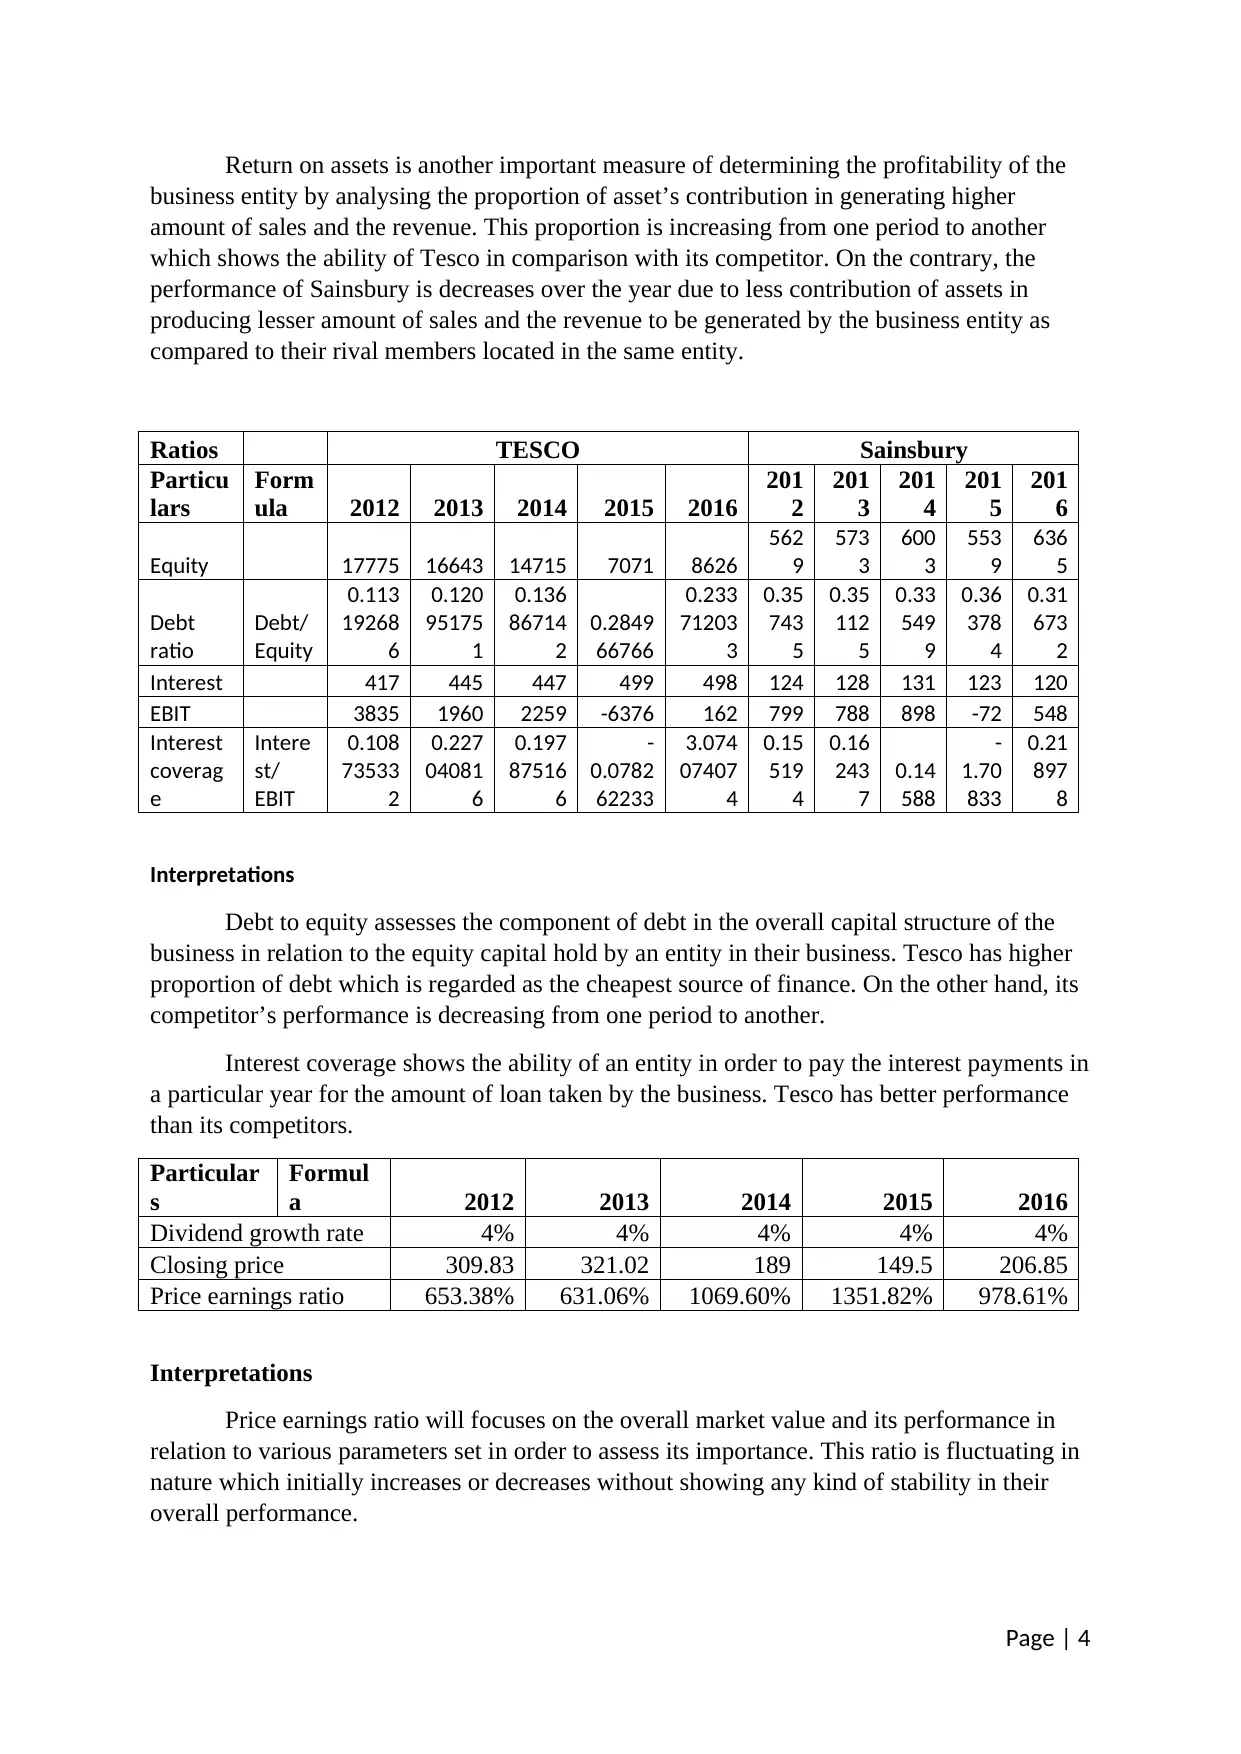
Return on assets is another important measure of determining the profitability of the
business entity by analysing the proportion of asset’s contribution in generating higher
amount of sales and the revenue. This proportion is increasing from one period to another
which shows the ability of Tesco in comparison with its competitor. On the contrary, the
performance of Sainsbury is decreases over the year due to less contribution of assets in
producing lesser amount of sales and the revenue to be generated by the business entity as
compared to their rival members located in the same entity.
Ratios TESCO Sainsbury
Particu
lars
Form
ula 2012 2013 2014 2015 2016
201
2
201
3
201
4
201
5
201
6
Equity 17775 16643 14715 7071 8626
562
9
573
3
600
3
553
9
636
5
Debt
ratio
Debt/
Equity
0.113
19268
6
0.120
95175
1
0.136
86714
2
0.2849
66766
0.233
71203
3
0.35
743
5
0.35
112
5
0.33
549
9
0.36
378
4
0.31
673
2
Interest 417 445 447 499 498 124 128 131 123 120
EBIT 3835 1960 2259 -6376 162 799 788 898 -72 548
Interest
coverag
e
Intere
st/
EBIT
0.108
73533
2
0.227
04081
6
0.197
87516
6
-
0.0782
62233
3.074
07407
4
0.15
519
4
0.16
243
7
0.14
588
-
1.70
833
0.21
897
8
Interpretations
Debt to equity assesses the component of debt in the overall capital structure of the
business in relation to the equity capital hold by an entity in their business. Tesco has higher
proportion of debt which is regarded as the cheapest source of finance. On the other hand, its
competitor’s performance is decreasing from one period to another.
Interest coverage shows the ability of an entity in order to pay the interest payments in
a particular year for the amount of loan taken by the business. Tesco has better performance
than its competitors.
Particular
s
Formul
a 2012 2013 2014 2015 2016
Dividend growth rate 4% 4% 4% 4% 4%
Closing price 309.83 321.02 189 149.5 206.85
Price earnings ratio 653.38% 631.06% 1069.60% 1351.82% 978.61%
Interpretations
Price earnings ratio will focuses on the overall market value and its performance in
relation to various parameters set in order to assess its importance. This ratio is fluctuating in
nature which initially increases or decreases without showing any kind of stability in their
overall performance.
Page | 4
Paraphrase This Document
Need a fresh take? Get an instant paraphrase of this document with our AI Paraphraser
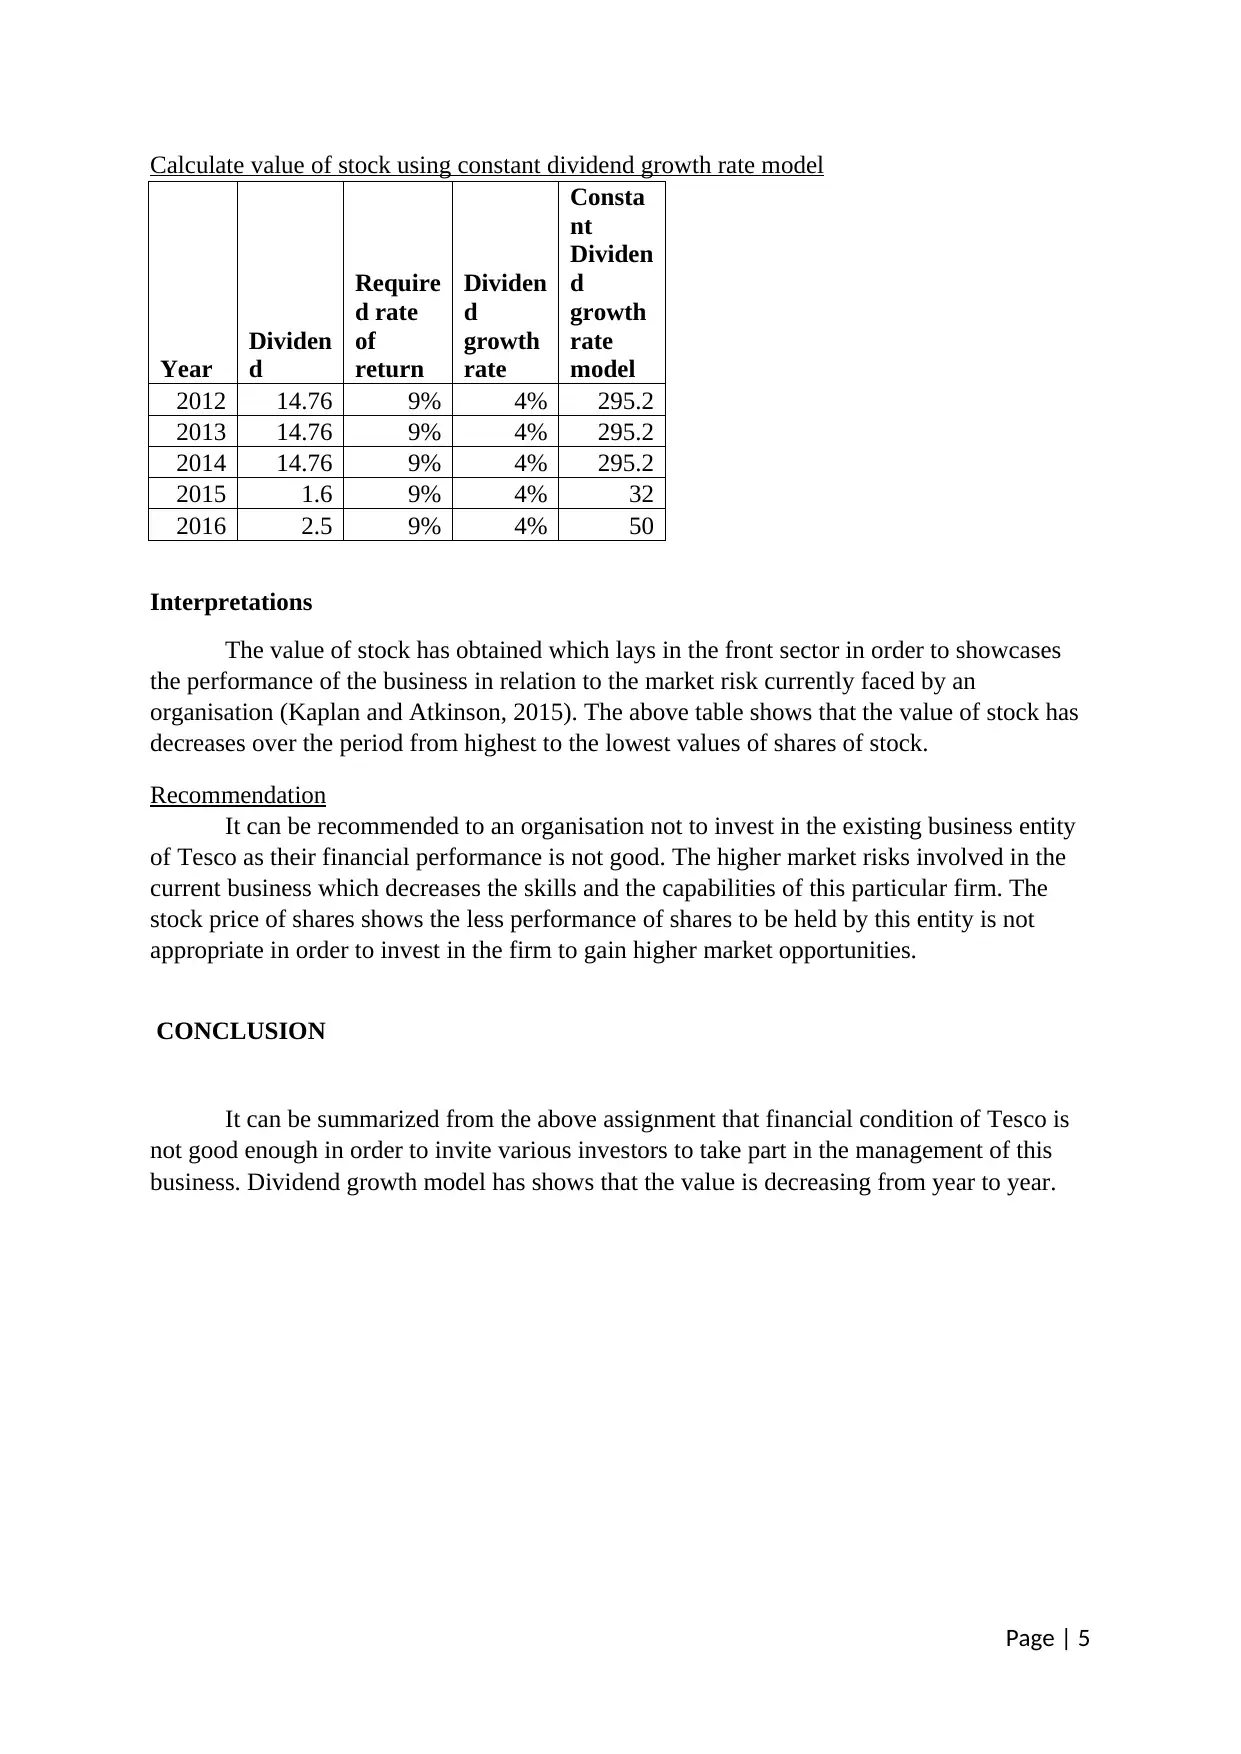
Calculate value of stock using constant dividend growth rate model
Year
Dividen
d
Require
d rate
of
return
Dividen
d
growth
rate
Consta
nt
Dividen
d
growth
rate
model
2012 14.76 9% 4% 295.2
2013 14.76 9% 4% 295.2
2014 14.76 9% 4% 295.2
2015 1.6 9% 4% 32
2016 2.5 9% 4% 50
Interpretations
The value of stock has obtained which lays in the front sector in order to showcases
the performance of the business in relation to the market risk currently faced by an
organisation (Kaplan and Atkinson, 2015). The above table shows that the value of stock has
decreases over the period from highest to the lowest values of shares of stock.
Recommendation
It can be recommended to an organisation not to invest in the existing business entity
of Tesco as their financial performance is not good. The higher market risks involved in the
current business which decreases the skills and the capabilities of this particular firm. The
stock price of shares shows the less performance of shares to be held by this entity is not
appropriate in order to invest in the firm to gain higher market opportunities.
CONCLUSION
It can be summarized from the above assignment that financial condition of Tesco is
not good enough in order to invite various investors to take part in the management of this
business. Dividend growth model has shows that the value is decreasing from year to year.
Page | 5
References list
Kaplan, R. S. and Atkinson, A. A., 2015. Advanced management accounting. PHI Learning.
Epstein, M. J. and Buhovac, A. R., 2014. Making sustainability work: Best practices in
managing and measuring corporate social, environmental, and economic impacts. Berrett-
Koehler Publishers.
Post, C. and Byron, K., 2015. Women on boards and firm financial performance: A meta-
analysis. Academy of Management Journal. 58(5). pp.1546-1571.
Chong, S., 2014. Business process management for SMEs: an exploratory study of
implementation factors for the Australian wine industry. Journal of Information Systems
and Small Business. 1(1-2). pp.41-58.
Grant, R. M., 2016. Contemporary strategy analysis: Text and cases edition. John Wiley &
Sons.
Baños-Caballero, S., García-Teruel, P. J. and Martínez-Solano, P., 2014. Working capital
management, corporate performance, and financial constraints. Journal of Business
Research, 67(3). pp.332-338.
Nikolaou, I.E., Kourouklaris, G. and Tsalis, T. A., 2014. A framework to assist the financial
community in incorporating water risks into their investment decisions. Journal of
Sustainable Finance & Investment. 4(2). pp.93-109.
Abdelhak, M., Grostick, S. and Hanken, M.A., 2014. Health information: management of a
strategic resource. Elsevier Health Sciences.
Grimm, J.H., Hofstetter, J.S. and Sarkis, J., 2014. Critical factors for sub-supplier
management: A sustainable food supply chains perspective. International Journal of
Production Economics. 152. pp.159-173.
Joshi, O., Grebner, D. L., Munn, I. A. and Grala, R. K., 2015. Issues concerning landowner
management plan adoption decisions: a recursive bivariate probit approach. International
Journal of Forestry Research, 2015.
Page | 6
⊘ This is a preview!⊘
Do you want full access?
Subscribe today to unlock all pages.
Trusted by 1+ million students worldwide
1 out of 9
Related Documents


Your All-in-One AI-Powered Toolkit for Academic Success.
+13062052269
info@desklib.com
Available 24*7 on WhatsApp / Email
![[object Object]](/_next/static/media/star-bottom.7253800d.svg)
Unlock your academic potential
Copyright © 2020–2026 A2Z Services. All Rights Reserved. Developed and managed by ZUCOL.