FIN 601: Financial Analysis of Tesco Plc and Sainsbury Plc
VerifiedAdded on 2022/08/31
|15
|2889
|30
Report
AI Summary
This report presents a comprehensive financial analysis of Tesco Plc over a four-year period, comparing its performance against its competitor, Sainsbury Plc. The analysis encompasses key financial aspects, including liquidity, debt, activity, profitability, and market value ratios. The report evaluates the trends in these ratios to assess the company's financial health and provides insights from an investor's perspective. Furthermore, the study offers recommendations based on the financial performance, with a focus on areas for improvement and strategic considerations. The analysis includes the financial performance of Tesco Plc over the past four years, comparing its performance with Sainsbury Plc. The report includes ratio analysis, trend analysis, and movement in ratios from an investor's viewpoint, leading to conclusions and recommendations for the company's financial strategy.
Running head: FINANCIAL MANAGEMENT PRINCIPLES
Financial management principles
Name of the student
Name of the university
Student ID
Author note
Financial management principles
Name of the student
Name of the university
Student ID
Author note
Paraphrase This Document
Need a fresh take? Get an instant paraphrase of this document with our AI Paraphraser
1FINANCIAL MANAGEMENT PRINCIPLES
Executive summary
Purpose of the task is to concentrate on the financial performance of Tesco Plc over the past 4
years and compare the performance of latest year with its major competitor Sainsbury Plc. For
analysing the financial performance the task will cover the liquidity position, debt position,
activity status, profitability position and market position of the entity’s shares. The task will
further carry out the trend analysis to evaluate the trend of performance over the last 4 years and
trend for the ratios from the investor’s view point. Finally, in accordance with the performance
the task will recommend required suggestion.
2FINANCIAL MANAGEMENT PRINCIPLES
Table of Contents
Section A.........................................................................................................................................3
Introduction......................................................................................................................................3
Ratio analysis...................................................................................................................................4
(i) Comparing financial position over past 4 years...................................................................4
(ii) Comparing Tesco Plc’s performance against Sainsbury Plc............................................6
Trend analysis..................................................................................................................................7
Movement in ratios..........................................................................................................................8
Conclusion and recommendation....................................................................................................9
Reference.......................................................................................................................................10
Appendix........................................................................................................................................12
Section B........................................................................................................................................14
Problem 2.......................................................................................................................................14
⊘ This is a preview!⊘
Do you want full access?
Subscribe today to unlock all pages.
Trusted by 1+ million students worldwide
3FINANCIAL MANAGEMENT PRINCIPLES
Section A
Introduction
Tesco Plc is considered among leading retailers within the UK retail industry and is one
of the largest retailers in food sector around the world. The entity was established in the year
1919 with a grocery store and expended into market consequently along with wide range of retail
services including travel agency, telecom, financial, insurance and other associated products. It
has influential business for petrol retailing. However the organization is present predominantly
within the supermarket as well as hypermarket that have been diversified widely through re-
evaluation period (Tesco PLC 2020).
Considering the financial performance of the entity over the last 4 years it can be stated
that the sales revenue of the entity are in increasing trends and reached to £56,883 million in
2019 against £47,859 million in 2016. In the same way the net profit of the entity has been
reached to £1320 million in 2019 against £129 million in 2016. The entity was further able to
reduce its indebtedness to £12,200 million in 2019 from £15,536 in 2016. In 2017 the entity
decided to sell the Turkey operations and hence the same treated as discontinued since 2017. It
has determined that new segment the new segments as well as defined measures of new non-
GAAP since 2015/16 onwards. During 2018 the entity reassessed the reportable segments and
established that retailing as well as associated activities those were disclosed previously inside
international segment shall be differentiated among Asia segment and Central Europe (Tesco
PLC 2020).
Paraphrase This Document
Need a fresh take? Get an instant paraphrase of this document with our AI Paraphraser
4FINANCIAL MANAGEMENT PRINCIPLES
Ratio analysis
(i) Comparing financial position over past 4 years
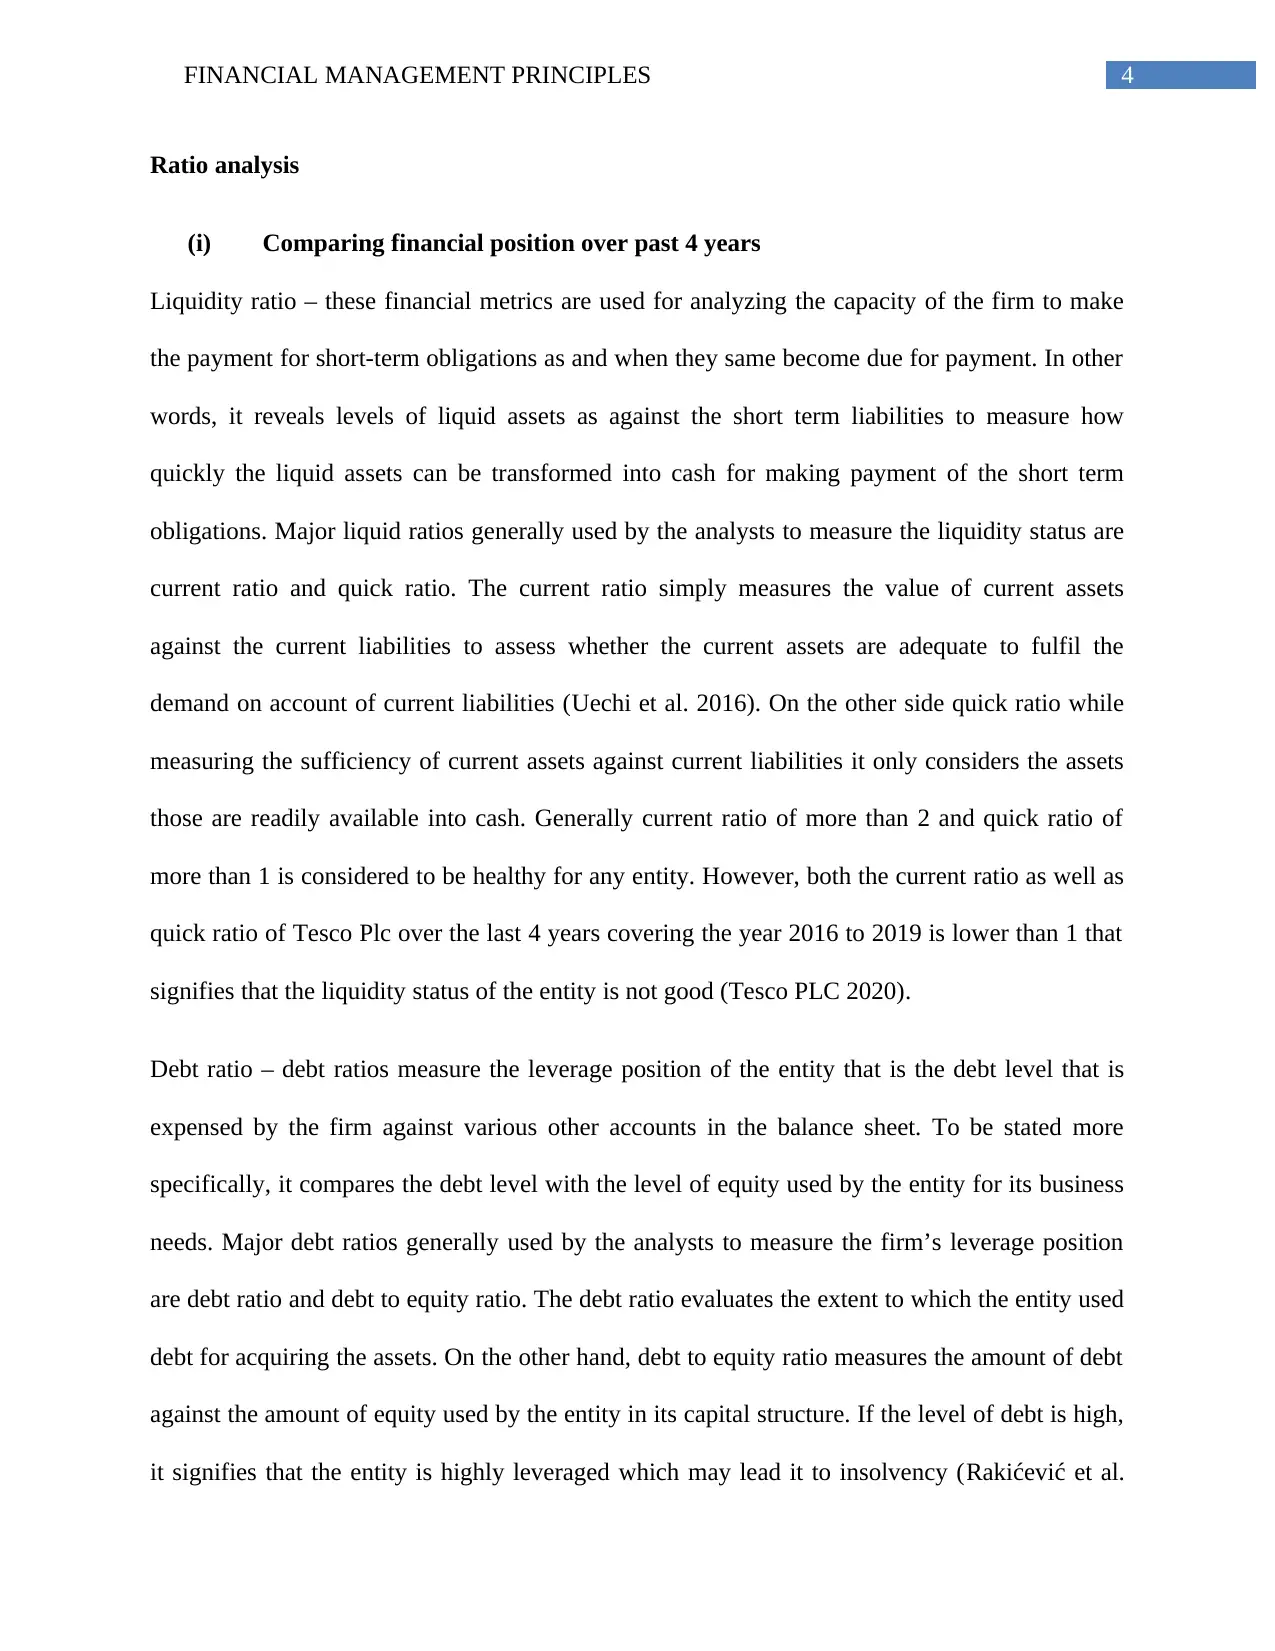
Liquidity ratio – these financial metrics are used for analyzing the capacity of the firm to make
the payment for short-term obligations as and when they same become due for payment. In other
words, it reveals levels of liquid assets as against the short term liabilities to measure how
quickly the liquid assets can be transformed into cash for making payment of the short term
obligations. Major liquid ratios generally used by the analysts to measure the liquidity status are
current ratio and quick ratio. The current ratio simply measures the value of current assets
against the current liabilities to assess whether the current assets are adequate to fulfil the
demand on account of current liabilities (Uechi et al. 2016). On the other side quick ratio while
measuring the sufficiency of current assets against current liabilities it only considers the assets
those are readily available into cash. Generally current ratio of more than 2 and quick ratio of
more than 1 is considered to be healthy for any entity. However, both the current ratio as well as
quick ratio of Tesco Plc over the last 4 years covering the year 2016 to 2019 is lower than 1 that
signifies that the liquidity status of the entity is not good (Tesco PLC 2020).
Debt ratio – debt ratios measure the leverage position of the entity that is the debt level that is
expensed by the firm against various other accounts in the balance sheet. To be stated more
specifically, it compares the debt level with the level of equity used by the entity for its business
needs. Major debt ratios generally used by the analysts to measure the firm’s leverage position
are debt ratio and debt to equity ratio. The debt ratio evaluates the extent to which the entity used
debt for acquiring the assets. On the other hand, debt to equity ratio measures the amount of debt
against the amount of equity used by the entity in its capital structure. If the level of debt is high,
it signifies that the entity is highly leveraged which may lead it to insolvency (Rakićević et al.
Ratio analysis
(i) Comparing financial position over past 4 years
Liquidity ratio – these financial metrics are used for analyzing the capacity of the firm to make
the payment for short-term obligations as and when they same become due for payment. In other
words, it reveals levels of liquid assets as against the short term liabilities to measure how
quickly the liquid assets can be transformed into cash for making payment of the short term
obligations. Major liquid ratios generally used by the analysts to measure the liquidity status are
current ratio and quick ratio. The current ratio simply measures the value of current assets
against the current liabilities to assess whether the current assets are adequate to fulfil the
demand on account of current liabilities (Uechi et al. 2016). On the other side quick ratio while
measuring the sufficiency of current assets against current liabilities it only considers the assets
those are readily available into cash. Generally current ratio of more than 2 and quick ratio of
more than 1 is considered to be healthy for any entity. However, both the current ratio as well as
quick ratio of Tesco Plc over the last 4 years covering the year 2016 to 2019 is lower than 1 that
signifies that the liquidity status of the entity is not good (Tesco PLC 2020).
Debt ratio – debt ratios measure the leverage position of the entity that is the debt level that is
expensed by the firm against various other accounts in the balance sheet. To be stated more
specifically, it compares the debt level with the level of equity used by the entity for its business
needs. Major debt ratios generally used by the analysts to measure the firm’s leverage position
are debt ratio and debt to equity ratio. The debt ratio evaluates the extent to which the entity used
debt for acquiring the assets. On the other hand, debt to equity ratio measures the amount of debt
against the amount of equity used by the entity in its capital structure. If the level of debt is high,
it signifies that the entity is highly leveraged which may lead it to insolvency (Rakićević et al.
5FINANCIAL MANAGEMENT PRINCIPLES
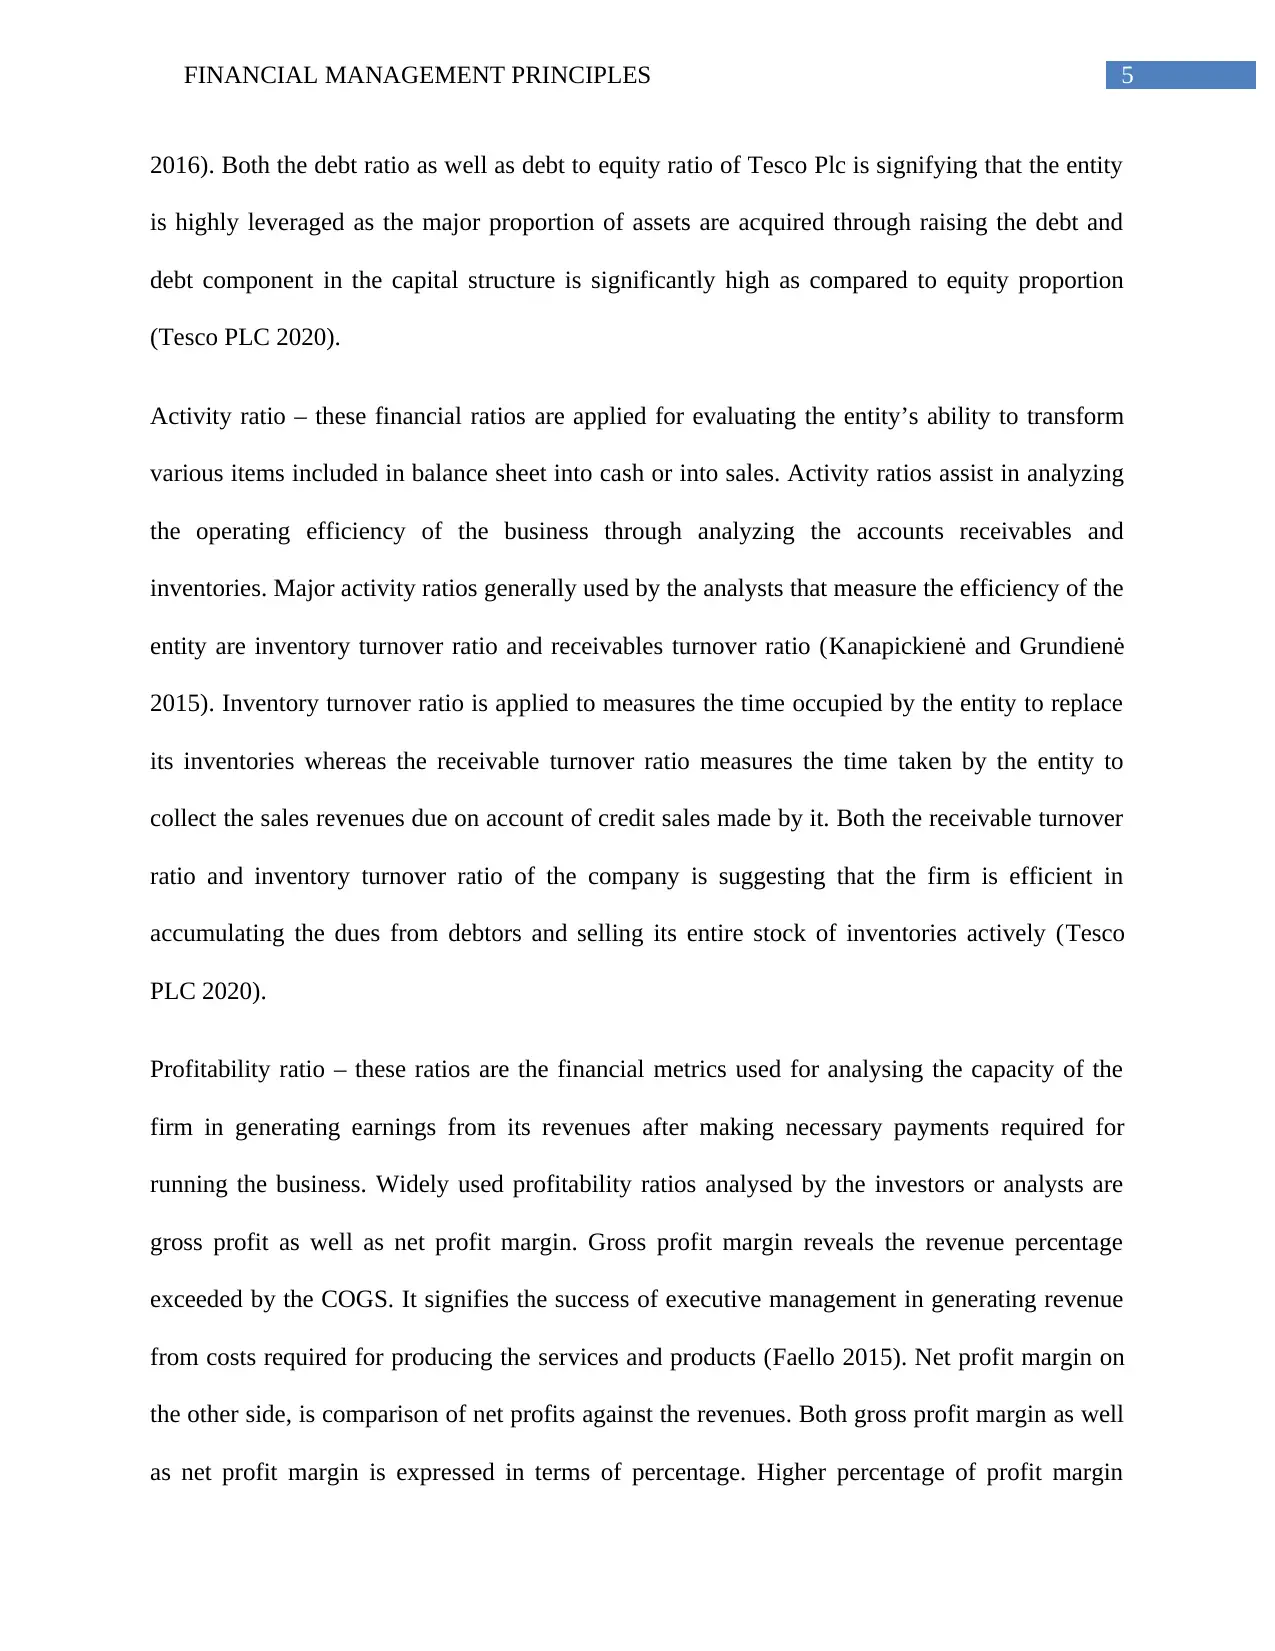
2016). Both the debt ratio as well as debt to equity ratio of Tesco Plc is signifying that the entity
is highly leveraged as the major proportion of assets are acquired through raising the debt and
debt component in the capital structure is significantly high as compared to equity proportion
(Tesco PLC 2020).
Activity ratio – these financial ratios are applied for evaluating the entity’s ability to transform
various items included in balance sheet into cash or into sales. Activity ratios assist in analyzing
the operating efficiency of the business through analyzing the accounts receivables and
inventories. Major activity ratios generally used by the analysts that measure the efficiency of the
entity are inventory turnover ratio and receivables turnover ratio (Kanapickienė and Grundienė
2015). Inventory turnover ratio is applied to measures the time occupied by the entity to replace
its inventories whereas the receivable turnover ratio measures the time taken by the entity to
collect the sales revenues due on account of credit sales made by it. Both the receivable turnover
ratio and inventory turnover ratio of the company is suggesting that the firm is efficient in
accumulating the dues from debtors and selling its entire stock of inventories actively (Tesco
PLC 2020).
Profitability ratio – these ratios are the financial metrics used for analysing the capacity of the
firm in generating earnings from its revenues after making necessary payments required for
running the business. Widely used profitability ratios analysed by the investors or analysts are
gross profit as well as net profit margin. Gross profit margin reveals the revenue percentage
exceeded by the COGS. It signifies the success of executive management in generating revenue
from costs required for producing the services and products (Faello 2015). Net profit margin on
the other side, is comparison of net profits against the revenues. Both gross profit margin as well
as net profit margin is expressed in terms of percentage. Higher percentage of profit margin
⊘ This is a preview!⊘
Do you want full access?
Subscribe today to unlock all pages.
Trusted by 1+ million students worldwide
6FINANCIAL MANAGEMENT PRINCIPLES
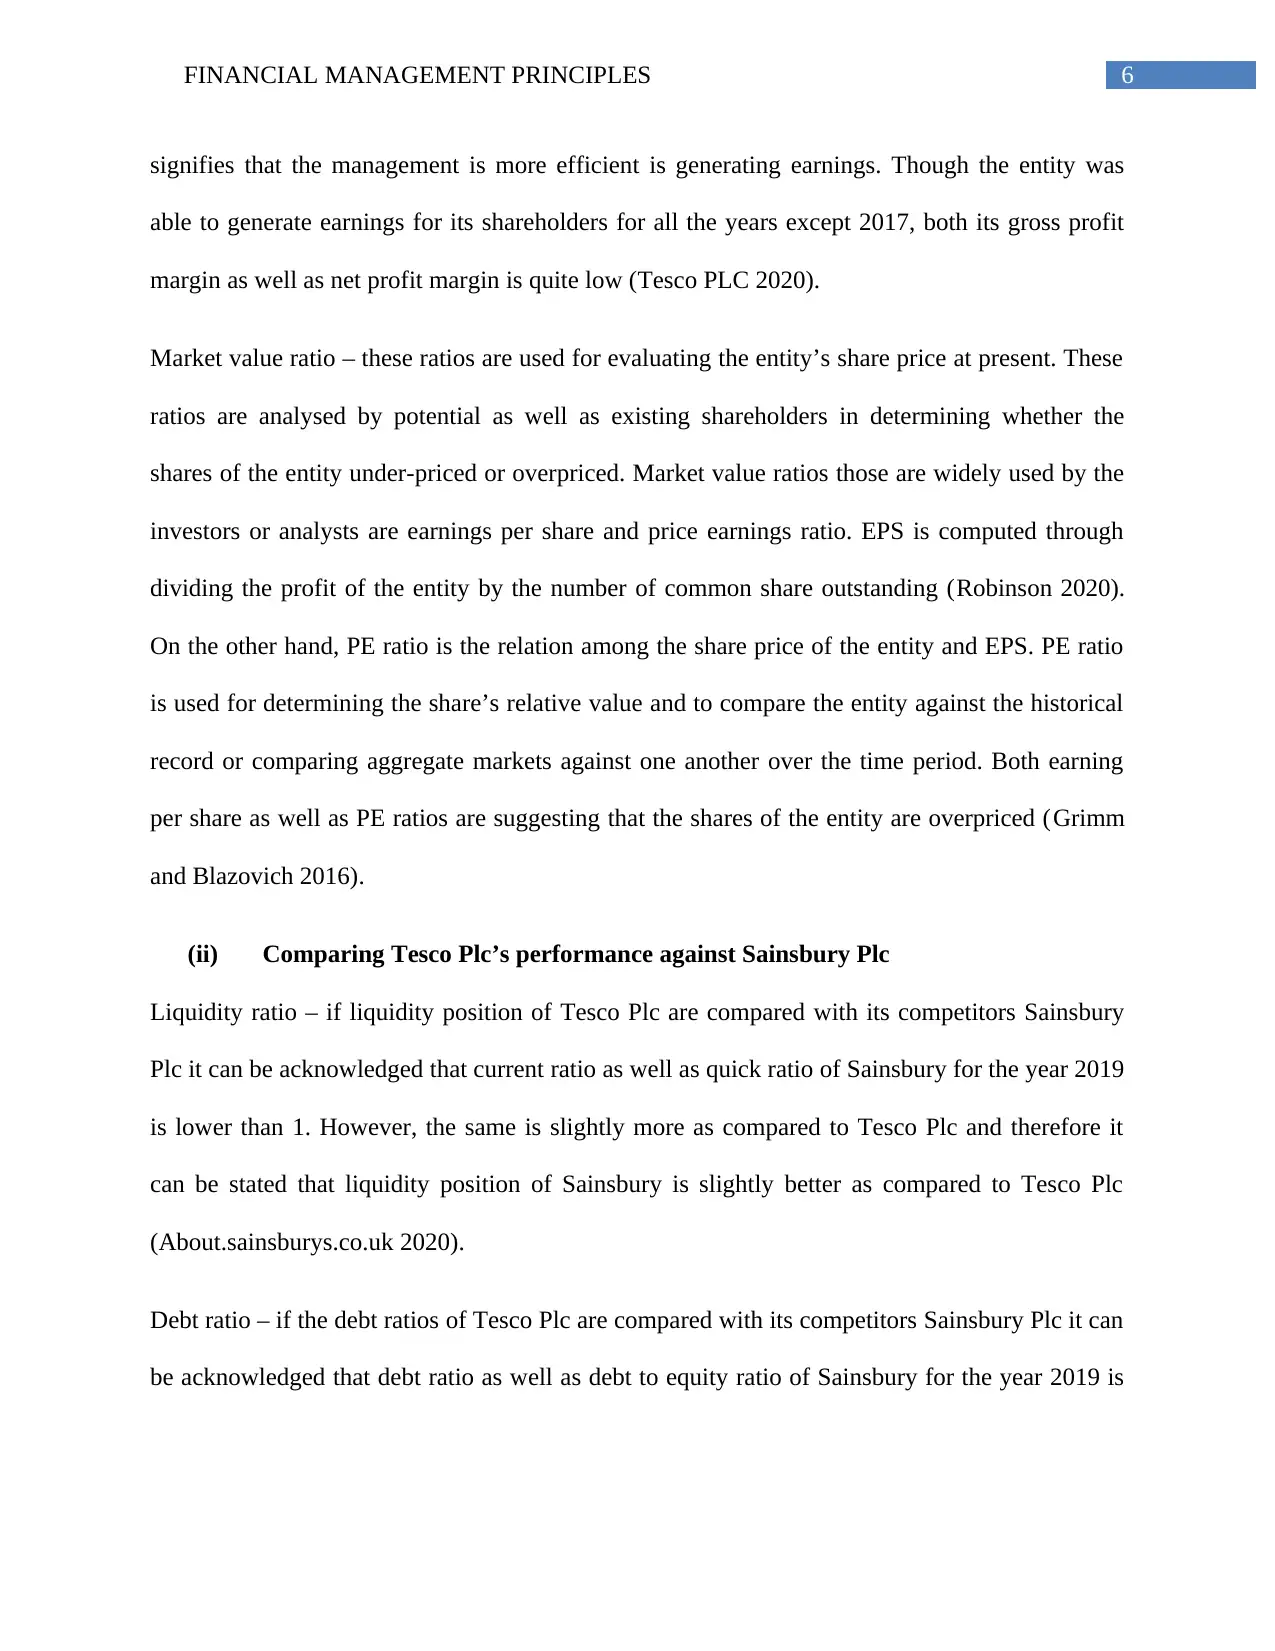
signifies that the management is more efficient is generating earnings. Though the entity was
able to generate earnings for its shareholders for all the years except 2017, both its gross profit
margin as well as net profit margin is quite low (Tesco PLC 2020).
Market value ratio – these ratios are used for evaluating the entity’s share price at present. These
ratios are analysed by potential as well as existing shareholders in determining whether the
shares of the entity under-priced or overpriced. Market value ratios those are widely used by the
investors or analysts are earnings per share and price earnings ratio. EPS is computed through
dividing the profit of the entity by the number of common share outstanding (Robinson 2020).
On the other hand, PE ratio is the relation among the share price of the entity and EPS. PE ratio
is used for determining the share’s relative value and to compare the entity against the historical
record or comparing aggregate markets against one another over the time period. Both earning
per share as well as PE ratios are suggesting that the shares of the entity are overpriced (Grimm
and Blazovich 2016).
(ii) Comparing Tesco Plc’s performance against Sainsbury Plc
Liquidity ratio – if liquidity position of Tesco Plc are compared with its competitors Sainsbury
Plc it can be acknowledged that current ratio as well as quick ratio of Sainsbury for the year 2019
is lower than 1. However, the same is slightly more as compared to Tesco Plc and therefore it
can be stated that liquidity position of Sainsbury is slightly better as compared to Tesco Plc
(About.sainsburys.co.uk 2020).
Debt ratio – if the debt ratios of Tesco Plc are compared with its competitors Sainsbury Plc it can
be acknowledged that debt ratio as well as debt to equity ratio of Sainsbury for the year 2019 is
Paraphrase This Document
Need a fresh take? Get an instant paraphrase of this document with our AI Paraphraser
7FINANCIAL MANAGEMENT PRINCIPLES
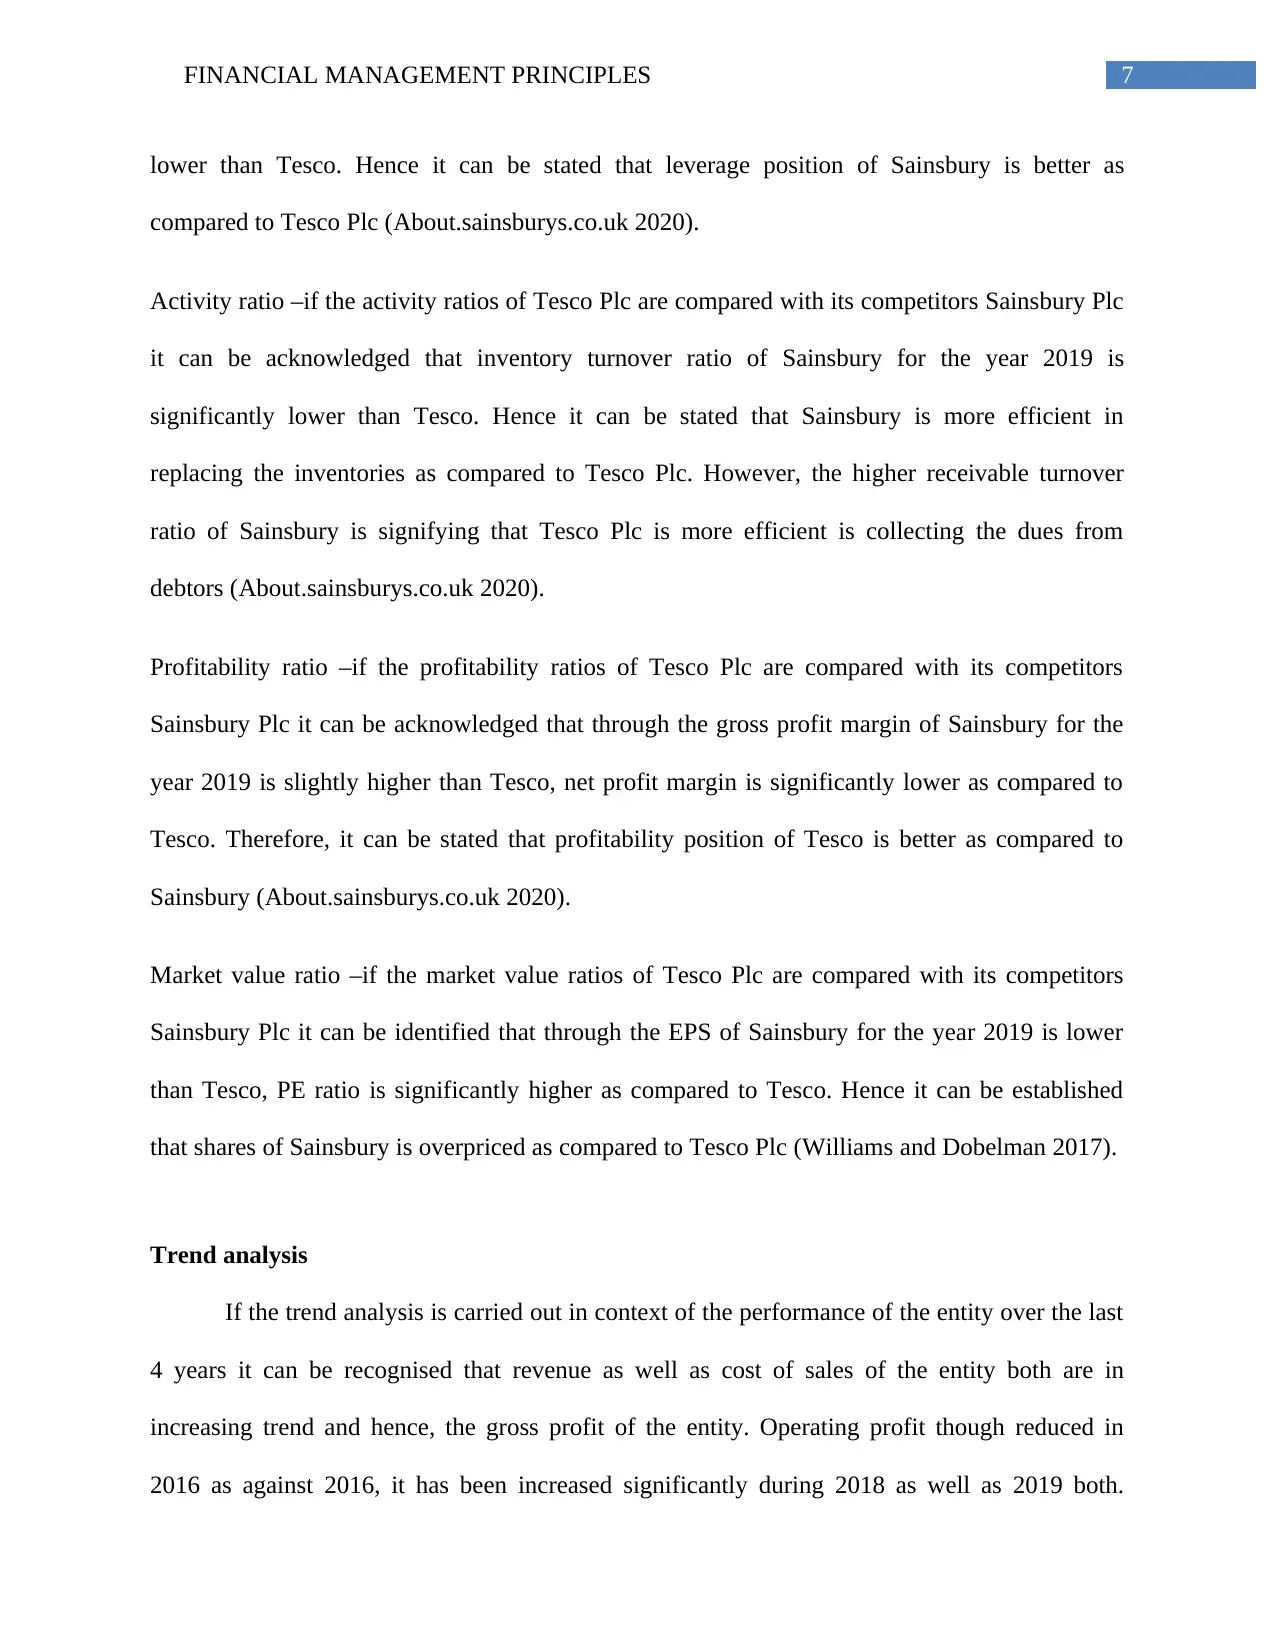
lower than Tesco. Hence it can be stated that leverage position of Sainsbury is better as
compared to Tesco Plc (About.sainsburys.co.uk 2020).
Activity ratio –if the activity ratios of Tesco Plc are compared with its competitors Sainsbury Plc
it can be acknowledged that inventory turnover ratio of Sainsbury for the year 2019 is
significantly lower than Tesco. Hence it can be stated that Sainsbury is more efficient in
replacing the inventories as compared to Tesco Plc. However, the higher receivable turnover
ratio of Sainsbury is signifying that Tesco Plc is more efficient is collecting the dues from
debtors (About.sainsburys.co.uk 2020).
Profitability ratio –if the profitability ratios of Tesco Plc are compared with its competitors
Sainsbury Plc it can be acknowledged that through the gross profit margin of Sainsbury for the
year 2019 is slightly higher than Tesco, net profit margin is significantly lower as compared to
Tesco. Therefore, it can be stated that profitability position of Tesco is better as compared to
Sainsbury (About.sainsburys.co.uk 2020).
Market value ratio –if the market value ratios of Tesco Plc are compared with its competitors
Sainsbury Plc it can be identified that through the EPS of Sainsbury for the year 2019 is lower
than Tesco, PE ratio is significantly higher as compared to Tesco. Hence it can be established
that shares of Sainsbury is overpriced as compared to Tesco Plc (Williams and Dobelman 2017).
Trend analysis
If the trend analysis is carried out in context of the performance of the entity over the last
4 years it can be recognised that revenue as well as cost of sales of the entity both are in
increasing trend and hence, the gross profit of the entity. Operating profit though reduced in
2016 as against 2016, it has been increased significantly during 2018 as well as 2019 both.
8FINANCIAL MANAGEMENT PRINCIPLES
However, there is significant amount of share of losses from joint ventures and reduction in
finance income. Bottom line profit of the entity that is the profit for the year though was in
negative in 2017, it has been increased significantly during 2018 and 2019 by 837.98% and
923.26% respectively.
Moving towards the balance sheet over the past 4 years covering the year 2016 to 2019 it
can be identified that though the non-current assets were in increasing trend, current assets of the
entity were in reducing trend. However, it can be acknowledged that the net current liabilities of
the entity were in dropping trend and hence it can be stated that the entity has enhanced its
liquidity position over the past 4 years. Looking into the equity of the entity over the past 4 years
it can be identified that the entity has issued new equity share capital and hence the total equity
capital has been in increasing trend (Luypaert, Van Caneghem and Van Uytbergen 2016).
Movement in ratios
If the movement in the ratios is considered from the standpoint of the investors, it can be
stated that both the liquidity ratios are moving downward that signifies that the liquidity position
of the entity has been deteriorated. Debt ratios of Tesco Plc is revealing that the ratios are in
reducing trend that is indicating that the leverage position of the firm over the years from 2016 to
2019 has been enhanced. Both the activity ratios of the entity that is the inventory turnover ratios
and receivable turnover ratios have been increased over the years that is suggesting that the
efficiency level of the entity in selling its inventories and collecting the dues have been reduced
(Marsha and Murtaqi 2017). Moving forward to profitability ratios it can be recognised that both
gross profit and net profit margin are in increasing trend that indicated the profitability position
of the firm has been enhanced. Further, analysing the market value ratios it can be recognized
⊘ This is a preview!⊘
Do you want full access?
Subscribe today to unlock all pages.
Trusted by 1+ million students worldwide
9FINANCIAL MANAGEMENT PRINCIPLES
that EPS of the entity has been increased to 13.65 pence from 1.70 pence and PE ratio of the
entity has been reduced 15.56 from 110.88. Both these market value ratios are indicating that
share of the entity in the market has been enhanced (Boyas and Teeter 2017). Hence, from
investor’s point of view Tesco shall be considered as a potential investment. However, the major
limitation in the analysis was that all the past data has been considered for the purpose of
analysis. However, the past data cannot predict the future performance rather it just provide an
idea of performance.
Conclusion and recommendation
From above discussion it can be concluded that though the liquidity position and
efficiency of the entity is below the required level for all the years Tesco was able to improve its
leverage position, profitability position and share value in the market. In addition, bottom line
profit of the entity has been increased significantly during 2018 and 2019. Hence, it is
recommended that the from investor’s point of view Tesco shall be considered as a potential
investment. Further, the entity is recommended to improve the liquidity position it shall pay off
the short term obligations through selling off the fixed assets those are not in use or became
obsolete.
Paraphrase This Document
Need a fresh take? Get an instant paraphrase of this document with our AI Paraphraser
10FINANCIAL MANAGEMENT PRINCIPLES
Reference
About.sainsburys.co.uk. 2020. Title. [online] Available at:
https://www.about.sainsburys.co.uk/investors/annual-report-2019 [Accessed 7 Jan. 2020].
Boyas, E. and Teeter, R., 2017. Teaching Financial Ratio Analysis using XBRL.
In Developments in Business Simulation and Experiential Learning: Proceedings of the Annual
ABSEL conference (Vol. 44, No. 1).
Faello, J., 2015. Understanding the limitations of financial ratios. Academy of Accounting and
Financial Studies Journal, 19(3), p.75.
Grimm, S.D. and Blazovich, J.L., 2016. Developing student competencies: An integrated
approach to a financial statement analysis project. Journal of Accounting Education, 35, pp.69-
101.
Kanapickienė, R. and Grundienė, Ž., 2015. The model of fraud detection in financial statements
by means of financial ratios. Procedia-Social and Behavioral Sciences, 213, pp.321-327.
Luypaert, M., Van Caneghem, T. and Van Uytbergen, S., 2016. Financial statement filing lags:
An empirical analysis among small firms. International Small Business Journal, 34(4), pp.506-
531.
Marsha, N. and Murtaqi, I., 2017. The effect of financial ratios on firm value in the food and
beverage sector of the idx. Journal of Business and Management, 6(2), pp.214-226.
11FINANCIAL MANAGEMENT PRINCIPLES
Rakićević, A., Milošević, P., Petrović, B. and Radojević, D.G., 2016. DuPont financial ratio
analysis using logical aggregation. In Soft computing applications (pp. 727-739). Springer,
Cham.
Robinson, T.R., 2020. International financial statement analysis. John Wiley & Sons.
Tesco PLC. 2020. Annual Report 2019. [online] Available at:
https://www.tescoplc.com/investors/reports-results-and-presentations/annual-report-2019/
[Accessed 7 Jan. 2020].
Tesco PLC. 2020. Home. [online] Available at: https://www.tescoplc.com/ [Accessed 7 Jan.
2020].
Uechi, L., Akutsu, T., Stanley, H.E., Marcus, A.J. and Kenett, D.Y., 2015. Sector dominance
ratio analysis of financial markets. Physica A: Statistical Mechanics and its Applications, 421,
pp.488-509.
Williams, E.E. and Dobelman, J.A., 2017. Financial statement analysis. World Scientific Book
Chapters, pp.109-169.
⊘ This is a preview!⊘
Do you want full access?
Subscribe today to unlock all pages.
Trusted by 1+ million students worldwide
1 out of 15
Related Documents


Your All-in-One AI-Powered Toolkit for Academic Success.
+13062052269
info@desklib.com
Available 24*7 on WhatsApp / Email
![[object Object]](/_next/static/media/star-bottom.7253800d.svg)
Unlock your academic potential
Copyright © 2020–2026 A2Z Services. All Rights Reserved. Developed and managed by ZUCOL.