Financial Analysis of T-Mobile: Industry Overview & Valuation
VerifiedAdded on 2023/01/11
|53
|7971
|52
Report
AI Summary
This comprehensive financial analysis report examines T-Mobile's performance, starting with an overview of the wireless industry in the U.S., emphasizing its economic impact and job creation. The report provides an in-depth look at T-Mobile's services, network performance, and recent developments, including its 5G network strategy. Section II presents a comparative and common size analysis of T-Mobile's financial data from 2014 to 2018, using trend and percentage change analyses. Section III delves into ratio analysis, evaluating the company's liquidity, solvency, profitability, and efficiency. Finally, Section IV focuses on valuation techniques. The report concludes with a summary of the findings and a list of references.

Financial Management
1
1
Paraphrase This Document
Need a fresh take? Get an instant paraphrase of this document with our AI Paraphraser
Table of Contents
Section I. Industry and Company Overview....................................................................................3
Section II. Comparative and Common Size Analysis...................................................................10
Section III. Ratio Analysis.............................................................................................................22
Section IV. Valuation....................................................................................................................45
Conclusion.....................................................................................................................................49
References......................................................................................................................................50
Appendices....................................................................................................................................51
2
Section I. Industry and Company Overview
Industry Overview
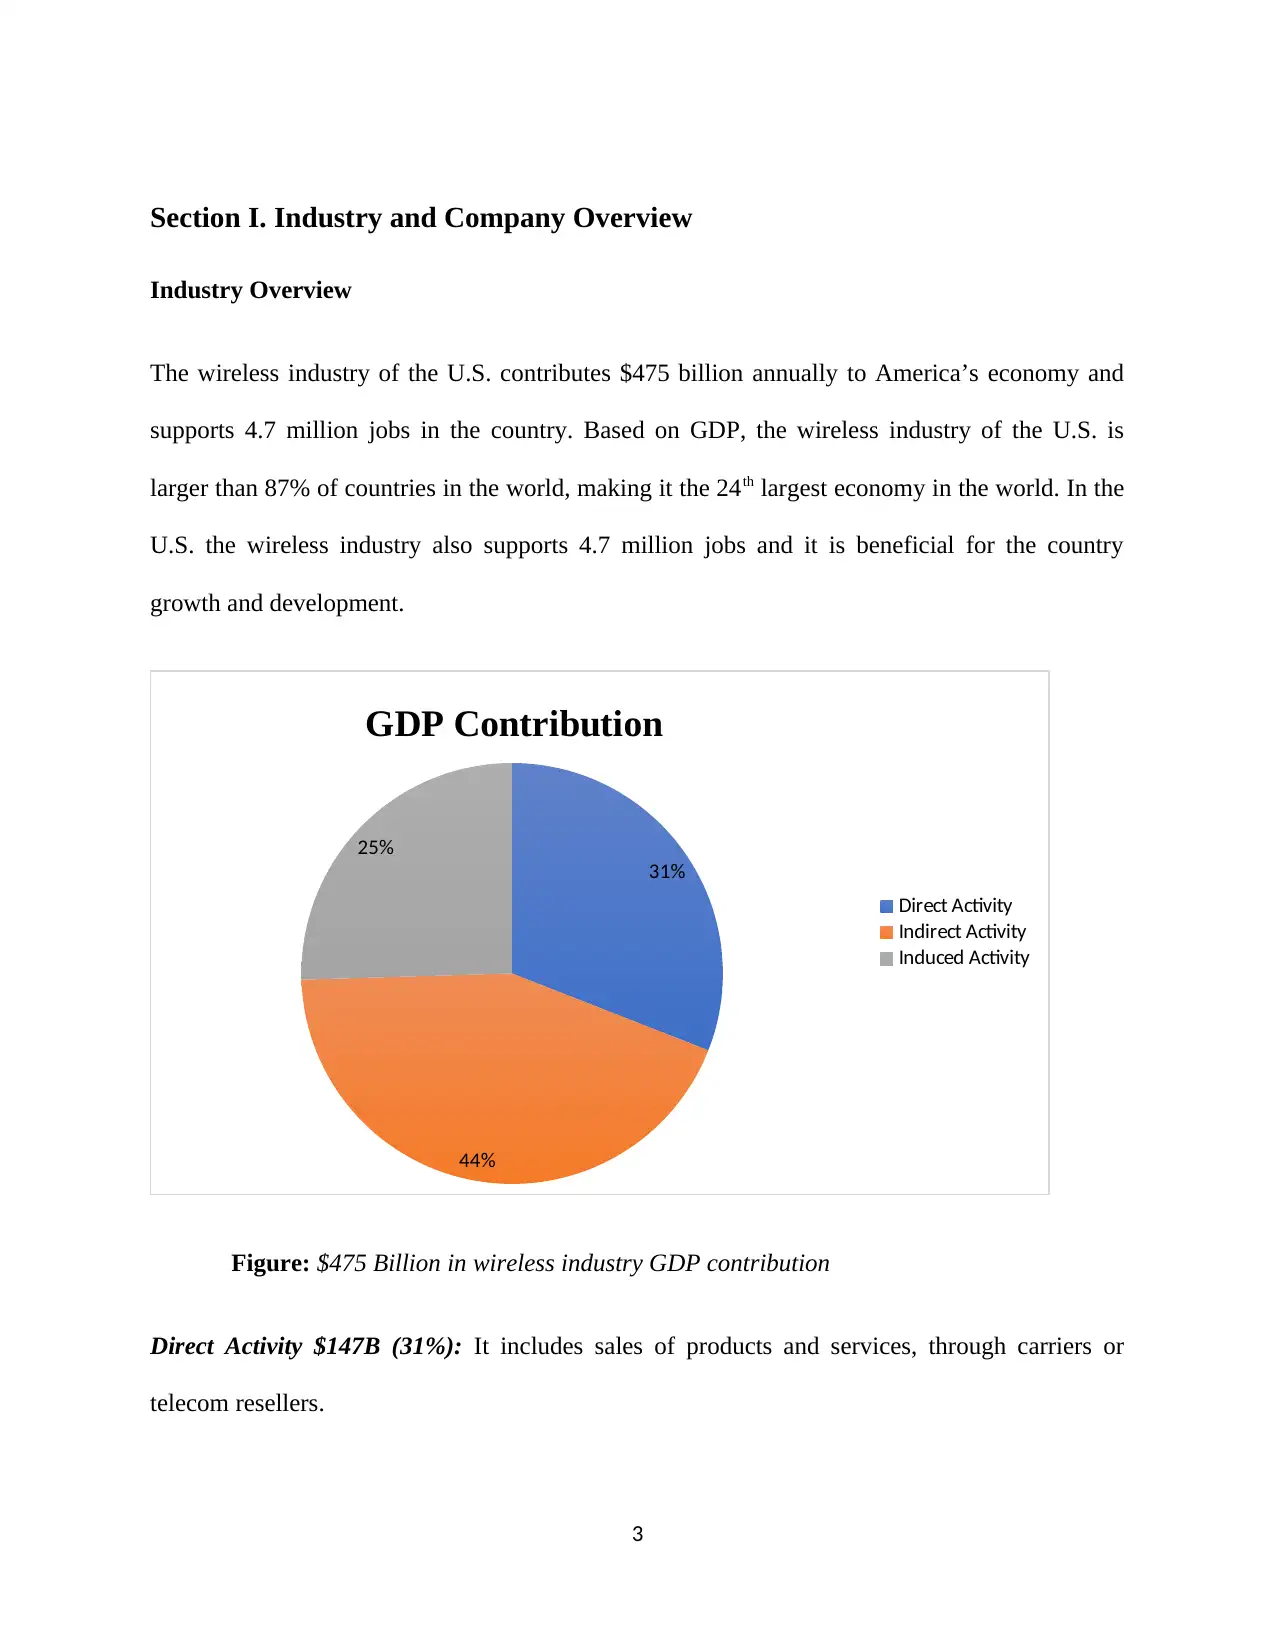
The wireless industry of the U.S. contributes $475 billion annually to America’s economy and
supports 4.7 million jobs in the country. Based on GDP, the wireless industry of the U.S. is
larger than 87% of countries in the world, making it the 24th largest economy in the world. In the
U.S. the wireless industry also supports 4.7 million jobs and it is beneficial for the country
growth and development.
31%
44%
25%
GDP Contribution
Direct Activity
Indirect Activity
Induced Activity
Figure: $475 Billion in wireless industry GDP contribution
Direct Activity $147B (31%): It includes sales of products and services, through carriers or
telecom resellers.
3
Industry Overview
The wireless industry of the U.S. contributes $475 billion annually to America’s economy and
supports 4.7 million jobs in the country. Based on GDP, the wireless industry of the U.S. is
larger than 87% of countries in the world, making it the 24th largest economy in the world. In the
U.S. the wireless industry also supports 4.7 million jobs and it is beneficial for the country
growth and development.
31%
44%
25%
GDP Contribution
Direct Activity
Indirect Activity
Induced Activity
Figure: $475 Billion in wireless industry GDP contribution
Direct Activity $147B (31%): It includes sales of products and services, through carriers or
telecom resellers.
3
⊘ This is a preview!⊘
Do you want full access?
Subscribe today to unlock all pages.
Trusted by 1+ million students worldwide
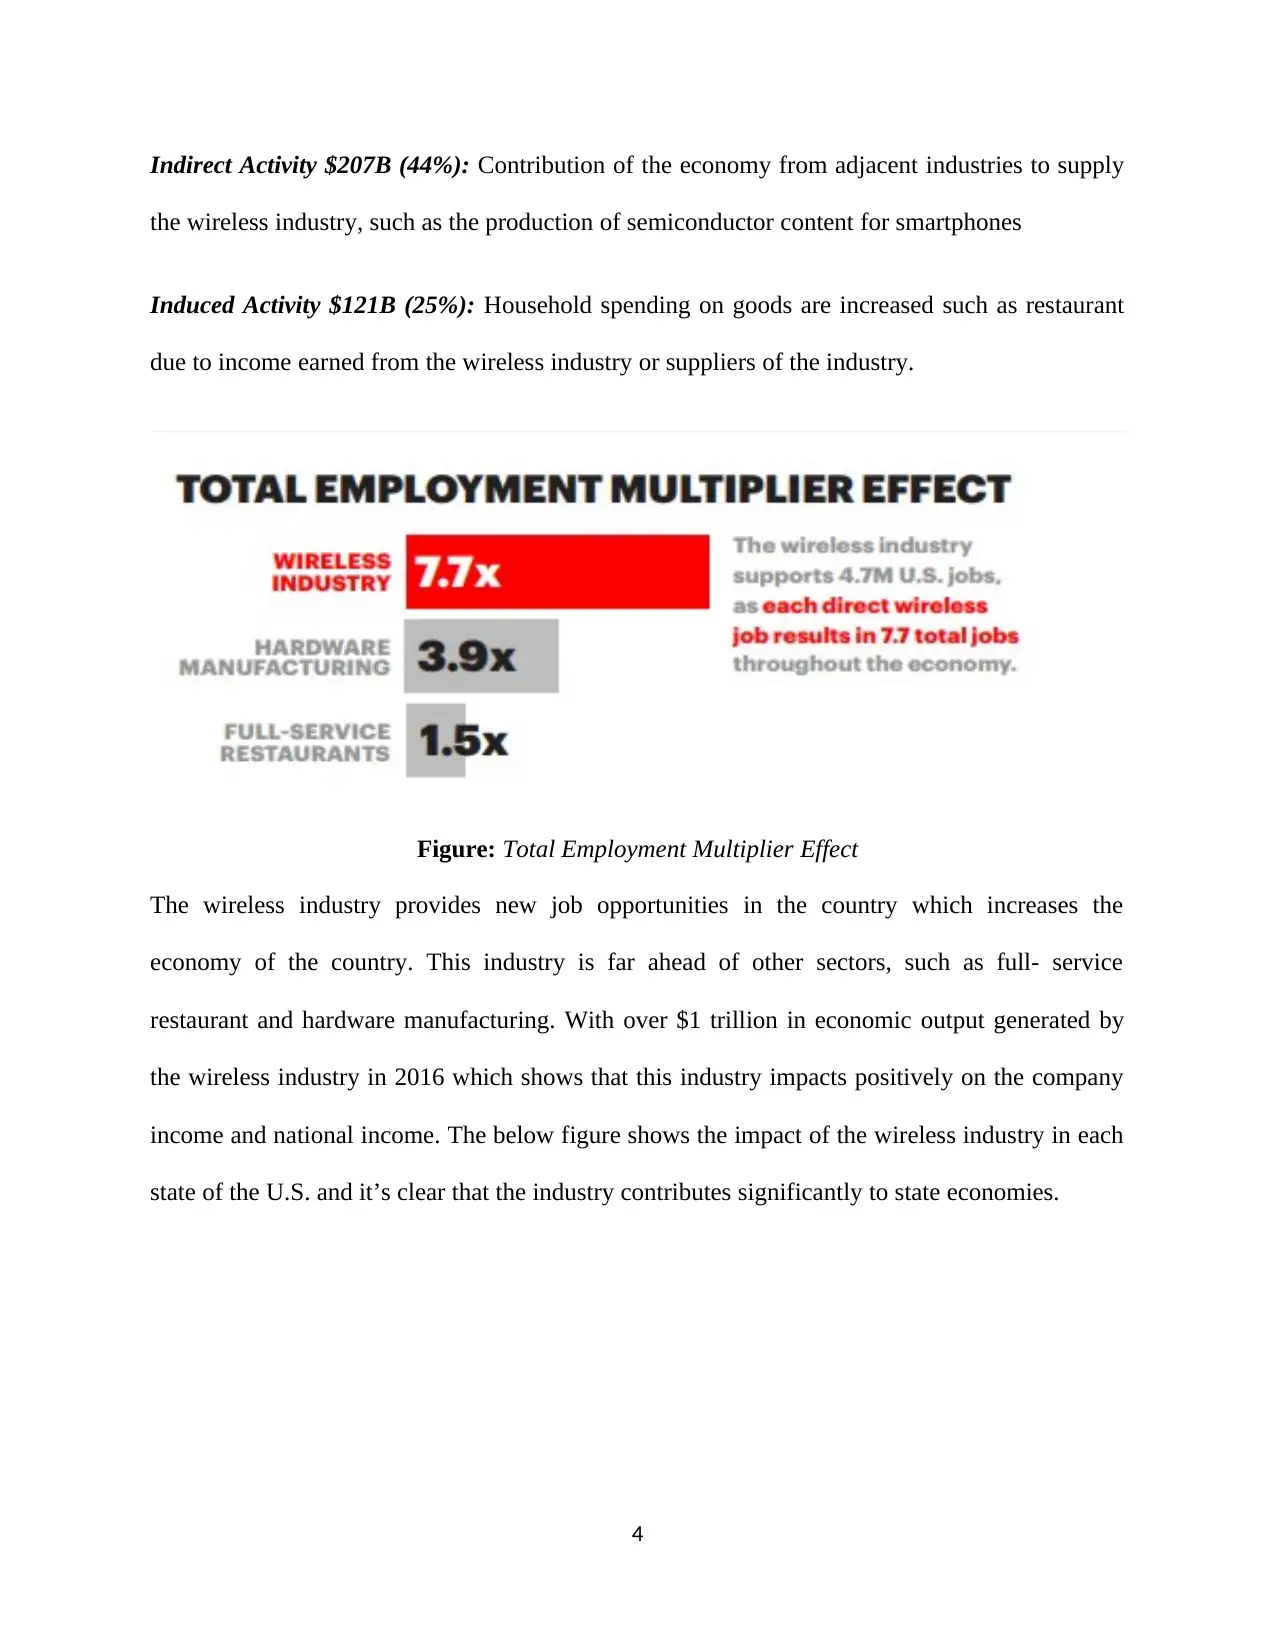
Indirect Activity $207B (44%): Contribution of the economy from adjacent industries to supply
the wireless industry, such as the production of semiconductor content for smartphones
Induced Activity $121B (25%): Household spending on goods are increased such as restaurant
due to income earned from the wireless industry or suppliers of the industry.
Figure: Total Employment Multiplier Effect
The wireless industry provides new job opportunities in the country which increases the
economy of the country. This industry is far ahead of other sectors, such as full- service
restaurant and hardware manufacturing. With over $1 trillion in economic output generated by
the wireless industry in 2016 which shows that this industry impacts positively on the company
income and national income. The below figure shows the impact of the wireless industry in each
state of the U.S. and it’s clear that the industry contributes significantly to state economies.
4
Paraphrase This Document
Need a fresh take? Get an instant paraphrase of this document with our AI Paraphraser
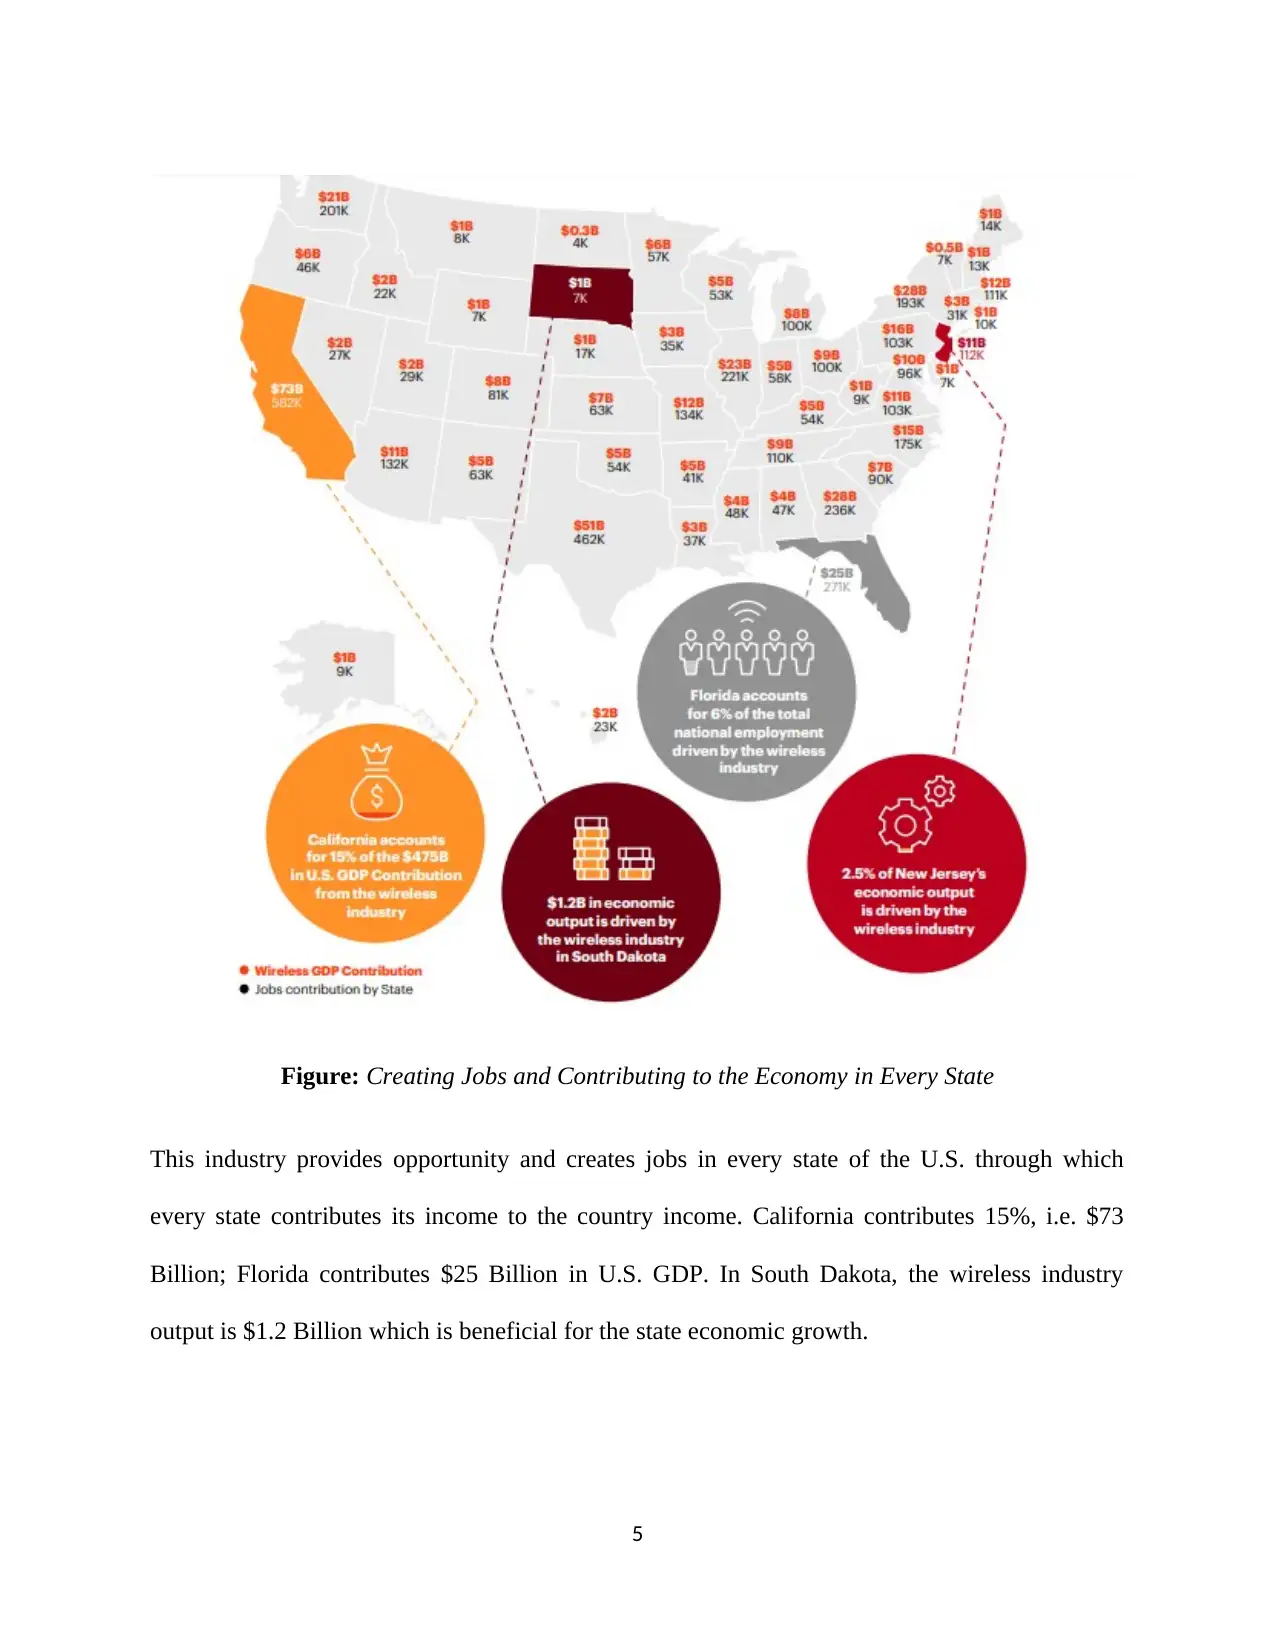
Figure: Creating Jobs and Contributing to the Economy in Every State
This industry provides opportunity and creates jobs in every state of the U.S. through which
every state contributes its income to the country income. California contributes 15%, i.e. $73
Billion; Florida contributes $25 Billion in U.S. GDP. In South Dakota, the wireless industry
output is $1.2 Billion which is beneficial for the state economic growth.
5
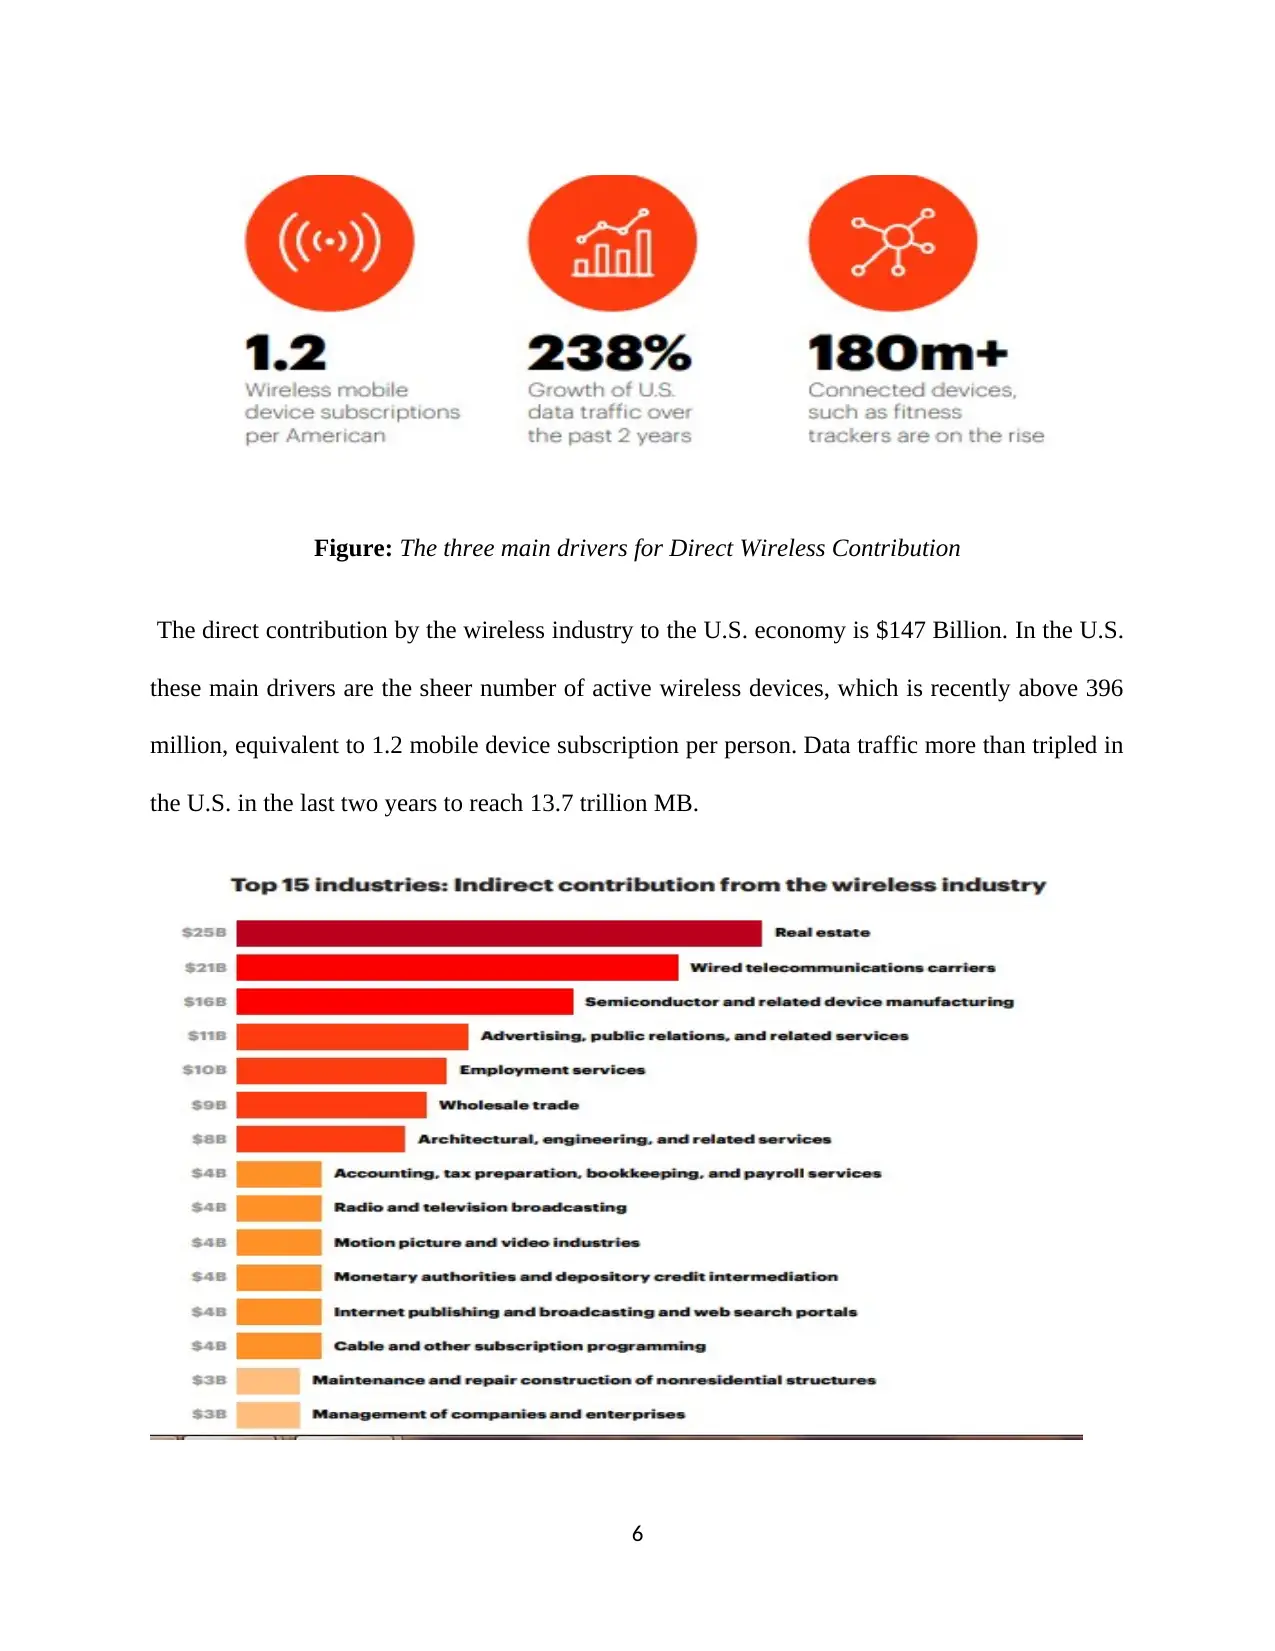
Figure: The three main drivers for Direct Wireless Contribution
The direct contribution by the wireless industry to the U.S. economy is $147 Billion. In the U.S.
these main drivers are the sheer number of active wireless devices, which is recently above 396
million, equivalent to 1.2 mobile device subscription per person. Data traffic more than tripled in
the U.S. in the last two years to reach 13.7 trillion MB.
6
⊘ This is a preview!⊘
Do you want full access?
Subscribe today to unlock all pages.
Trusted by 1+ million students worldwide
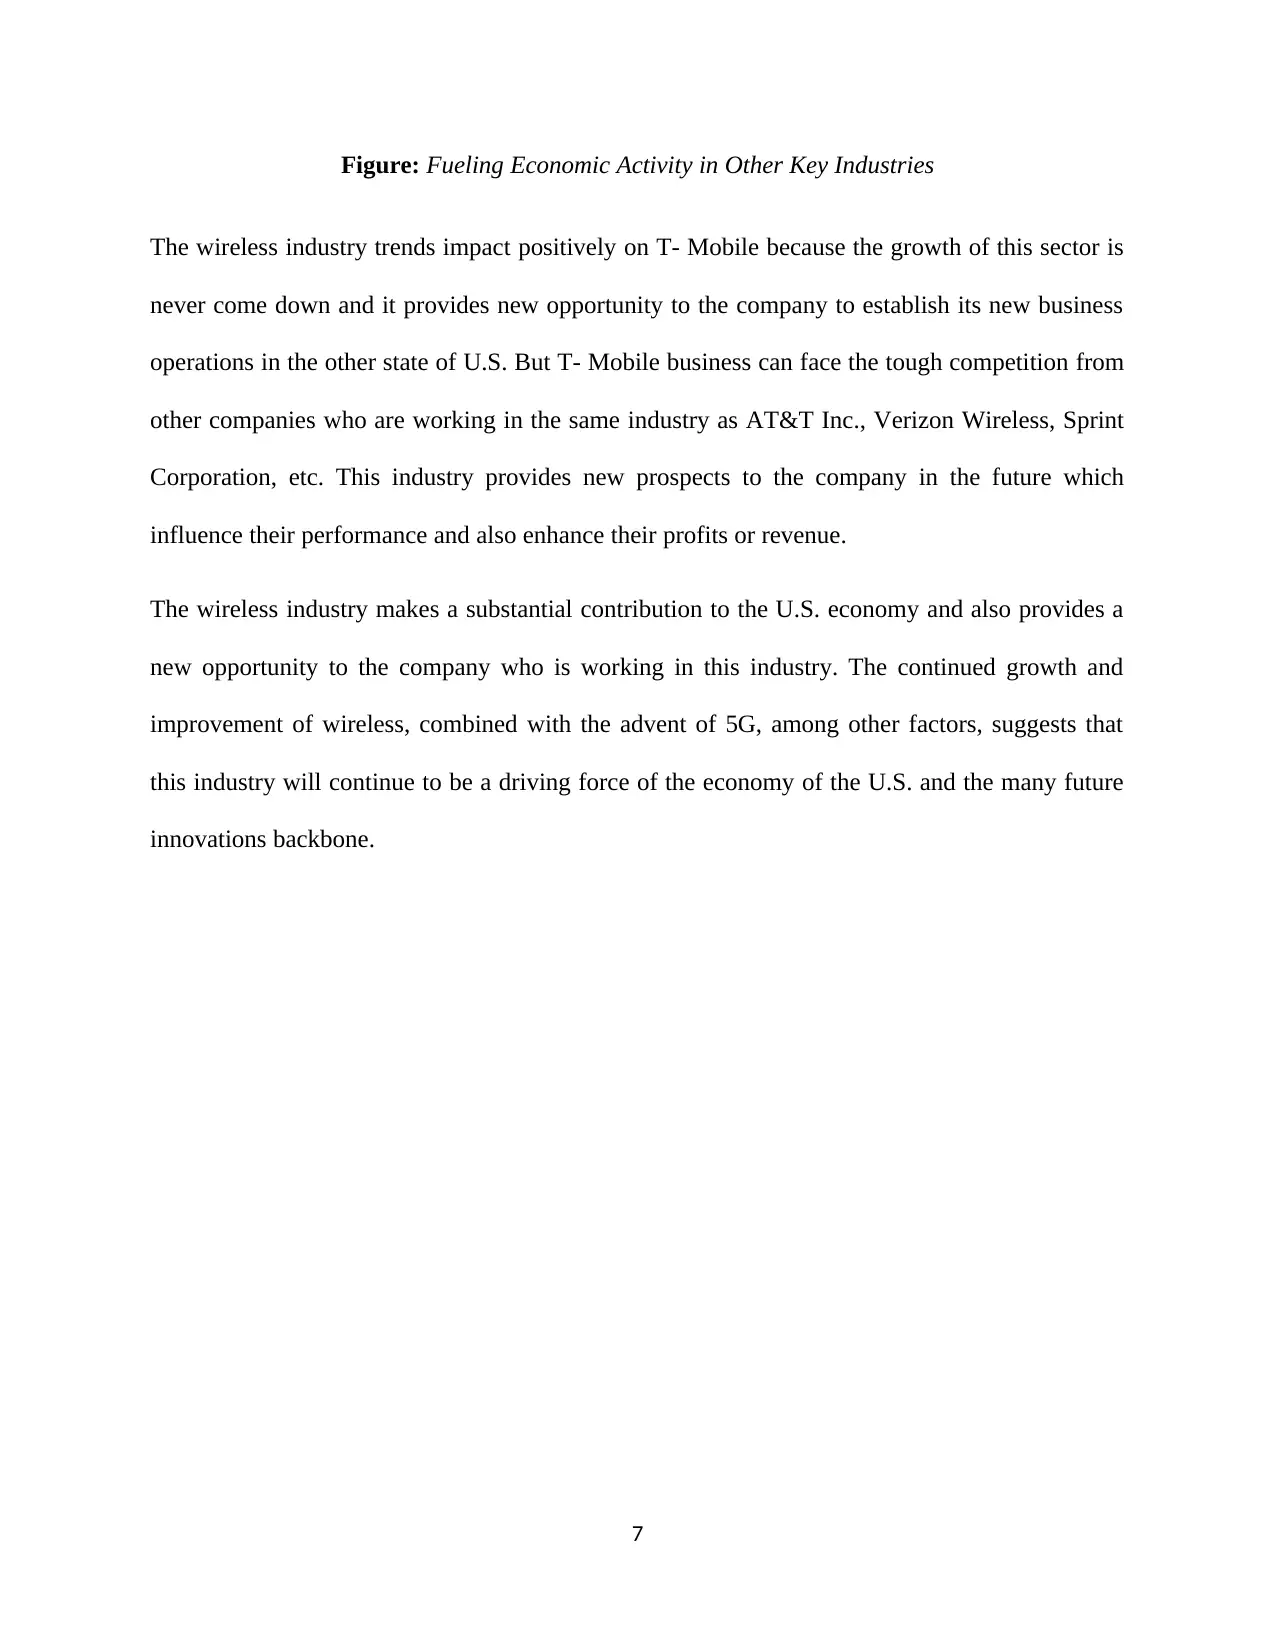
Figure: Fueling Economic Activity in Other Key Industries
The wireless industry trends impact positively on T- Mobile because the growth of this sector is
never come down and it provides new opportunity to the company to establish its new business
operations in the other state of U.S. But T- Mobile business can face the tough competition from
other companies who are working in the same industry as AT&T Inc., Verizon Wireless, Sprint
Corporation, etc. This industry provides new prospects to the company in the future which
influence their performance and also enhance their profits or revenue.
The wireless industry makes a substantial contribution to the U.S. economy and also provides a
new opportunity to the company who is working in this industry. The continued growth and
improvement of wireless, combined with the advent of 5G, among other factors, suggests that
this industry will continue to be a driving force of the economy of the U.S. and the many future
innovations backbone.
7
Paraphrase This Document
Need a fresh take? Get an instant paraphrase of this document with our AI Paraphraser
Company Overview
T- Mobile is a wireless network operator which operates its business operations in the United
States. In 2019, T- Mobile is the third largest wireless carrier in the United States with 81.3
million customers in the first quarter.
Services provided by T- Mobile in the United States are:
Wireless Voice
Data Services
The company’s advanced nationwide 4G LTE network delivers outstanding wireless experiences
for customers who are unwilling to compromise on value and quality. Total service revenues in
1Q19 are $8.3 Billion and 99% of American now covered with a 4G LTE network that is the
biggest achievement for the company. T- Mobile Inc. also provides services through its
subsidiaries and operates its flagship brands, T- Mobile, and Metro by T-Mobile.
Industry Leading Network Performance
Aggressive deployment of 600 MHz using 5G ready equipment nearly 3500 cities and
towns
The fastest combined average of upload and download speeds for 21 quarters
The first nationwide 5G network available next year.
Major products of the company
T- Mobile ONE
Simple Choice
8
GoSmart Mobile
TVision Home
Current event of the company
The company makes strategies and invents innovative ideas to capture the market with the help
of a 5G network. 5G will spur $275 Billion in new investment, creating 3 Million new jobs and
adding $500 Billion to the economy by 2024.
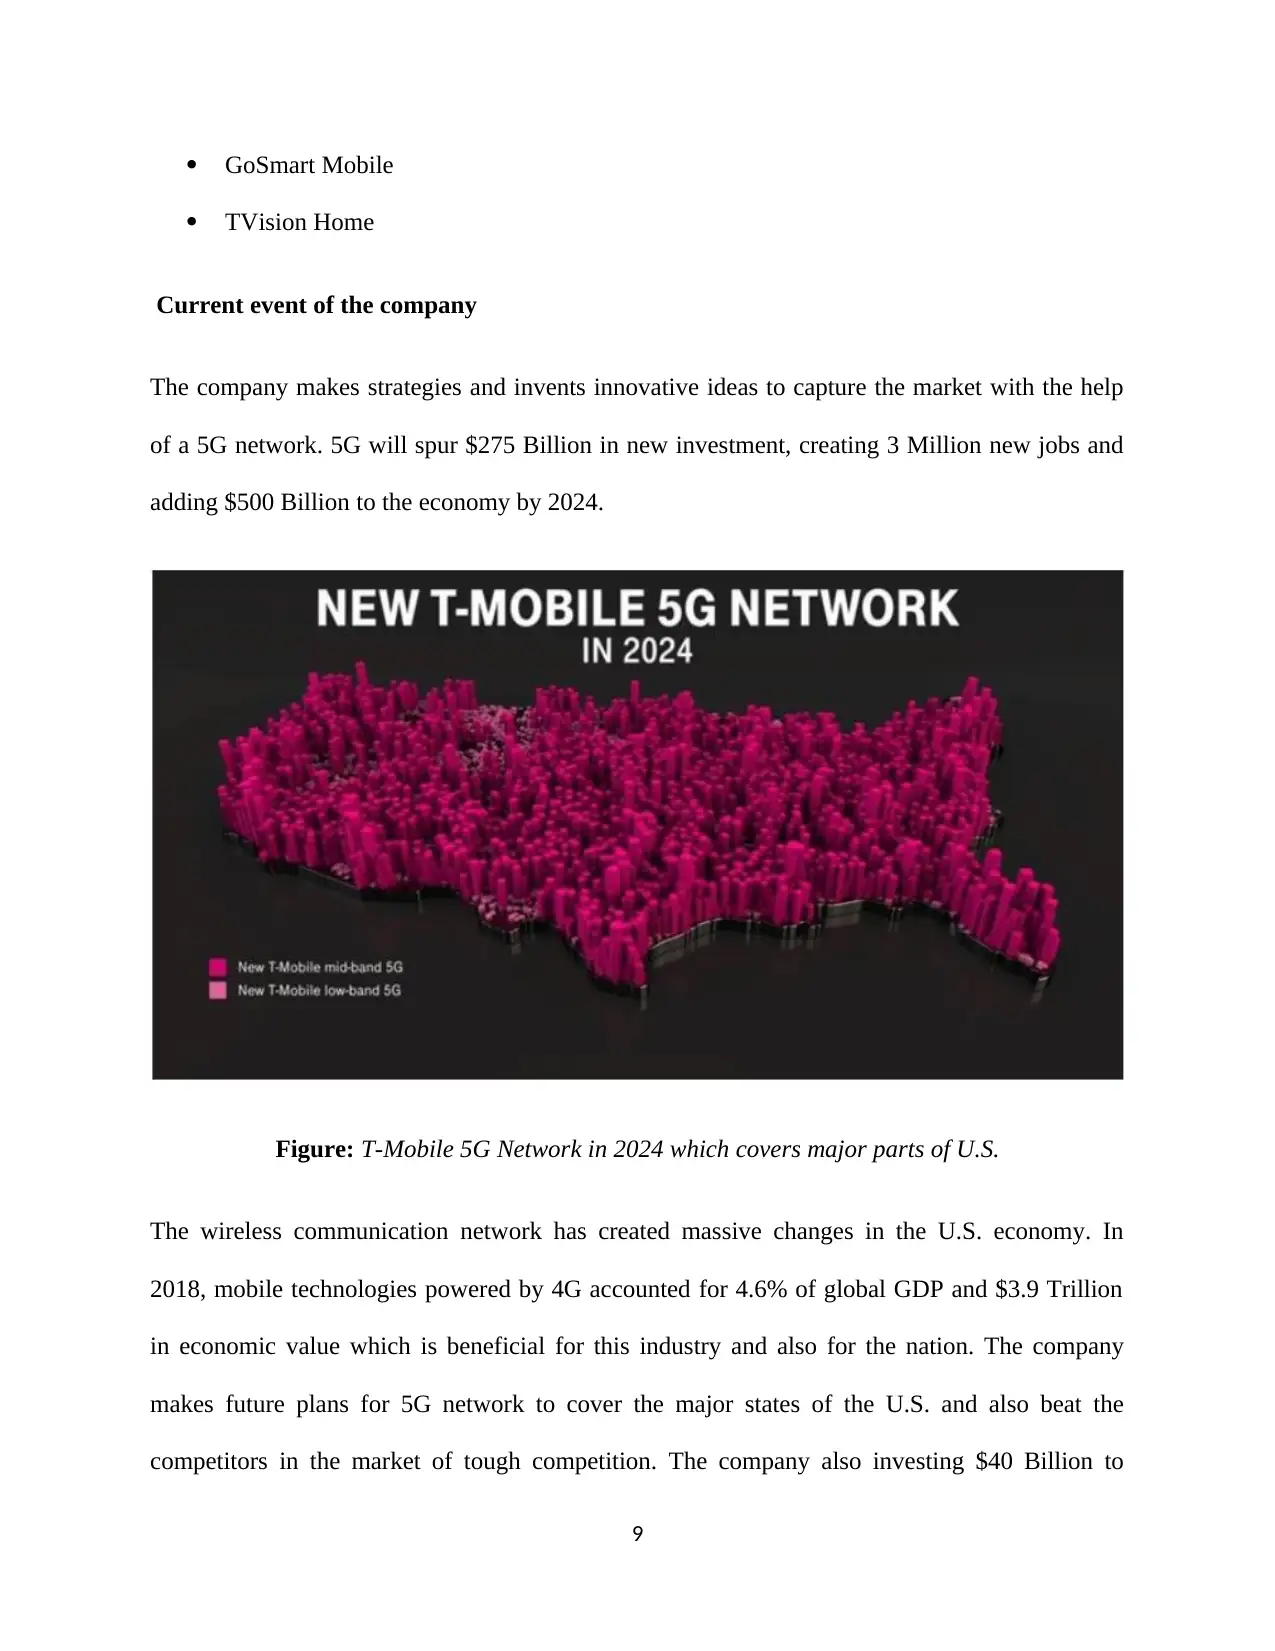
Figure: T-Mobile 5G Network in 2024 which covers major parts of U.S.
The wireless communication network has created massive changes in the U.S. economy. In
2018, mobile technologies powered by 4G accounted for 4.6% of global GDP and $3.9 Trillion
in economic value which is beneficial for this industry and also for the nation. The company
makes future plans for 5G network to cover the major states of the U.S. and also beat the
competitors in the market of tough competition. The company also investing $40 Billion to
9
TVision Home
Current event of the company
The company makes strategies and invents innovative ideas to capture the market with the help
of a 5G network. 5G will spur $275 Billion in new investment, creating 3 Million new jobs and
adding $500 Billion to the economy by 2024.
Figure: T-Mobile 5G Network in 2024 which covers major parts of U.S.
The wireless communication network has created massive changes in the U.S. economy. In
2018, mobile technologies powered by 4G accounted for 4.6% of global GDP and $3.9 Trillion
in economic value which is beneficial for this industry and also for the nation. The company
makes future plans for 5G network to cover the major states of the U.S. and also beat the
competitors in the market of tough competition. The company also investing $40 Billion to
9
⊘ This is a preview!⊘
Do you want full access?
Subscribe today to unlock all pages.
Trusted by 1+ million students worldwide
deliver the first wireless network facilities to nationwide in the form of 5G network- from big
cities to rural America.
Section II. Comparative and Common Size Analysis
1. Calculate and present the following analysis for the past 5 years:
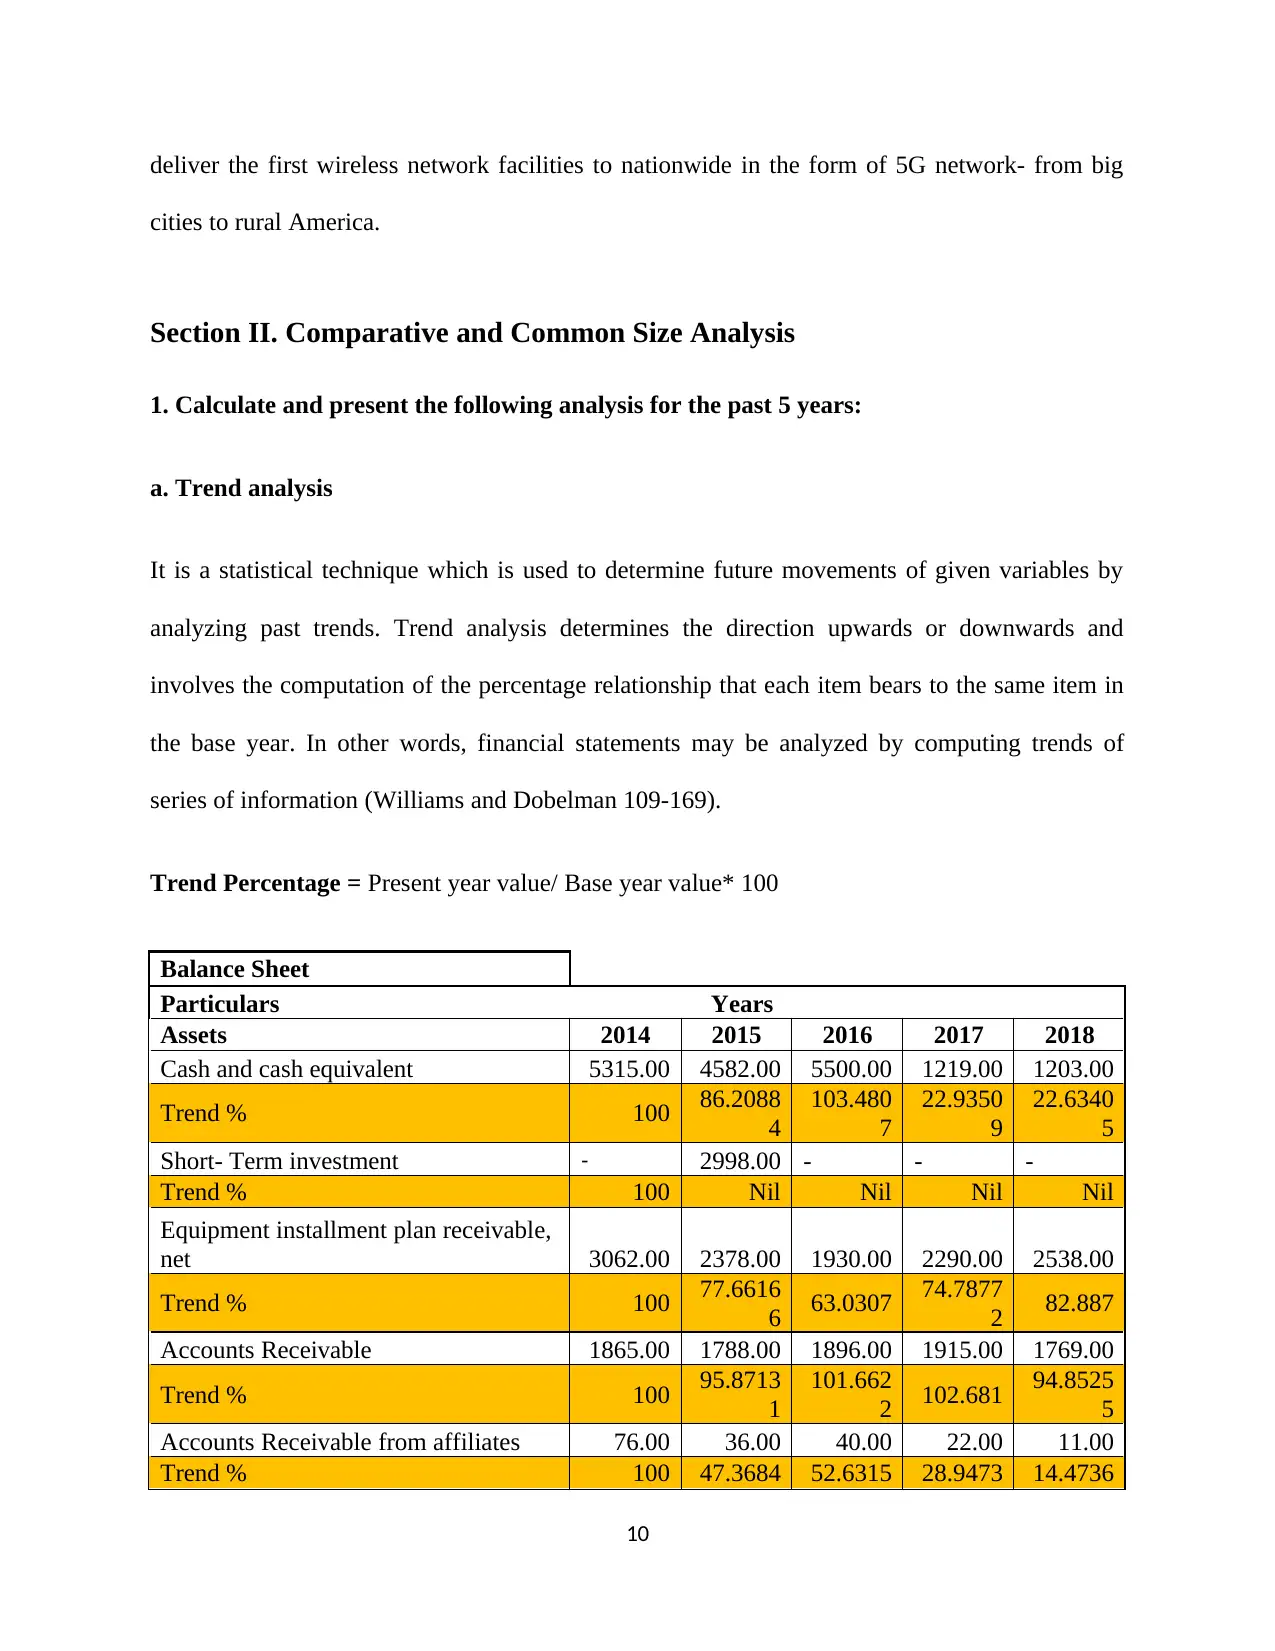
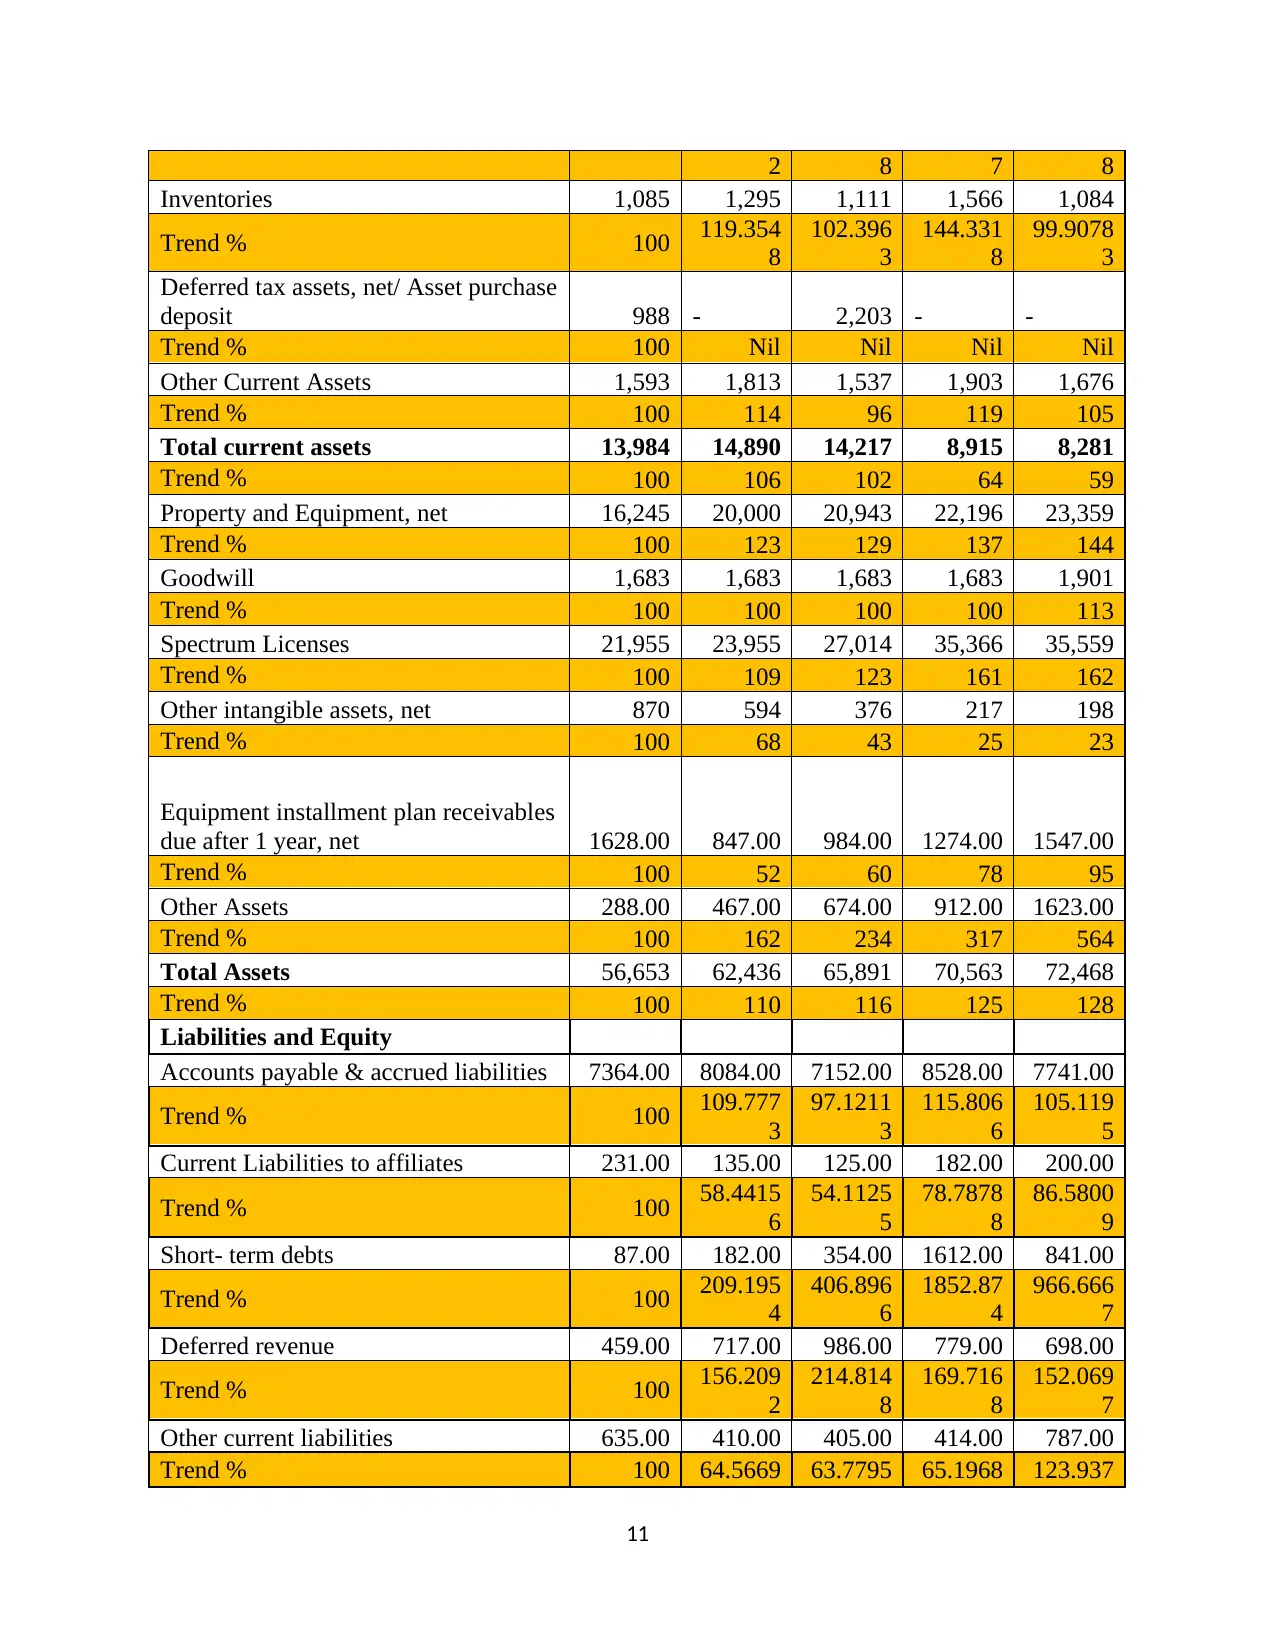
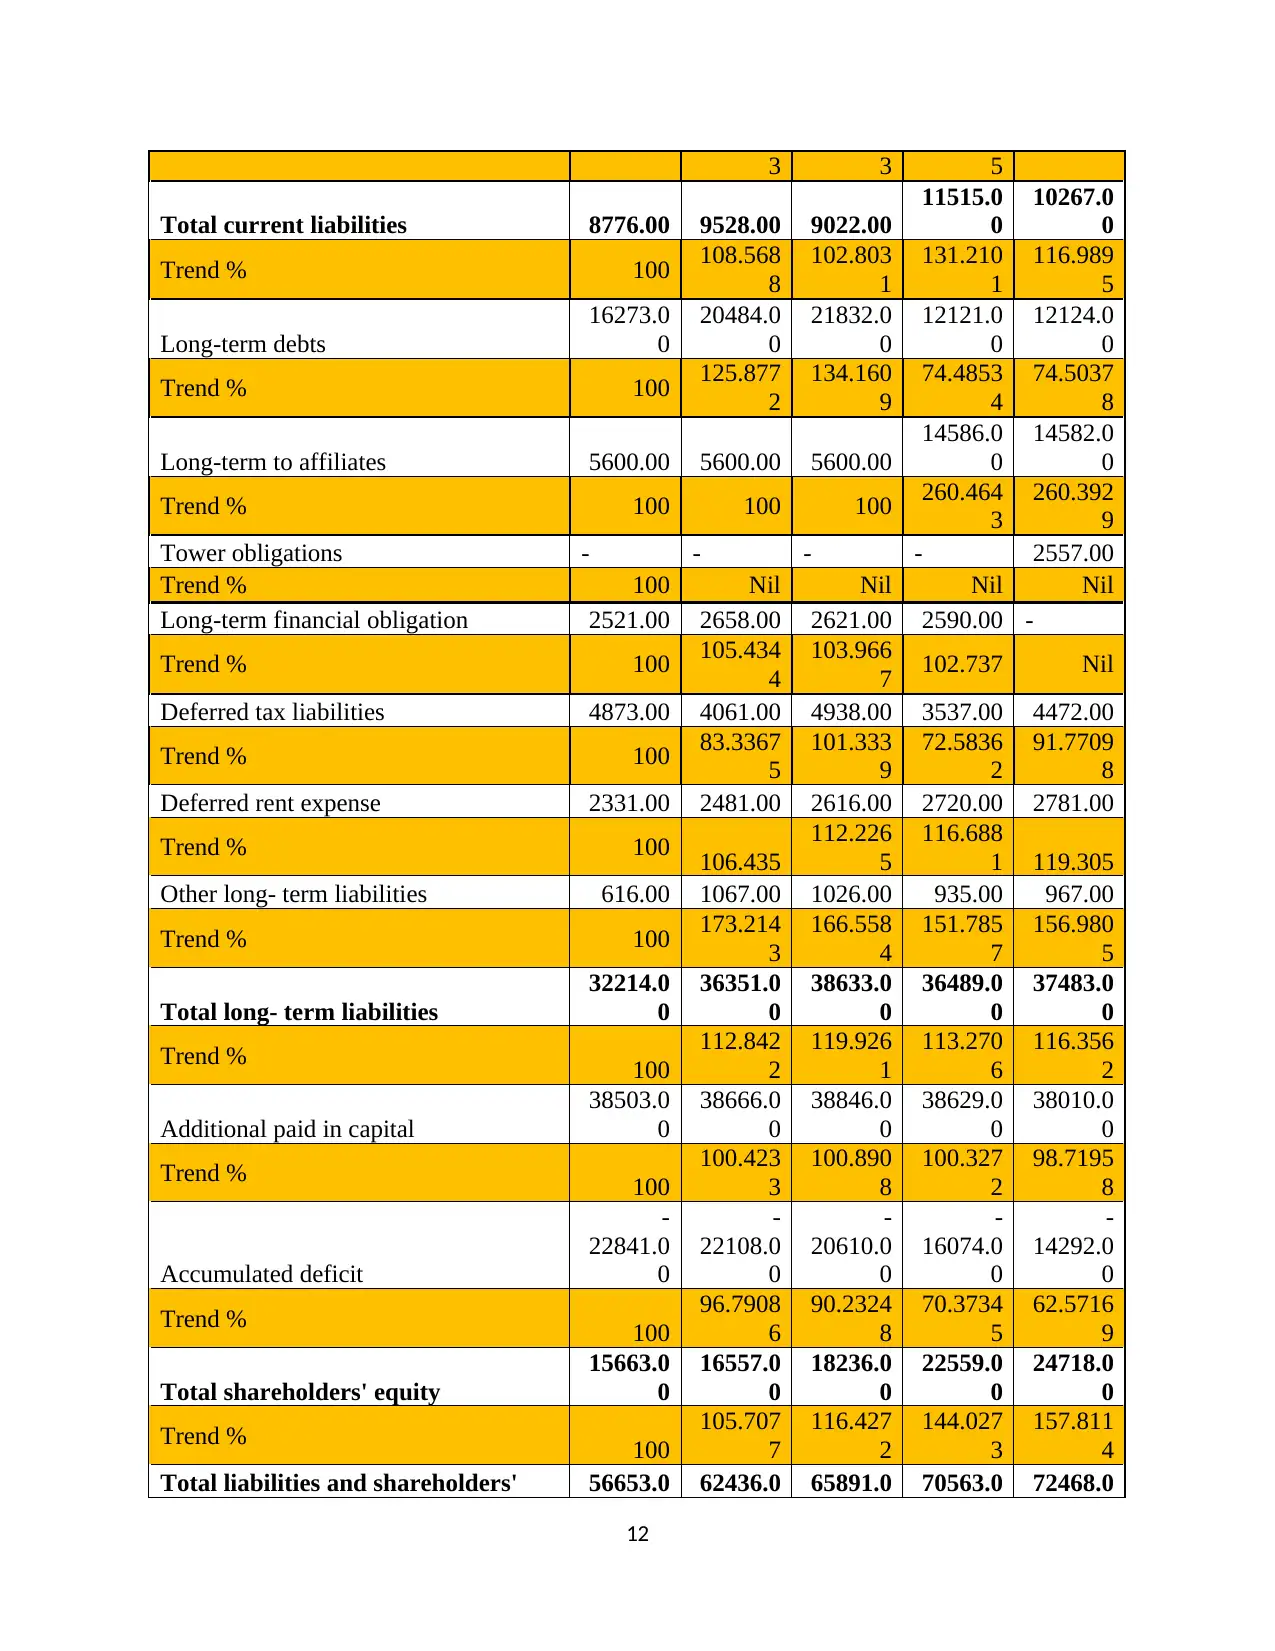
a. Trend analysis
It is a statistical technique which is used to determine future movements of given variables by
analyzing past trends. Trend analysis determines the direction upwards or downwards and
involves the computation of the percentage relationship that each item bears to the same item in
the base year. In other words, financial statements may be analyzed by computing trends of
series of information (Williams and Dobelman 109-169).
Trend Percentage = Present year value/ Base year value* 100
Balance Sheet
Particulars Years
Assets 2014 2015 2016 2017 2018
Cash and cash equivalent 5315.00 4582.00 5500.00 1219.00 1203.00
Trend % 100 86.2088
4
103.480
7
22.9350
9
22.6340
5
Short- Term investment - 2998.00 - - -
Trend % 100 Nil Nil Nil Nil
Equipment installment plan receivable,
net 3062.00 2378.00 1930.00 2290.00 2538.00
Trend % 100 77.6616
6 63.0307 74.7877
2 82.887
Accounts Receivable 1865.00 1788.00 1896.00 1915.00 1769.00
Trend % 100 95.8713
1
101.662
2 102.681 94.8525
5
Accounts Receivable from affiliates 76.00 36.00 40.00 22.00 11.00
Trend % 100 47.3684 52.6315 28.9473 14.4736
10
cities to rural America.
Section II. Comparative and Common Size Analysis
1. Calculate and present the following analysis for the past 5 years:
a. Trend analysis
It is a statistical technique which is used to determine future movements of given variables by
analyzing past trends. Trend analysis determines the direction upwards or downwards and
involves the computation of the percentage relationship that each item bears to the same item in
the base year. In other words, financial statements may be analyzed by computing trends of
series of information (Williams and Dobelman 109-169).
Trend Percentage = Present year value/ Base year value* 100
Balance Sheet
Particulars Years
Assets 2014 2015 2016 2017 2018
Cash and cash equivalent 5315.00 4582.00 5500.00 1219.00 1203.00
Trend % 100 86.2088
4
103.480
7
22.9350
9
22.6340
5
Short- Term investment - 2998.00 - - -
Trend % 100 Nil Nil Nil Nil
Equipment installment plan receivable,
net 3062.00 2378.00 1930.00 2290.00 2538.00
Trend % 100 77.6616
6 63.0307 74.7877
2 82.887
Accounts Receivable 1865.00 1788.00 1896.00 1915.00 1769.00
Trend % 100 95.8713
1
101.662
2 102.681 94.8525
5
Accounts Receivable from affiliates 76.00 36.00 40.00 22.00 11.00
Trend % 100 47.3684 52.6315 28.9473 14.4736
10
Paraphrase This Document
Need a fresh take? Get an instant paraphrase of this document with our AI Paraphraser
2 8 7 8
Inventories 1,085 1,295 1,111 1,566 1,084
Trend % 100 119.354
8
102.396
3
144.331
8
99.9078
3
Deferred tax assets, net/ Asset purchase
deposit 988 - 2,203 - -
Trend % 100 Nil Nil Nil Nil
Other Current Assets 1,593 1,813 1,537 1,903 1,676
Trend % 100 114 96 119 105
Total current assets 13,984 14,890 14,217 8,915 8,281
Trend % 100 106 102 64 59
Property and Equipment, net 16,245 20,000 20,943 22,196 23,359
Trend % 100 123 129 137 144
Goodwill 1,683 1,683 1,683 1,683 1,901
Trend % 100 100 100 100 113
Spectrum Licenses 21,955 23,955 27,014 35,366 35,559
Trend % 100 109 123 161 162
Other intangible assets, net 870 594 376 217 198
Trend % 100 68 43 25 23
Equipment installment plan receivables
due after 1 year, net 1628.00 847.00 984.00 1274.00 1547.00
Trend % 100 52 60 78 95
Other Assets 288.00 467.00 674.00 912.00 1623.00
Trend % 100 162 234 317 564
Total Assets 56,653 62,436 65,891 70,563 72,468
Trend % 100 110 116 125 128
Liabilities and Equity
Accounts payable & accrued liabilities 7364.00 8084.00 7152.00 8528.00 7741.00
Trend % 100 109.777
3
97.1211
3
115.806
6
105.119
5
Current Liabilities to affiliates 231.00 135.00 125.00 182.00 200.00
Trend % 100 58.4415
6
54.1125
5
78.7878
8
86.5800
9
Short- term debts 87.00 182.00 354.00 1612.00 841.00
Trend % 100 209.195
4
406.896
6
1852.87
4
966.666
7
Deferred revenue 459.00 717.00 986.00 779.00 698.00
Trend % 100 156.209
2
214.814
8
169.716
8
152.069
7
Other current liabilities 635.00 410.00 405.00 414.00 787.00
Trend % 100 64.5669 63.7795 65.1968 123.937
11
3 3 5
Total current liabilities 8776.00 9528.00 9022.00
11515.0
0
10267.0
0
Trend % 100 108.568
8
102.803
1
131.210
1
116.989
5
Long-term debts
16273.0
0
20484.0
0
21832.0
0
12121.0
0
12124.0
0
Trend % 100 125.877
2
134.160
9
74.4853
4
74.5037
8
Long-term to affiliates 5600.00 5600.00 5600.00
14586.0
0
14582.0
0
Trend % 100 100 100 260.464
3
260.392
9
Tower obligations - - - - 2557.00
Trend % 100 Nil Nil Nil Nil
Long-term financial obligation 2521.00 2658.00 2621.00 2590.00 -
Trend % 100 105.434
4
103.966
7 102.737 Nil
Deferred tax liabilities 4873.00 4061.00 4938.00 3537.00 4472.00
Trend % 100 83.3367
5
101.333
9
72.5836
2
91.7709
8
Deferred rent expense 2331.00 2481.00 2616.00 2720.00 2781.00
Trend % 100 106.435
112.226
5
116.688
1 119.305
Other long- term liabilities 616.00 1067.00 1026.00 935.00 967.00
Trend % 100 173.214
3
166.558
4
151.785
7
156.980
5
Total long- term liabilities
32214.0
0
36351.0
0
38633.0
0
36489.0
0
37483.0
0
Trend % 100
112.842
2
119.926
1
113.270
6
116.356
2
Additional paid in capital
38503.0
0
38666.0
0
38846.0
0
38629.0
0
38010.0
0
Trend % 100
100.423
3
100.890
8
100.327
2
98.7195
8
Accumulated deficit
-
22841.0
0
-
22108.0
0
-
20610.0
0
-
16074.0
0
-
14292.0
0
Trend % 100
96.7908
6
90.2324
8
70.3734
5
62.5716
9
Total shareholders' equity
15663.0
0
16557.0
0
18236.0
0
22559.0
0
24718.0
0
Trend % 100
105.707
7
116.427
2
144.027
3
157.811
4
Total liabilities and shareholders' 56653.0 62436.0 65891.0 70563.0 72468.0
12
⊘ This is a preview!⊘
Do you want full access?
Subscribe today to unlock all pages.
Trusted by 1+ million students worldwide
1 out of 53
Related Documents


Your All-in-One AI-Powered Toolkit for Academic Success.
+13062052269
info@desklib.com
Available 24*7 on WhatsApp / Email
![[object Object]](/_next/static/media/star-bottom.7253800d.svg)
Unlock your academic potential
Copyright © 2020–2026 A2Z Services. All Rights Reserved. Developed and managed by ZUCOL.