Financial Management and Analysis Report: Unilever Case Study
VerifiedAdded on 2022/12/26
|13
|3660
|67
Report
AI Summary
This report provides a comprehensive financial analysis of Unilever, a company listed on the London Stock Exchange. The analysis begins with an examination of Unilever's financial performance and health over the past two years, utilizing various financial ratios to assess liquidity, profitability, efficiency, capital structure, and stock market performance. The report then discusses the limitations of ratio analysis and suggests improvements. Subsequent tasks delve into investment decision-making, including payback period, Net Present Value (NPV), and Internal Rate of Return (IRR) calculations for different investment choices. Further, the report evaluates the valuation of right issues, assesses market capitalization, and explores the net asset value of the company. It also uses the Price-to-Earnings (P/E) ratio method to value the company and analyzes historical dividend growth rates. The report concludes with a discussion of systematic and unsystematic risks associated with the stock market.

FINANCIAL
MANAGEMENT AND
ANALYSIS
MANAGEMENT AND
ANALYSIS
Paraphrase This Document
Need a fresh take? Get an instant paraphrase of this document with our AI Paraphraser
TABLE OF CONTENTS
INTRODUCTION...............................................................................................................................3
MAIN BODY.......................................................................................................................................3
Task 1................................................................................................................................................3
1) Critical analysis of Unilever’s financial performance and health based on past two years
performance and position..................................................................................................................3
Task 2................................................................................................................................................4
Task 3................................................................................................................................................6
Task 4................................................................................................................................................7
Task 5................................................................................................................................................9
CONCLUSION..................................................................................................................................11
REFERENCES..................................................................................................................................12
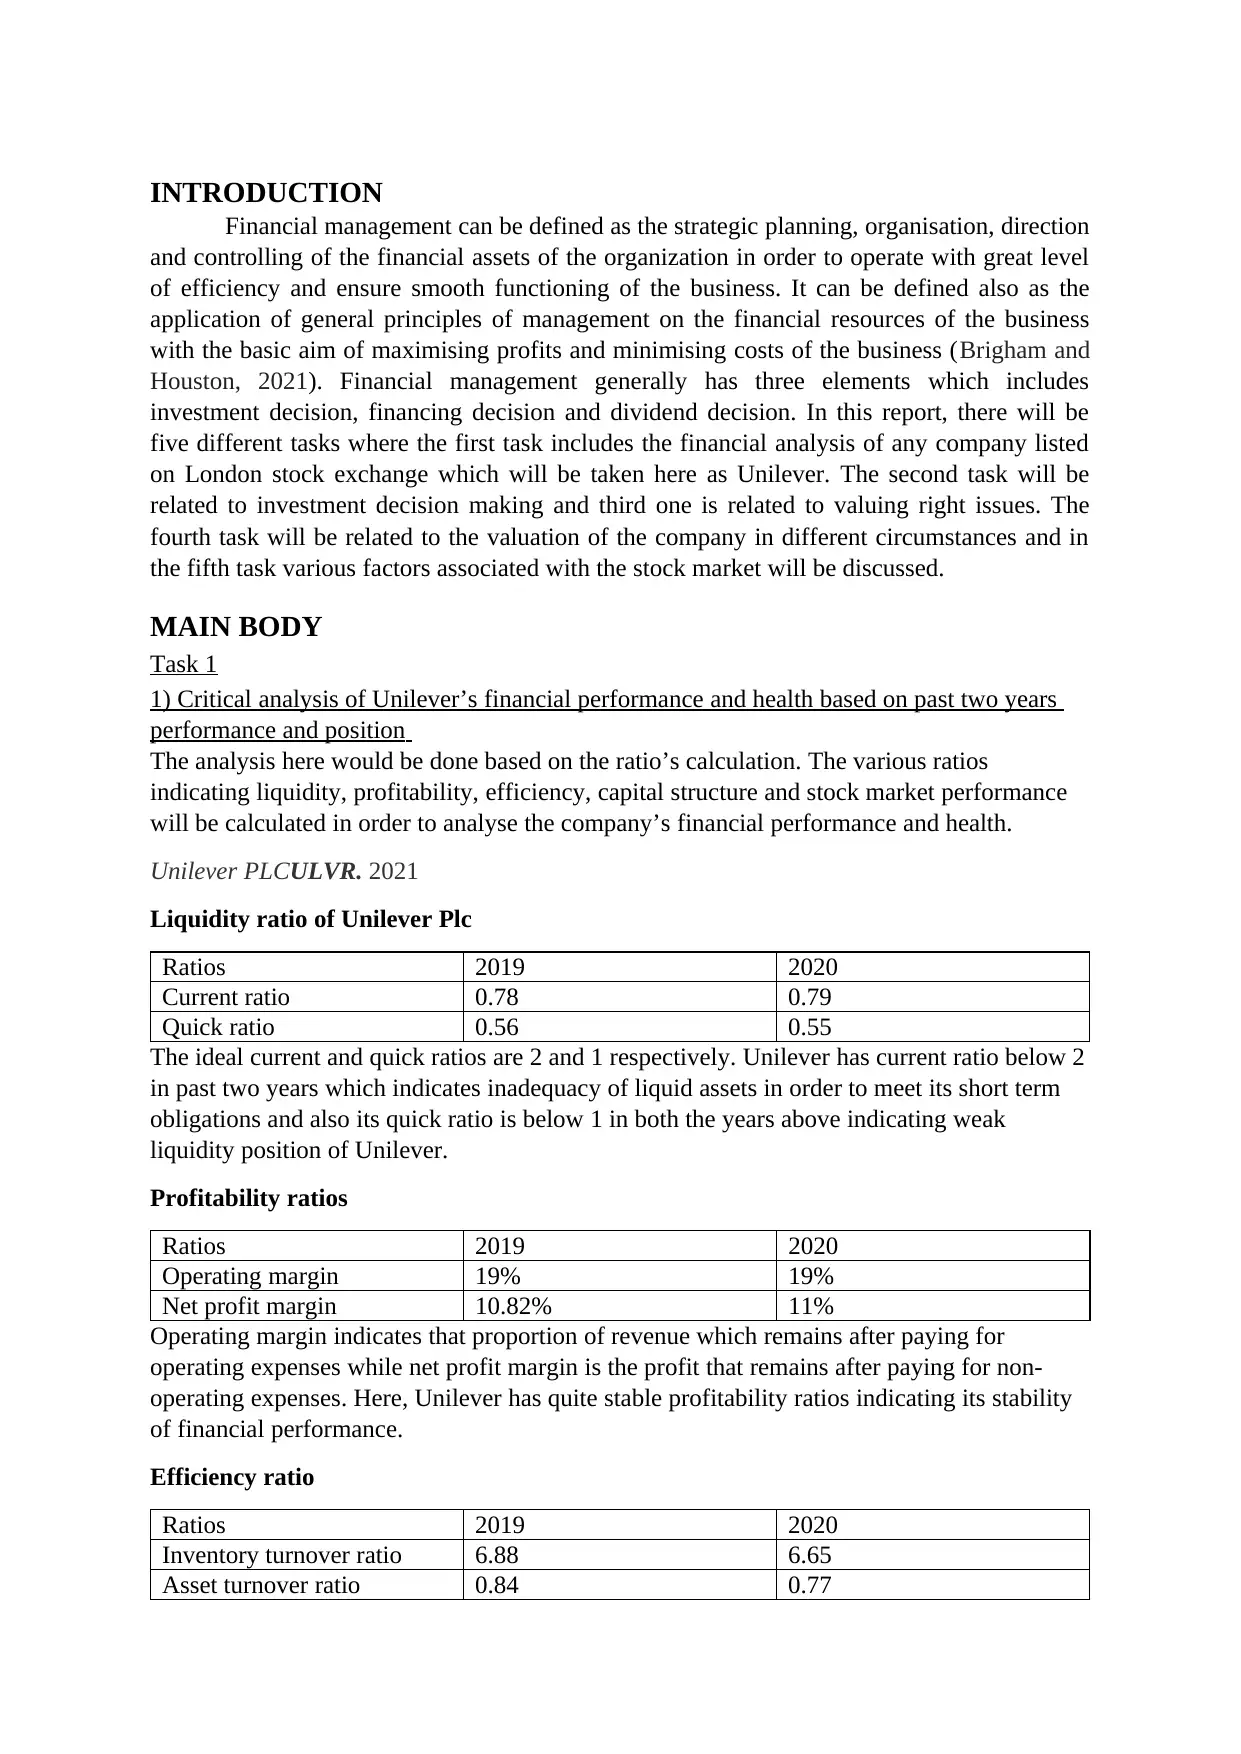
INTRODUCTION
Financial management can be defined as the strategic planning, organisation, direction
and controlling of the financial assets of the organization in order to operate with great level
of efficiency and ensure smooth functioning of the business. It can be defined also as the
application of general principles of management on the financial resources of the business
with the basic aim of maximising profits and minimising costs of the business (Brigham and
Houston, 2021). Financial management generally has three elements which includes
investment decision, financing decision and dividend decision. In this report, there will be
five different tasks where the first task includes the financial analysis of any company listed
on London stock exchange which will be taken here as Unilever. The second task will be
related to investment decision making and third one is related to valuing right issues. The
fourth task will be related to the valuation of the company in different circumstances and in
the fifth task various factors associated with the stock market will be discussed.
MAIN BODY
Task 1
1) Critical analysis of Unilever’s financial performance and health based on past two years
performance and position
The analysis here would be done based on the ratio’s calculation. The various ratios
indicating liquidity, profitability, efficiency, capital structure and stock market performance
will be calculated in order to analyse the company’s financial performance and health.
Unilever PLCULVR. 2021
Liquidity ratio of Unilever Plc
Ratios 2019 2020
Current ratio 0.78 0.79
Quick ratio 0.56 0.55
The ideal current and quick ratios are 2 and 1 respectively. Unilever has current ratio below 2
in past two years which indicates inadequacy of liquid assets in order to meet its short term
obligations and also its quick ratio is below 1 in both the years above indicating weak
liquidity position of Unilever.
Profitability ratios
Ratios 2019 2020
Operating margin 19% 19%
Net profit margin 10.82% 11%
Operating margin indicates that proportion of revenue which remains after paying for
operating expenses while net profit margin is the profit that remains after paying for non-
operating expenses. Here, Unilever has quite stable profitability ratios indicating its stability
of financial performance.
Efficiency ratio
Ratios 2019 2020
Inventory turnover ratio 6.88 6.65
Asset turnover ratio 0.84 0.77
⊘ This is a preview!⊘
Do you want full access?
Subscribe today to unlock all pages.
Trusted by 1+ million students worldwide
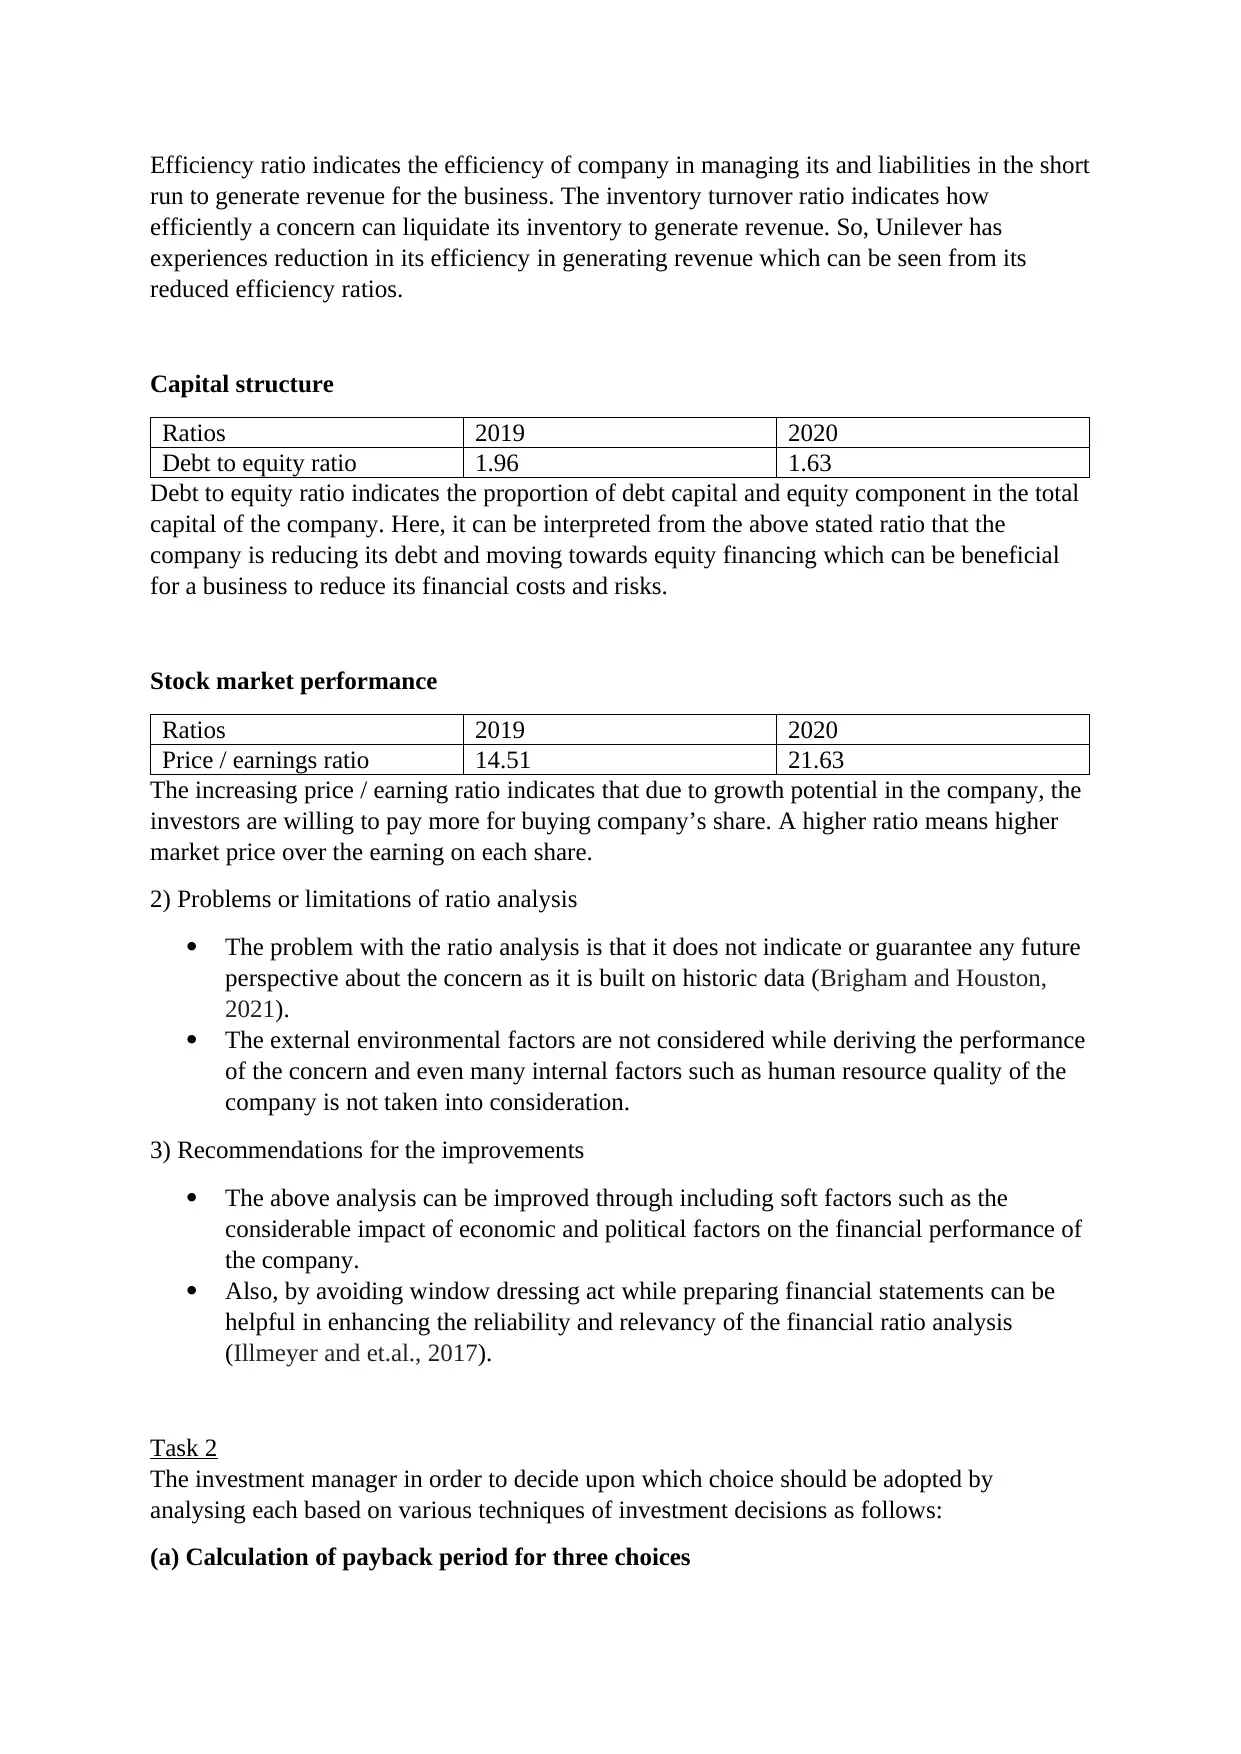
Efficiency ratio indicates the efficiency of company in managing its and liabilities in the short
run to generate revenue for the business. The inventory turnover ratio indicates how
efficiently a concern can liquidate its inventory to generate revenue. So, Unilever has
experiences reduction in its efficiency in generating revenue which can be seen from its
reduced efficiency ratios.
Capital structure
Ratios 2019 2020
Debt to equity ratio 1.96 1.63
Debt to equity ratio indicates the proportion of debt capital and equity component in the total
capital of the company. Here, it can be interpreted from the above stated ratio that the
company is reducing its debt and moving towards equity financing which can be beneficial
for a business to reduce its financial costs and risks.
Stock market performance
Ratios 2019 2020
Price / earnings ratio 14.51 21.63
The increasing price / earning ratio indicates that due to growth potential in the company, the
investors are willing to pay more for buying company’s share. A higher ratio means higher
market price over the earning on each share.
2) Problems or limitations of ratio analysis
The problem with the ratio analysis is that it does not indicate or guarantee any future
perspective about the concern as it is built on historic data (Brigham and Houston,
2021).
The external environmental factors are not considered while deriving the performance
of the concern and even many internal factors such as human resource quality of the
company is not taken into consideration.
3) Recommendations for the improvements
The above analysis can be improved through including soft factors such as the
considerable impact of economic and political factors on the financial performance of
the company.
Also, by avoiding window dressing act while preparing financial statements can be
helpful in enhancing the reliability and relevancy of the financial ratio analysis
(Illmeyer and et.al., 2017).
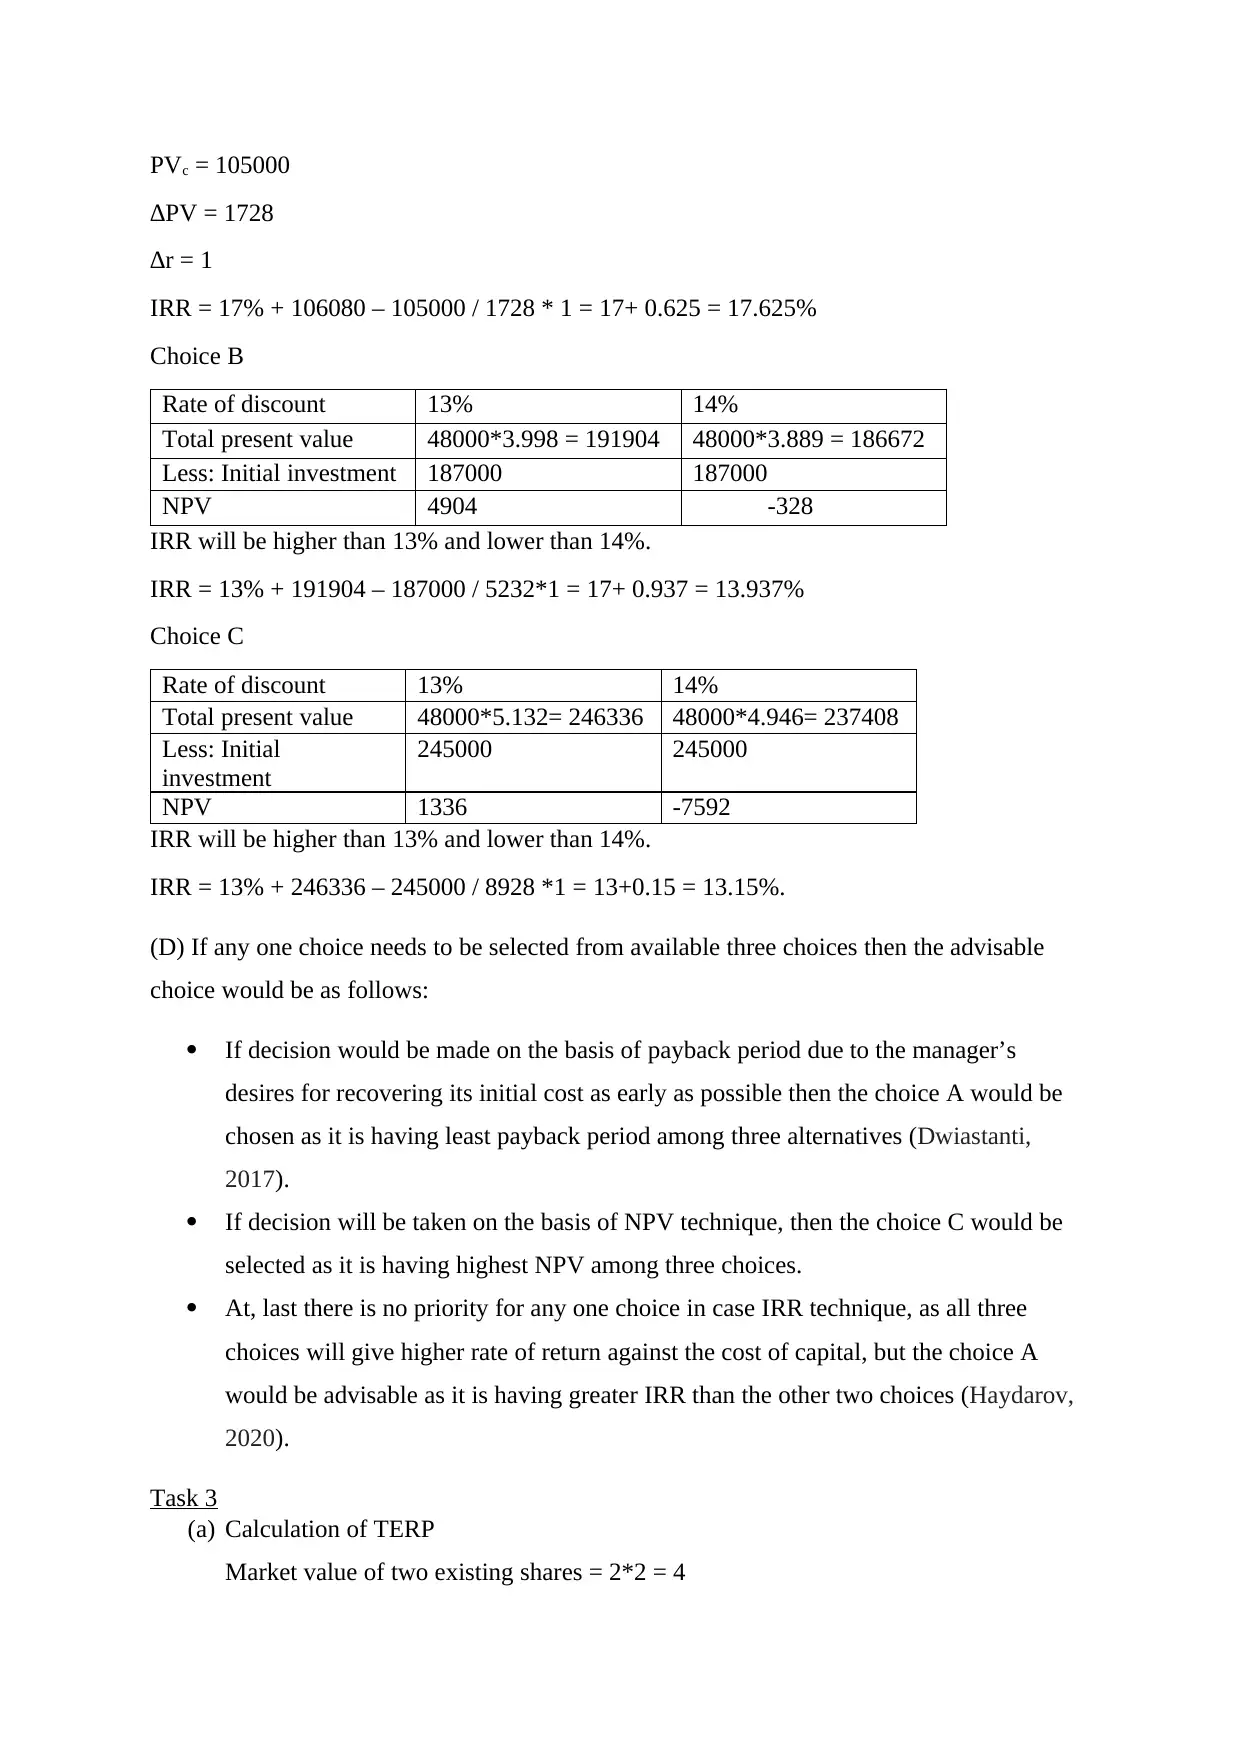
Task 2
The investment manager in order to decide upon which choice should be adopted by
analysing each based on various techniques of investment decisions as follows:
(a) Calculation of payback period for three choices
run to generate revenue for the business. The inventory turnover ratio indicates how
efficiently a concern can liquidate its inventory to generate revenue. So, Unilever has
experiences reduction in its efficiency in generating revenue which can be seen from its
reduced efficiency ratios.
Capital structure
Ratios 2019 2020
Debt to equity ratio 1.96 1.63
Debt to equity ratio indicates the proportion of debt capital and equity component in the total
capital of the company. Here, it can be interpreted from the above stated ratio that the
company is reducing its debt and moving towards equity financing which can be beneficial
for a business to reduce its financial costs and risks.
Stock market performance
Ratios 2019 2020
Price / earnings ratio 14.51 21.63
The increasing price / earning ratio indicates that due to growth potential in the company, the
investors are willing to pay more for buying company’s share. A higher ratio means higher
market price over the earning on each share.
2) Problems or limitations of ratio analysis
The problem with the ratio analysis is that it does not indicate or guarantee any future
perspective about the concern as it is built on historic data (Brigham and Houston,
2021).
The external environmental factors are not considered while deriving the performance
of the concern and even many internal factors such as human resource quality of the
company is not taken into consideration.
3) Recommendations for the improvements
The above analysis can be improved through including soft factors such as the
considerable impact of economic and political factors on the financial performance of
the company.
Also, by avoiding window dressing act while preparing financial statements can be
helpful in enhancing the reliability and relevancy of the financial ratio analysis
(Illmeyer and et.al., 2017).
Task 2
The investment manager in order to decide upon which choice should be adopted by
analysing each based on various techniques of investment decisions as follows:
(a) Calculation of payback period for three choices
Paraphrase This Document
Need a fresh take? Get an instant paraphrase of this document with our AI Paraphraser
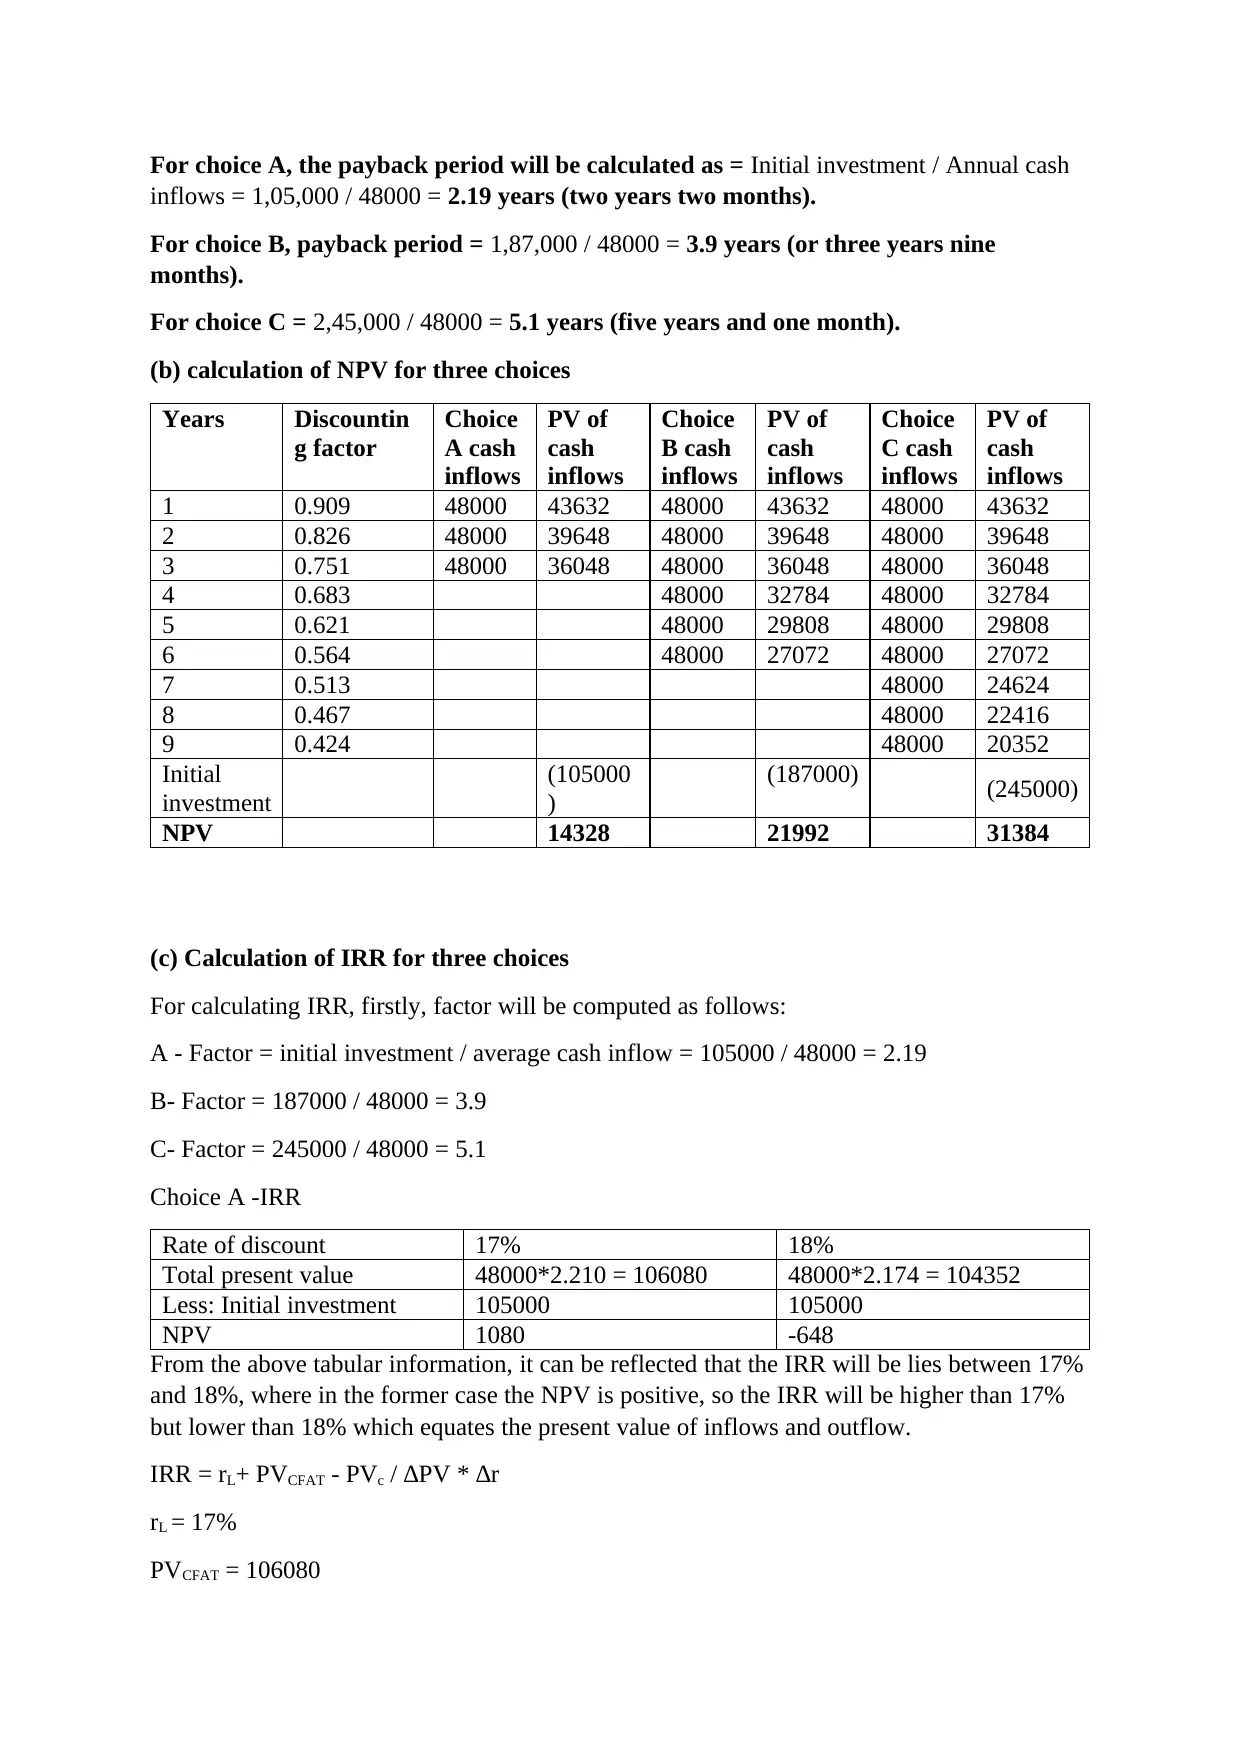
For choice A, the payback period will be calculated as = Initial investment / Annual cash
inflows = 1,05,000 / 48000 = 2.19 years (two years two months).
For choice B, payback period = 1,87,000 / 48000 = 3.9 years (or three years nine
months).
For choice C = 2,45,000 / 48000 = 5.1 years (five years and one month).
(b) calculation of NPV for three choices
Years Discountin
g factor
Choice
A cash
inflows
PV of
cash
inflows
Choice
B cash
inflows
PV of
cash
inflows
Choice
C cash
inflows
PV of
cash
inflows
1 0.909 48000 43632 48000 43632 48000 43632
2 0.826 48000 39648 48000 39648 48000 39648
3 0.751 48000 36048 48000 36048 48000 36048
4 0.683 48000 32784 48000 32784
5 0.621 48000 29808 48000 29808
6 0.564 48000 27072 48000 27072
7 0.513 48000 24624
8 0.467 48000 22416
9 0.424 48000 20352
Initial
investment
(105000
)
(187000) (245000)
NPV 14328 21992 31384
(c) Calculation of IRR for three choices
For calculating IRR, firstly, factor will be computed as follows:
A - Factor = initial investment / average cash inflow = 105000 / 48000 = 2.19
B- Factor = 187000 / 48000 = 3.9
C- Factor = 245000 / 48000 = 5.1
Choice A -IRR
Rate of discount 17% 18%
Total present value 48000*2.210 = 106080 48000*2.174 = 104352
Less: Initial investment 105000 105000
NPV 1080 -648
From the above tabular information, it can be reflected that the IRR will be lies between 17%
and 18%, where in the former case the NPV is positive, so the IRR will be higher than 17%
but lower than 18% which equates the present value of inflows and outflow.
IRR = rL+ PVCFAT - PVc / ∆PV * ∆r
rL = 17%
PVCFAT = 106080
PVc = 105000
∆PV = 1728
∆r = 1
IRR = 17% + 106080 – 105000 / 1728 * 1 = 17+ 0.625 = 17.625%
Choice B
Rate of discount 13% 14%
Total present value 48000*3.998 = 191904 48000*3.889 = 186672
Less: Initial investment 187000 187000
NPV 4904 -328
IRR will be higher than 13% and lower than 14%.
IRR = 13% + 191904 – 187000 / 5232*1 = 17+ 0.937 = 13.937%
Choice C
Rate of discount 13% 14%
Total present value 48000*5.132= 246336 48000*4.946= 237408
Less: Initial
investment
245000 245000
NPV 1336 -7592
IRR will be higher than 13% and lower than 14%.
IRR = 13% + 246336 – 245000 / 8928 *1 = 13+0.15 = 13.15%.
(D) If any one choice needs to be selected from available three choices then the advisable
choice would be as follows:
If decision would be made on the basis of payback period due to the manager’s
desires for recovering its initial cost as early as possible then the choice A would be
chosen as it is having least payback period among three alternatives (Dwiastanti,
2017).
If decision will be taken on the basis of NPV technique, then the choice C would be
selected as it is having highest NPV among three choices.
At, last there is no priority for any one choice in case IRR technique, as all three
choices will give higher rate of return against the cost of capital, but the choice A
would be advisable as it is having greater IRR than the other two choices (Haydarov,
2020).
Task 3
(a) Calculation of TERP
Market value of two existing shares = 2*2 = 4
⊘ This is a preview!⊘
Do you want full access?
Subscribe today to unlock all pages.
Trusted by 1+ million students worldwide
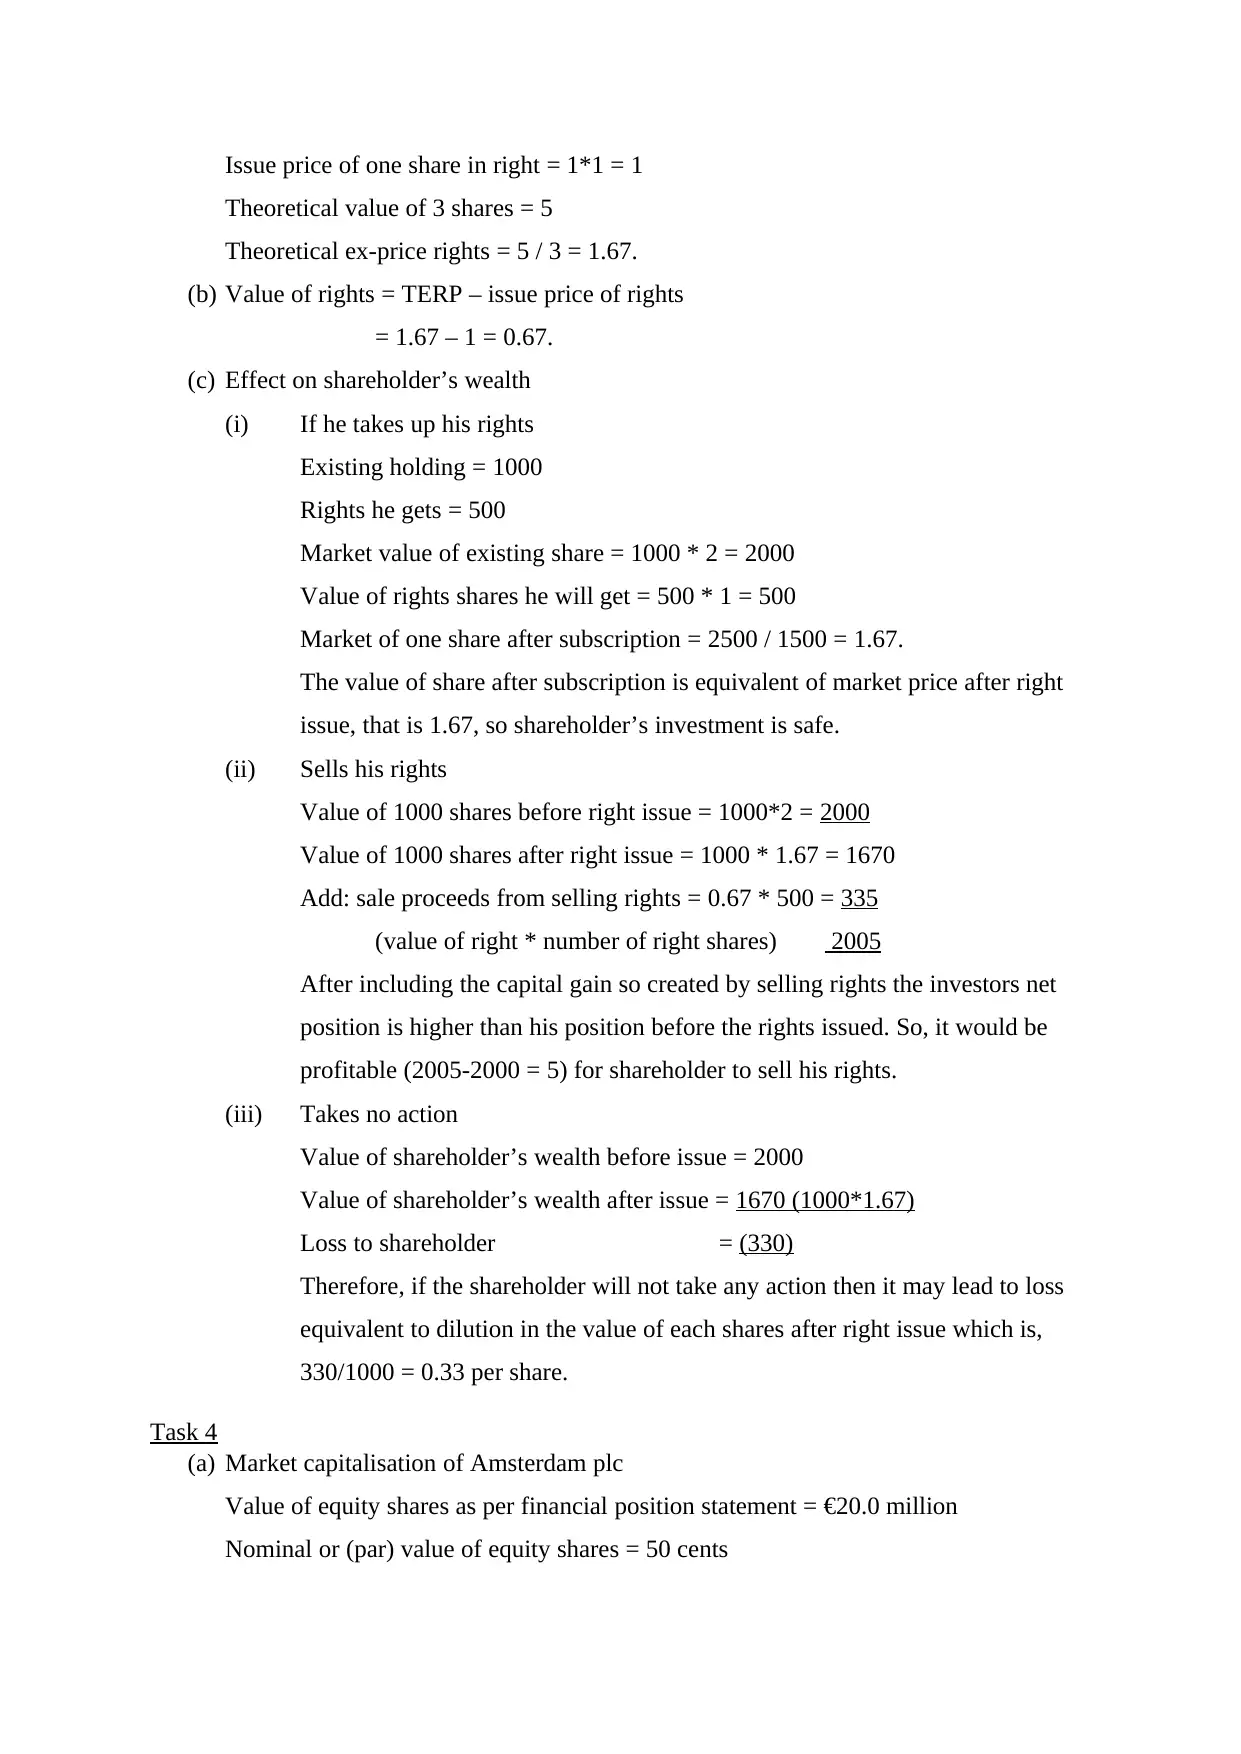
Issue price of one share in right = 1*1 = 1
Theoretical value of 3 shares = 5
Theoretical ex-price rights = 5 / 3 = 1.67.
(b) Value of rights = TERP – issue price of rights
= 1.67 – 1 = 0.67.
(c) Effect on shareholder’s wealth
(i) If he takes up his rights
Existing holding = 1000
Rights he gets = 500
Market value of existing share = 1000 * 2 = 2000
Value of rights shares he will get = 500 * 1 = 500
Market of one share after subscription = 2500 / 1500 = 1.67.
The value of share after subscription is equivalent of market price after right
issue, that is 1.67, so shareholder’s investment is safe.
(ii) Sells his rights
Value of 1000 shares before right issue = 1000*2 = 2000
Value of 1000 shares after right issue = 1000 * 1.67 = 1670
Add: sale proceeds from selling rights = 0.67 * 500 = 335
(value of right * number of right shares) 2005
After including the capital gain so created by selling rights the investors net
position is higher than his position before the rights issued. So, it would be
profitable (2005-2000 = 5) for shareholder to sell his rights.
(iii) Takes no action
Value of shareholder’s wealth before issue = 2000
Value of shareholder’s wealth after issue = 1670 (1000*1.67)
Loss to shareholder = (330)
Therefore, if the shareholder will not take any action then it may lead to loss
equivalent to dilution in the value of each shares after right issue which is,
330/1000 = 0.33 per share.
Task 4
(a) Market capitalisation of Amsterdam plc
Value of equity shares as per financial position statement = €20.0 million
Nominal or (par) value of equity shares = 50 cents
Paraphrase This Document
Need a fresh take? Get an instant paraphrase of this document with our AI Paraphraser
Number of equity shares of the company = 20 million / 0.5 = 40 million shares.
Market price per equity share = €4
Value of Amsterdam plc as per Market capitalisation = 40 million shares * 4
= €160 million.
(b) Net asset value of Amsterdam plc
Calculation of Net realisable value
Non-current assets = €86.0m
Inventories = €4.2m
Trade receivable (80%) = €3.6m
Total realised value = €93.8m
The minimum amount that shareholders should accept = 20 + 47.2 = 67.2
The amount received by the ordinary shareholders will be equivalent to
= 93.8 – (25+7) = €61.8m (value of Amsterdam Plc) .
(c) Value of Amsterdam plc from P/E ratio method
Average price/earning ratio = 17 times
Post tax earning of Amsterdam = €10.1m
Estimated market value of Amsterdam plc = 17 * 10.1 = €171.7m.
(d) Calculating historical dividend growth rates
Year dividen
d
Dividend growth rate
2016 5
2017 5.2 4%
2018 5.6 7.69%
2019 6 7.14%
Average historic dividend growth rate = 4% + 7.69% + 7.14% / 3 = 6.27%.
(e) Advising investor of what they should offer towards buying Amsterdam plc can be
done on the following grounds:
As per market capitalisation the price for buying a company comes out to be 160
million which is much higher than the net realisable value of the company’s total
assets which is €61.8m. Also, the value derived through price/earning method is much
higher as per the industry average. So, it is advisable for potential investors to offer a
good deal of premium price in order to acquire Amsterdam plc as the target seems to
be earning potential.
Task 5
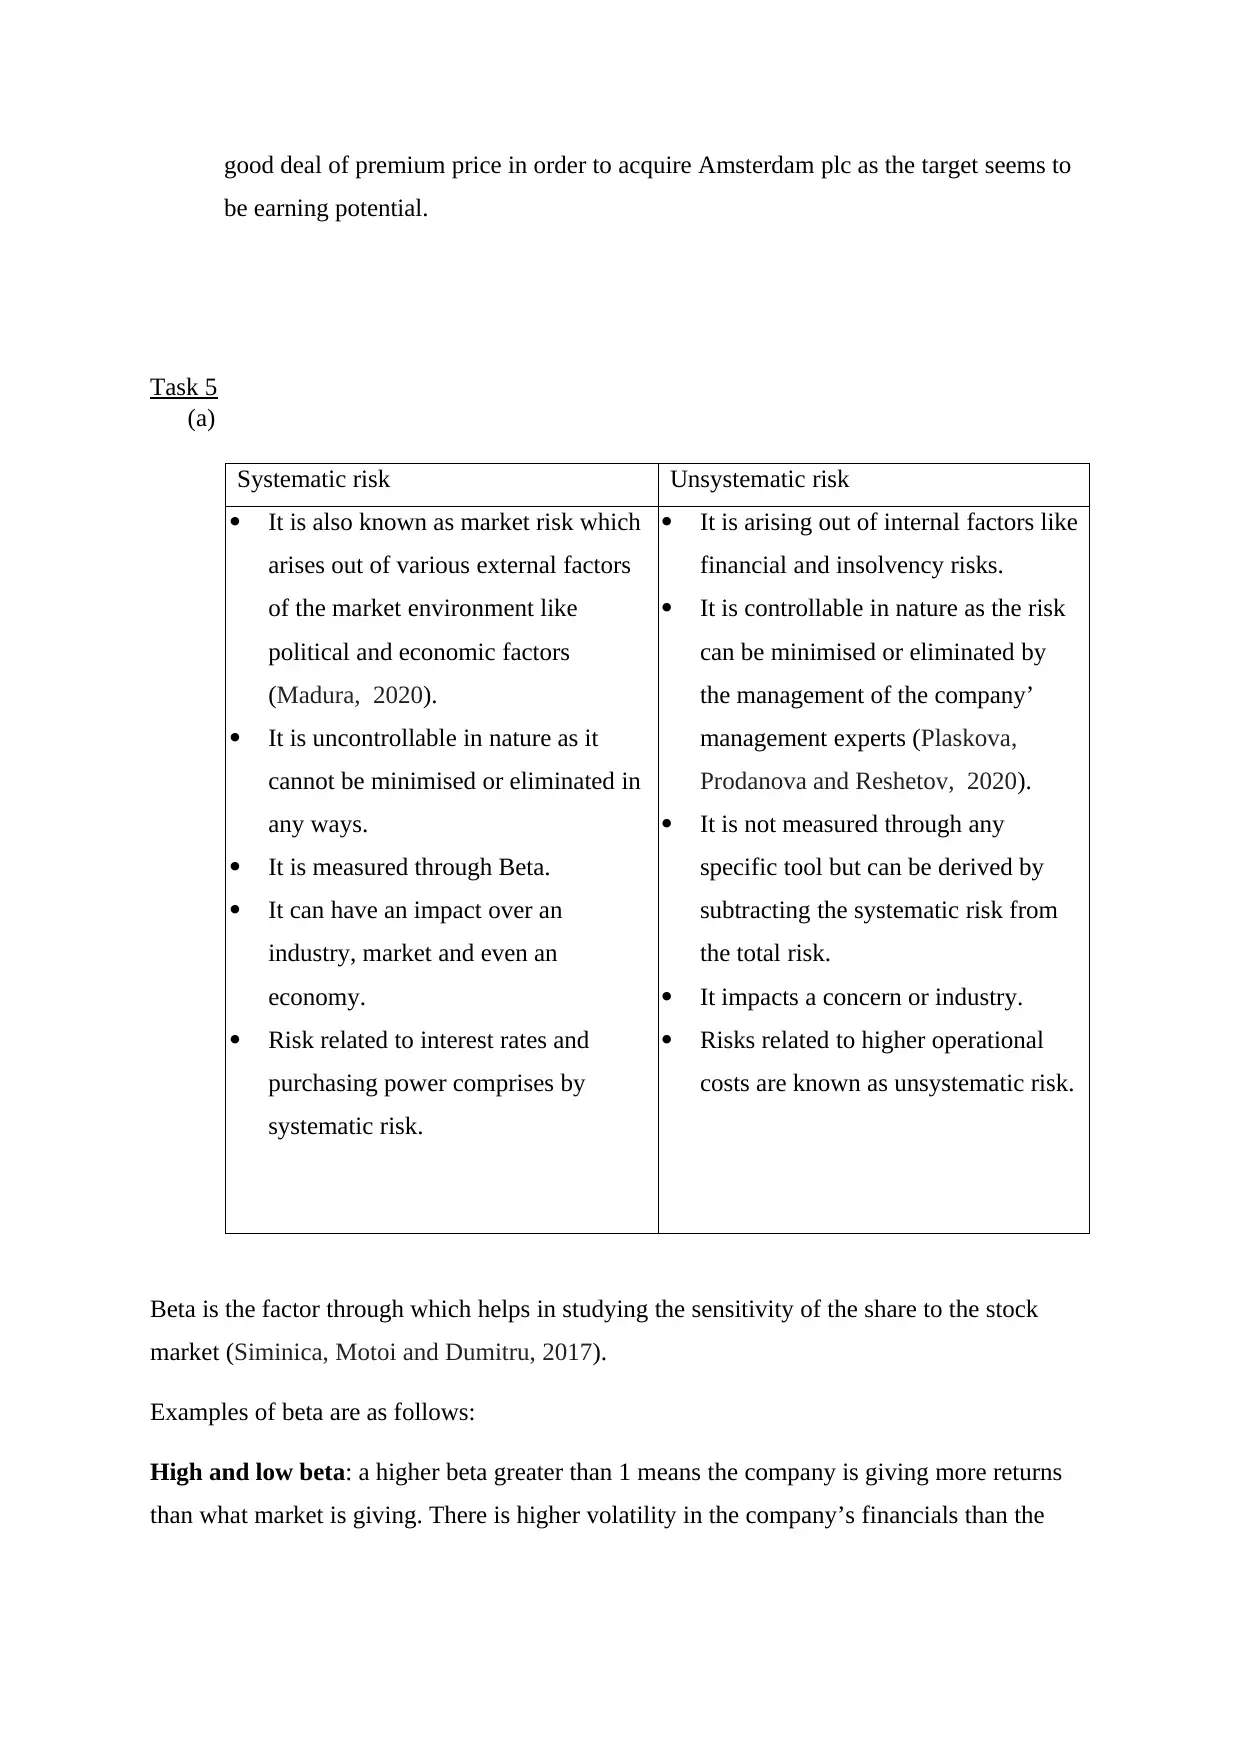
(a)
Systematic risk Unsystematic risk
It is also known as market risk which
arises out of various external factors
of the market environment like
political and economic factors
(Madura, 2020).
It is uncontrollable in nature as it
cannot be minimised or eliminated in
any ways.
It is measured through Beta.
It can have an impact over an
industry, market and even an
economy.
Risk related to interest rates and
purchasing power comprises by
systematic risk.
It is arising out of internal factors like
financial and insolvency risks.
It is controllable in nature as the risk
can be minimised or eliminated by
the management of the company’
management experts (Plaskova,
Prodanova and Reshetov, 2020).
It is not measured through any
specific tool but can be derived by
subtracting the systematic risk from
the total risk.
It impacts a concern or industry.
Risks related to higher operational
costs are known as unsystematic risk.
Beta is the factor through which helps in studying the sensitivity of the share to the stock
market (Siminica, Motoi and Dumitru, 2017).
Examples of beta are as follows:
High and low beta: a higher beta greater than 1 means the company is giving more returns
than what market is giving. There is higher volatility in the company’s financials than the
be earning potential.
Task 5
(a)
Systematic risk Unsystematic risk
It is also known as market risk which
arises out of various external factors
of the market environment like
political and economic factors
(Madura, 2020).
It is uncontrollable in nature as it
cannot be minimised or eliminated in
any ways.
It is measured through Beta.
It can have an impact over an
industry, market and even an
economy.
Risk related to interest rates and
purchasing power comprises by
systematic risk.
It is arising out of internal factors like
financial and insolvency risks.
It is controllable in nature as the risk
can be minimised or eliminated by
the management of the company’
management experts (Plaskova,
Prodanova and Reshetov, 2020).
It is not measured through any
specific tool but can be derived by
subtracting the systematic risk from
the total risk.
It impacts a concern or industry.
Risks related to higher operational
costs are known as unsystematic risk.
Beta is the factor through which helps in studying the sensitivity of the share to the stock
market (Siminica, Motoi and Dumitru, 2017).
Examples of beta are as follows:
High and low beta: a higher beta greater than 1 means the company is giving more returns
than what market is giving. There is higher volatility in the company’s financials than the
⊘ This is a preview!⊘
Do you want full access?
Subscribe today to unlock all pages.
Trusted by 1+ million students worldwide
market. Like a company with 1.5 beta means it is giving 150% of the market return and vice
versa.
Negative beta: a negative beta lower than one means that the company is negatively
correlated with the market return. So, if there is 10% rise in market return and then there
would be reduction by 10% from company’s return.
(b) The basic or main difference between money market and capital market is that in the
former market short term securities with the validity of less than one year are traded
and lending and borrowing is done for a very short period not more than a year
(Shapiro and Hanouna, 2019). In the latter market long term securities are traded
which is having expiry period more than a year and the securities are used for
financing long term operations of the company.
Interest bearing instruments are those which pays a fixed rate of interests either at
regular intervals or even it can be on maturity. On the other hand, discount
instruments are those which is issued in the market at the discounted value which is
less than the face value of the instruments and on maturity, the redemption has been
done on the face value it possesses.
Examples of capital market instruments
Ordinary Stocks: It can be either equity or preference shares. It is issued to the
company’s shareholders in order to procure finance for the business. It pays variable
dividend to the shareholders.
Bonds: bonds are highly secured debt instruments, which pays fixed interest and
repaid the principle on maturity. It provides companies with the growth capital.
Preference stocks: It is a quite like ordinary stocks but here the shareholders are given
preference while paying dividend over ordinary shareholders (Yap, Komalasari and
Hadiansah, 2018).
Examples of money market instruments
Treasury bills: short term instrument issued by the central bank of the country on
behalf of the government having maturity of less than a year, and issued at a
discounted rate and repayment is done on face value, where the difference between
the two is the return earned by the investors.
Commercial papers: a kind of promissory noted issued by large corporations in order
to meet their short-term fund requirement. It is issued against the company’s
credibility as a security and are generally considered as an unsecured instrument.
Paraphrase This Document
Need a fresh take? Get an instant paraphrase of this document with our AI Paraphraser
Certificate of deposits: an instrument issued by financial institutions and banks
known as a financial asset and gives the investors fixed return on the amount so
invested. It has a maturity ranging from a week to a year (Brigham and Houston,
2021).
(c) Difference between risk and uncertainty
Risk Uncertainty
Risk can define as the situation
of either losing or winning at the
future date due to the outcome of
current decisions (Kembauw and
et.al., 2020).
Risk can be measured in
quantitative terms through the
applications of various
theoretical models.
The risks can be measured
through assigning probabilities
to the potential outcomes that
can take place in future.
Uncertainty is the condition
where nothing can be said or
predicted about any future events
as there is nothing known about
it.
As nothing can be predicted
about future, uncertainty can
never be represented in a
quantitative term.
The outcomes are not
predictable, and hence no
probabilities can be assigned for
its determination.
(d) An overdraft is the facility provided by the bankers to their premium or regular
customers where the customer can withdraw amount over and above what is existing
in the current account of the customers (Bulturbayevich and et.al., 2020). It is suitable
for financing day to day business expenses in order to manage the liquidity of the
concern. But here the manager is considering the purchase of business property which
is a long term fund requirement of the company and it is advisable to finance this
proposal through bank loan rather than bank overdraft as overdraft is not suitable for
such long term funding due to the following reasons:
It must be repaid on demand from bank, so problem of withdrawal of overdraft
facility at any point of time makes it unsuitable for long term funding.
There is a need to provide business assets as security.
The cost derived from interest rates are much higher in case of overdraft
facility if it is used for long term aspect.
CONCLUSION
From the above report it has been concluded that management of every company must
give enough considerations towards the financial management aspects of the business. The
minor mistakes in financial decision making can bring huge losses to the business and even
leads to the failure of the concern.
REFERENCES
Bulturbayevich, M. B., and et.al., 2020. Modern features of financial management in small
businesses. International Engineering Journal For Research & Development, 5(4),
pp.5-5.
Kembauw, E., and et.al., 2020. Strategies of Financial Management Quality Control in
Busines
Brigham, E. F. and Houston, J. F., 2021. Fundamentals of financial management. Cengage
Learning.
Yap, R. J. C., Komalasari, F. and Hadiansah, I., 2018. The effect of financial literacy and
attitude on financial management behavior and satisfaction. BISNIS & BIROKRASI:
Jurnal Ilmu Administrasi dan Organisasi, 23(3).
Shapiro, A. C. and Hanouna, P., 2019. Multinational financial management. John Wiley &
Sons.
Siminica, M., Motoi, A. G. and Dumitru, A., 2017. Financial management as component of
tactical management. Polish Journal of Management Studies, 15.
Madura, J., 2020. International financial management. Cengage Learning.
Plaskova, N. S., Prodanova, N. A. and Reshetov, K. Y., 2020. Dealing Operations as a Means
of Improving the Efficiency of the Financial Management of a Production Company.
In Complex Systems: Innovation and Sustainability in the Digital Age (pp. 61-70).
Springer, Cham.
Haydarov, U., 2020. Financial management system, tools, sources of investment activities
and factors. Архив научных исследований, 35.
Dwiastanti, A., 2017. Analysis of financial knowledge and financial attitude on locus of
control and financial management behavior. MBR (Management and Business
Review), 1(1), pp.1-8.
Illmeyer, M., and et.al., 2017. The impact of financial management on
innovation. Entrepreneurship and Sustainability Issues, 5(1), pp.58-71.
Brigham, E. F. and Houston, J. F., 2021. Fundamentals of financial management: Concise.
Cengage Learning.
⊘ This is a preview!⊘
Do you want full access?
Subscribe today to unlock all pages.
Trusted by 1+ million students worldwide
1 out of 13
Related Documents


Your All-in-One AI-Powered Toolkit for Academic Success.
+13062052269
info@desklib.com
Available 24*7 on WhatsApp / Email
![[object Object]](/_next/static/media/star-bottom.7253800d.svg)
Unlock your academic potential
Copyright © 2020–2026 A2Z Services. All Rights Reserved. Developed and managed by ZUCOL.